Multiyear projections
So far, this chapter has focused on one-year projections and pro forma adjustments to current financial statements. Such exercises, however, represent nothing more than the foundation of a complete projection.
A fixed-income investor buying a 30-year bond is certainly interested in the issuer’s financial prospects beyond a 12-month horizon. Similarly, a substantial percentage of the present value of future dividends represented by a stock’s price lies in years beyond the coming one. Even if particular investors plan to hold the securities for one year or less, they have an interest in estimating longer-term projections. Their ability, 6 or 12 months hence, to sell at attractive prices will depend on other investors’ views at the time of the issuer’s prospects.The inherent volatility of economic conditions makes long-term projections a perilous undertaking. In the late 1970s, prognosticators generally expected then-prevailing tightness in energy supplies to persist and to worsen, resulting in continued escalation of oil prices. The implications of this scenario included large profits for oil producers and boom conditions for manufacturers of oil exploration supplies, energy-conservation products, and alternative-energy equipment. By the early 1980s, the energy picture had changed from scarcity to glut, and many companies that had expected prosperity instead suffered bankruptcy. In subsequent years, numerous other discontinuities have forced companies to revise their long- range plans. They have included:
■ A wave of sovereign debt defaults by less developed countries in Latin America.
■ A stock market crash on October 19, 1987.
■ A huge wave of leveraged buyout bankruptcies.
■ A war in the Persian Gulf.
■ A boom-and-bust in Internet stocks.
name=bookmark412>■ A financial crisis in Asia.
■ The September 11, 2001, terrorist attacks on the Pentagon and World Trade Center.
The frequency of such shocks makes it difficult to have high confidence in projections covering periods even as short as five years.
Notwithstanding their potential for badly missing the mark, multiyear projections are essential to financial analysis in some situations.
For example, certain capital-intensive companies such as paper manufacturers have long construction cycles. They add to their capacity not in steady, annual increments but through large, individual plants that take several years to build. While a plant is in construction, the company must pay interest on the huge sums borrowed to finance it. This increased expense depresses earnings until the point, several years out, when the new plant comes onstream and begins to generate revenues. To obtain a true picture of the company’s long-range financial condition, the analyst must somehow factor in the income statements for the fourth and fifth years of the construction project. These are far more difficult to forecast than first- or second-year results, which reflect cyclical peak borrowings and interest costs.Radical financial restructurings also necessitate multiyear projections. Examples include leveraged buyouts, megamergers, and massive stock buybacks. The short-term impact of these transactions is to increase financial risk sharply. Often, leverage rises to a level investors are comfortable with only if they believe the company will be able to reduce debt to more customary levels within a few years. Sources of debt repayment may include both cash flow and proceeds of planned asset sales. Analysts must make projections to determine whether the plan for debt retirement rests on realistic assumptions. A lender cannot prudently enter into a highly leveraged transaction without making some attempt to project results over several years, notwithstanding the uncertainties inherent in such long- range forecasts.
Fortunately for analysts, electronic spreadsheets make it feasible to run numerous scenarios for proposed transactions. Analysts can vary the underlying economic assumptions and deal terms as they change from day to day. Once the company’s financial structure becomes definitive, the analyst can input the final numbers into the spreadsheet.
From that point, the critical task is to monitor the restructured company’s quarter-by-quarter progress, comparing actual results with projections.Electronic spreadsheets are helpful in analyzing conventionally capitalized companies, as well as highly leveraged transactions. In projecting the financials of companies with already-strong balance sheets, however, analysts should not assume that all excess cash flow will be directed toward debt retirement. Conservatively capitalized companies generally do not seek to reduce their financial leverage below some specified level. Instead, they use surplus funds to repurchase stock or make acquisitions.
Essentially, multiyear projections involve the same sorts of assumptions described in the one-year Colossal Chemical projection (Exhibits 12.1 through 12.12). When looking forward by as much as five years, though, the analyst must be esp ecially cognizant of the impact of the business cycle. Many companies’ projected financial statements look fine as long as sales grow “like a hockey stick” (sloping uninterruptedly upward). Their financial strength dissipates quickly, however, when sales turn downward for a year or two.
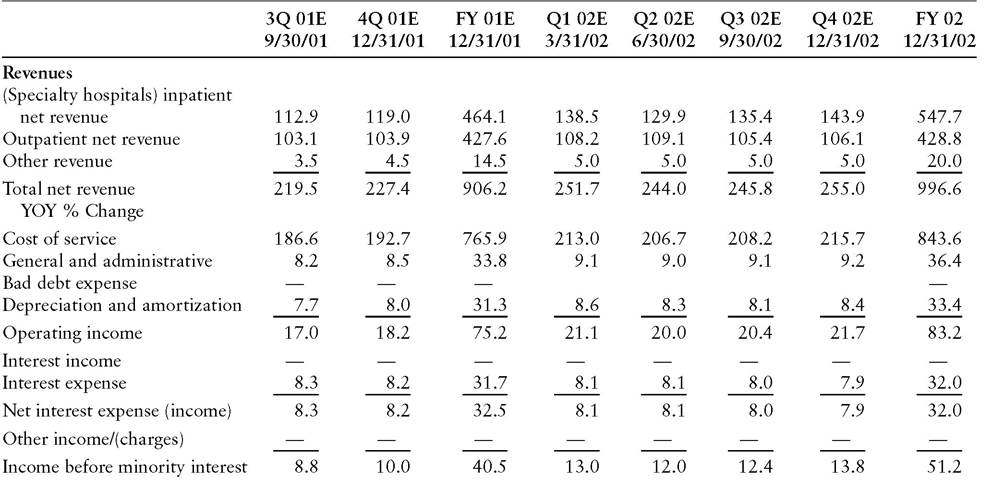
Notwithstanding the many uncertainties that confront the financial forecaster, carefully constructed projections can prove fairly accurate. The results can be satisfying even when the numbers are strongly influenced by hard-to- predict economic variables. The two detailed projections reproduced as Exhibits 12.19 through 12.31 were generated by Merrill Lynch high-yield health care analyst Susannah Gray. These exhibits show how the bottoms-up approach illustrated in the fictitious Colossal Chemical example can be applied in real life to companies outside the basic industry sphere.
Select Medical
Select Medical operates specialty acute care hospitals for long-term stay patients with serious medical conditions such as cancer and cardiac disorders.
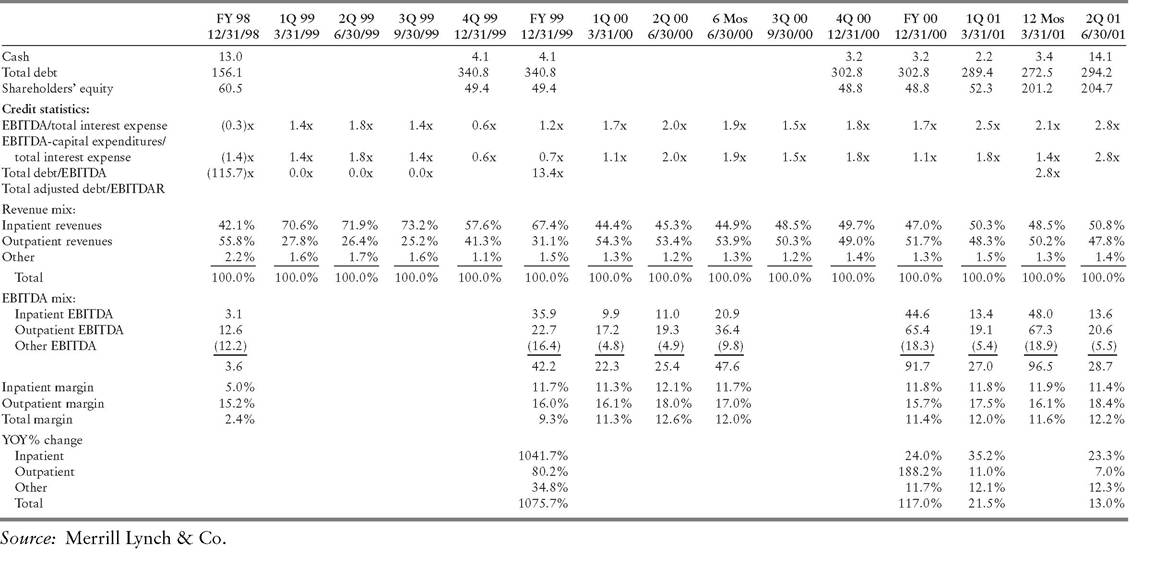
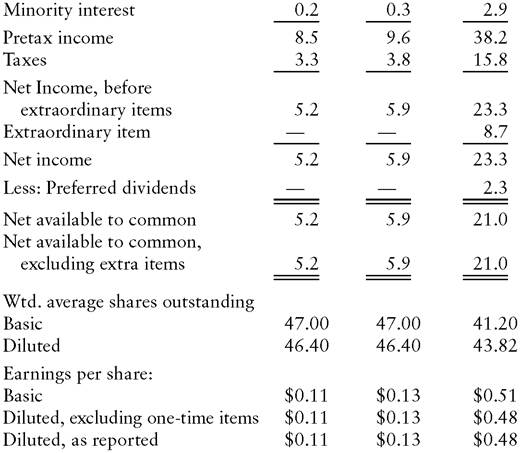
The company also operates outpatient rehabilitation clinics that provide physical, speech, and occupational therapy.Historical financials (Exhibits 12.19-12.22) provide a reality check for projections. Helpfully, the company provides an inpatient versus outpatient breakdown of revenues (Exhibit 12.20). The challenge of forecasting Select Medical’s financial results is underscored by the variability of its historical performance. On a quarterly basis, the company’s EBITDA margin (EBITDA ÷ Total Net Revenue) ranged between 7.5% and 12.6% between the beginning of 1999 and the middle of 2001 and was only 2.4% during the full year 1998 (Exhibit 12.21).
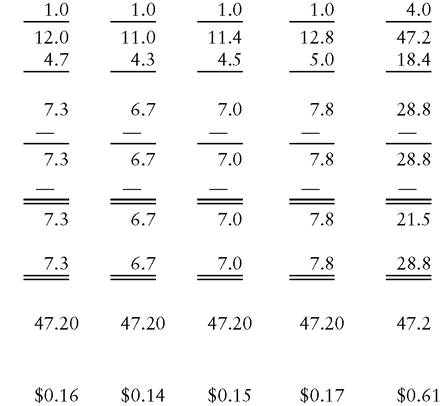
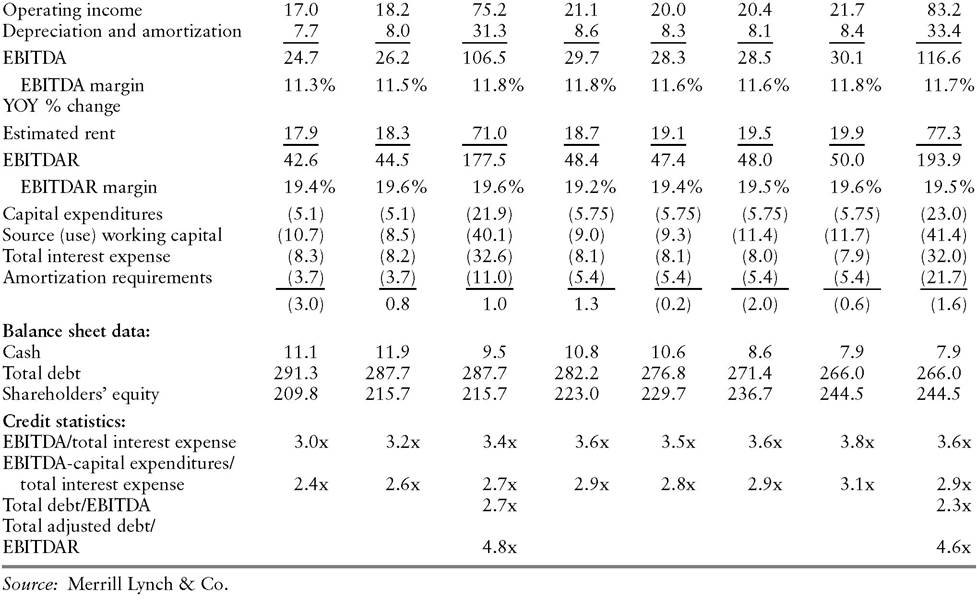
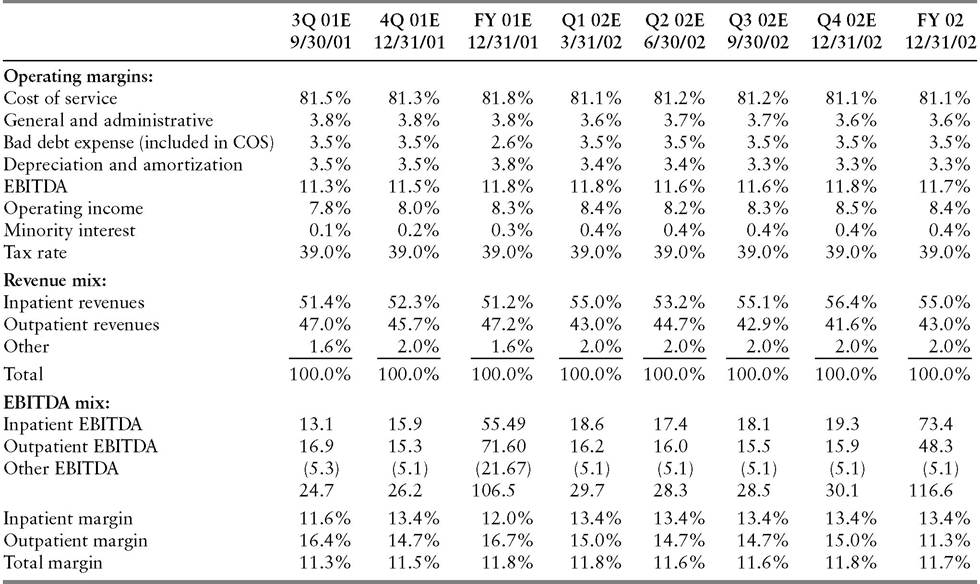
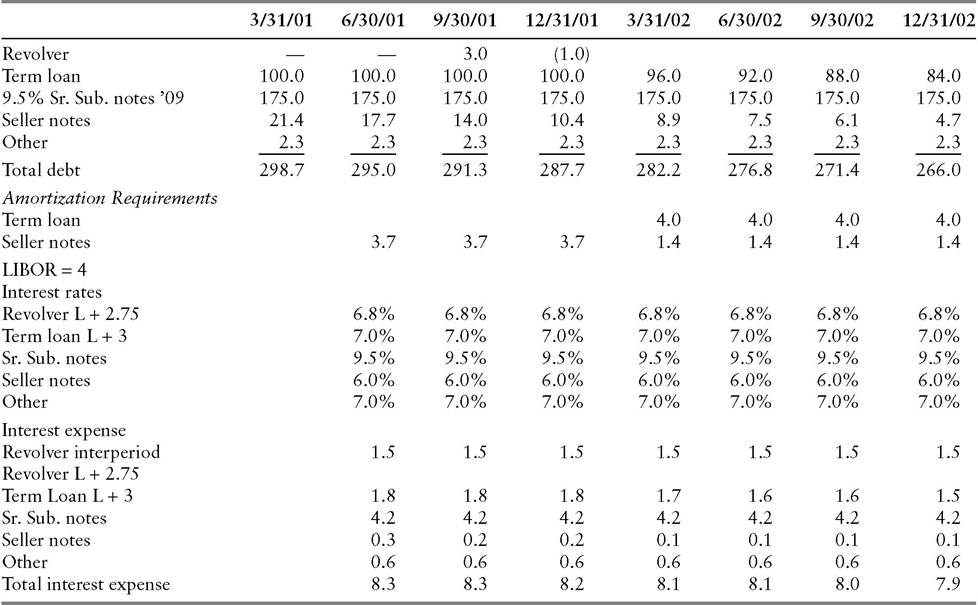
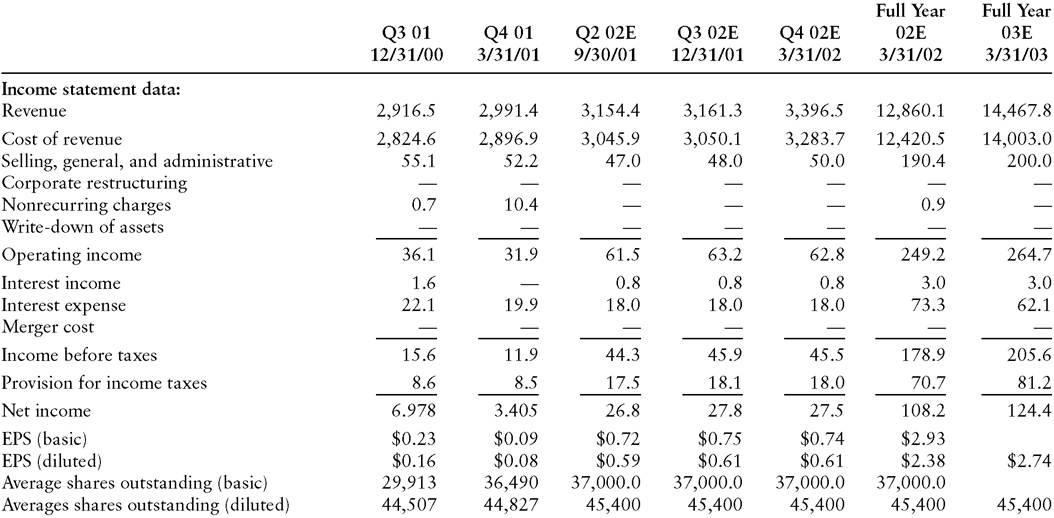
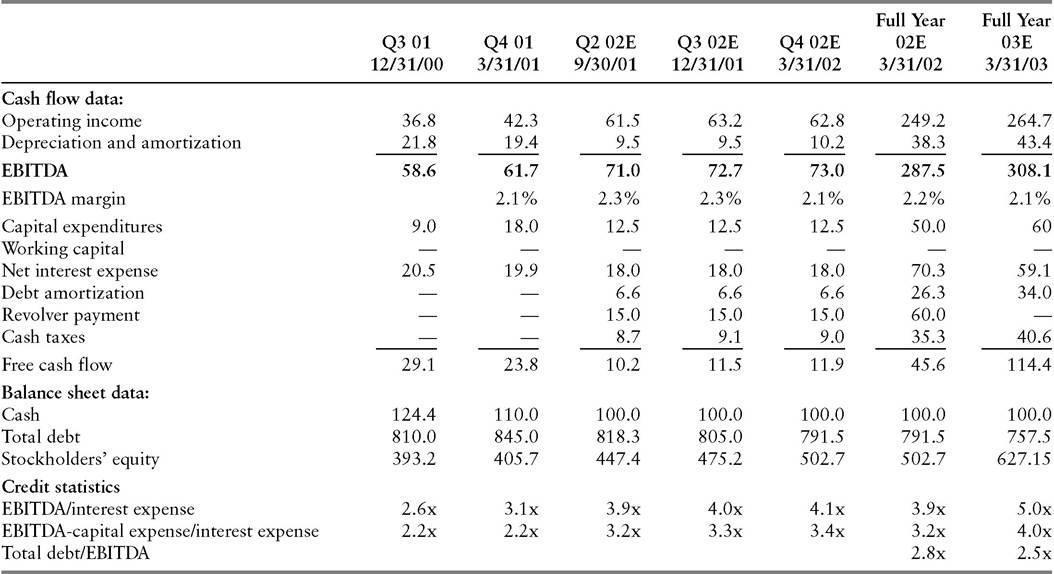
Gray’s forecast through the end of 2002 (Exhibits 12.23 and 12.24) show EBITDA margin stabilizing in a range of 11.3% to 11.8%. The analyst projects a rise in EBITDA coverage of total interest expense, from 3.0 × in the third quarter of 2001 to 3.6× for the full year 2002. She also foresees a favorable trend in financial leverage, with the ratio of total debt to EBITDA declining from 2.7× on December 31, 2001 to 4.6× one year later.
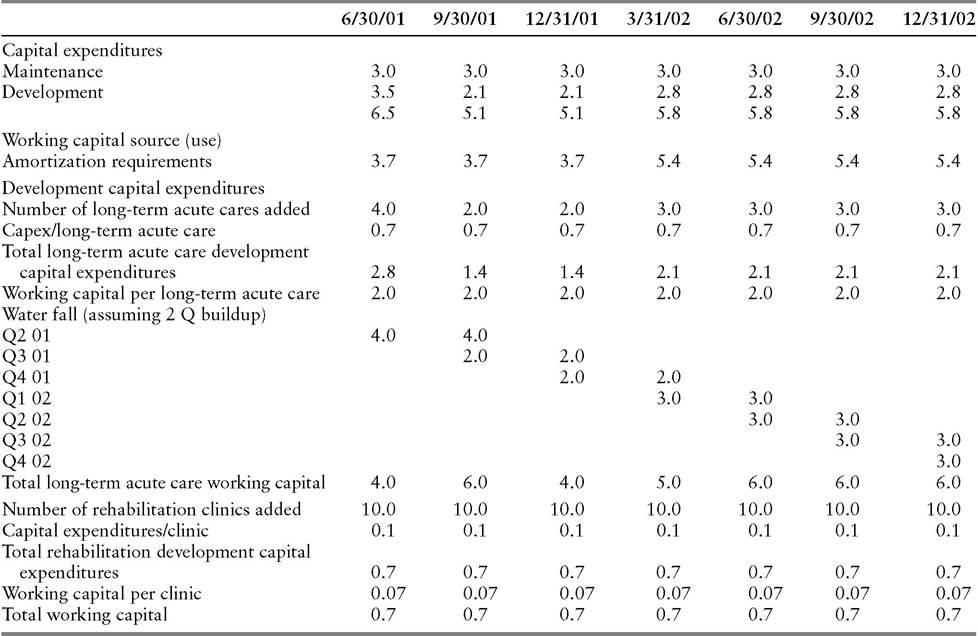
Exhibit 12.24 goes a level deeper to show the expected margins that produce the projected income statement. Underlying those percentages, in turn, are the forecasted operating statistics of Exhibit 12.25. A key determinant of Select Medical’s revenue and earnings growth is the number of longterm acute care (LTAC) hospitals that it operates. Gray projects an increase from 58 in the second quarter of 2001, the last historical quarter preceding her forecast, to 76 in the fourth quarter of 2002. Revenues are also sensitive to the occupancy rate, which is influenced in turn by admissions and length of stay. Similarly, revenue at the outpatient rehabilitation clinics is sensitive to the number of clinics owned and operated, as well as the number of visits.
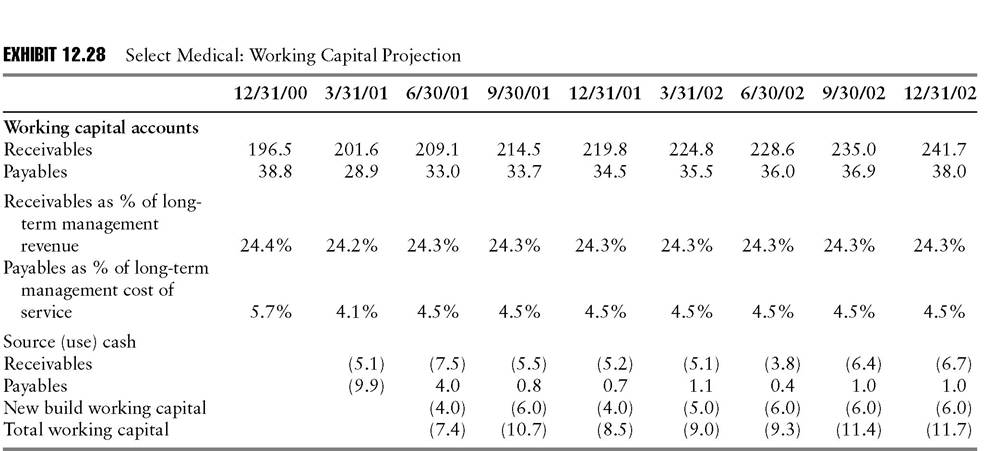
Exhibits 12.26 through 12.28 indicate the fixed and working capital requirements implied by the growth projections and the resulting impact on outstanding debt and interest expense.EXHIBIT 12.19 Select Medical: Quarterly Income Statement
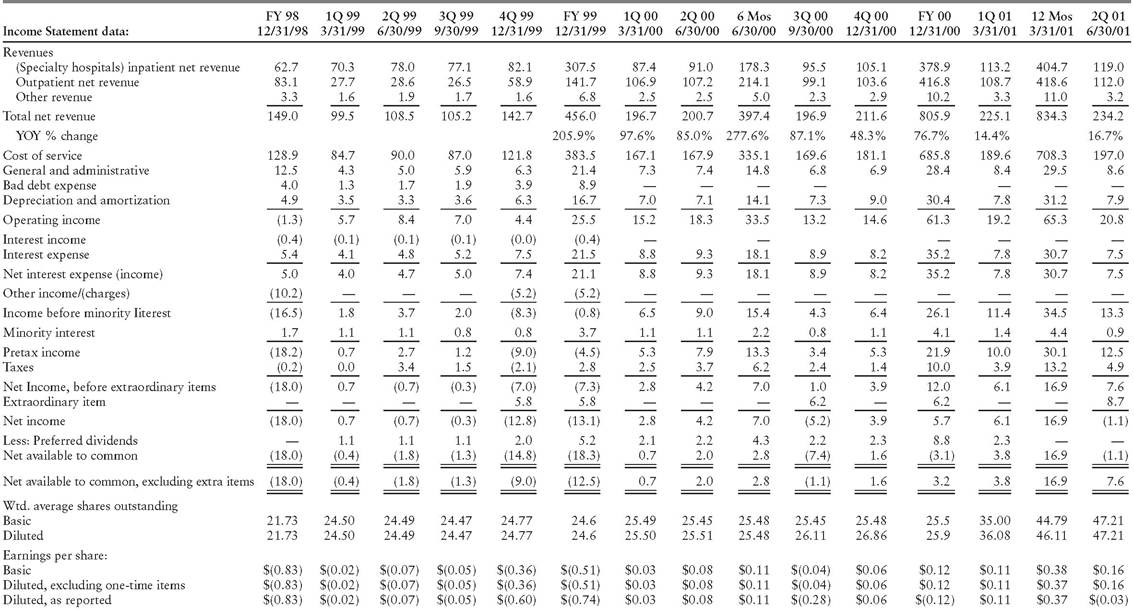
Source: Merrill Lynch & Co.
EXHIBIT 12.20 Select Medical: Balance Sheet Data
EXHBIT 12.21 Select Medical: Cash Flow Data
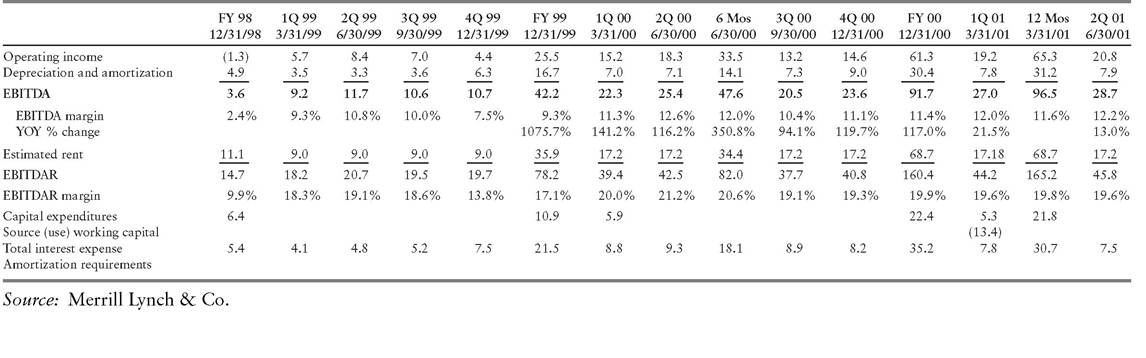
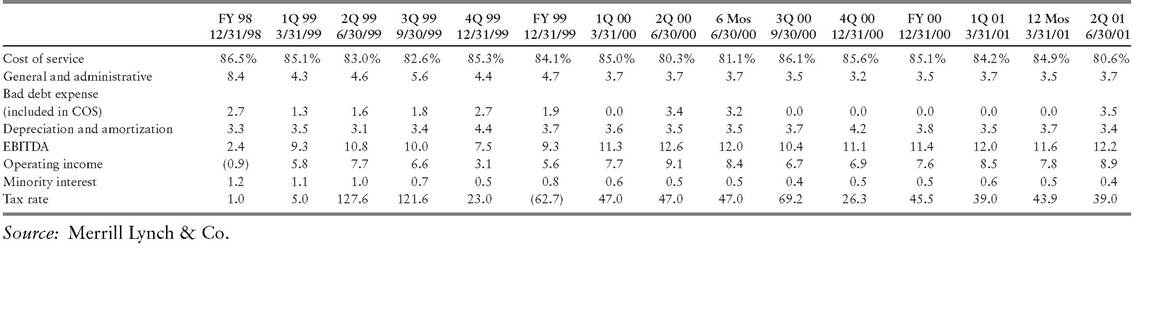
EXHIBIT 12.23 Select Medical: Income Statement Data
(continued)
Cash Flow Data:
gj Source: Merrill Lynch & Co.
EXHIBIT 12.25 Select Medical: Revenue Projections
size=3 color=black face="Microsoft Sans Serif">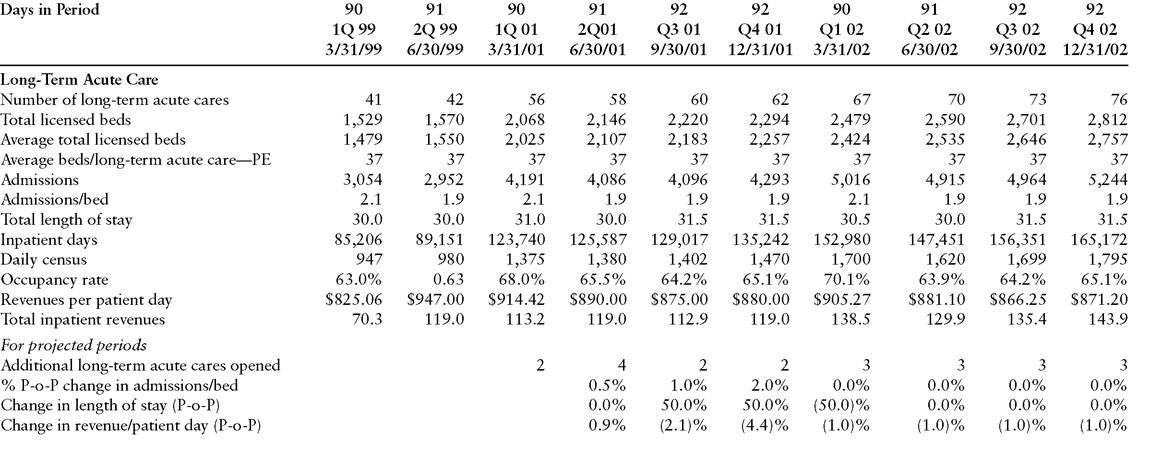
Outpatient rehabilitation clinics
(excluding managed facilities)
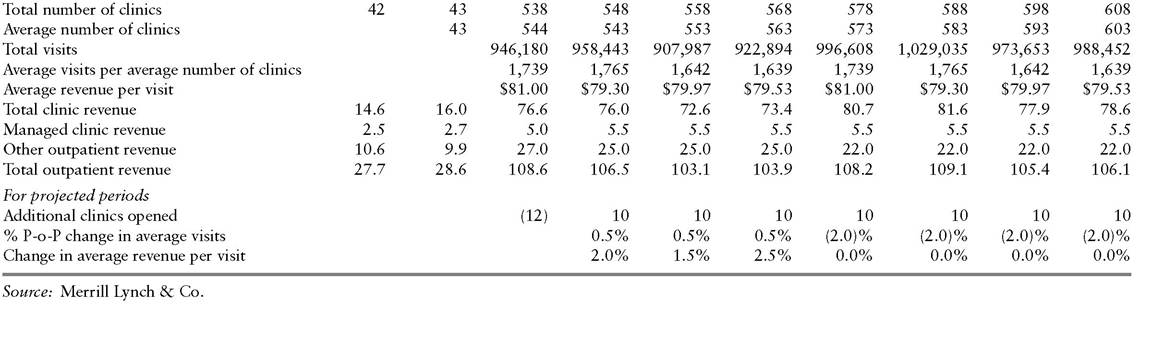
EXHIBIT 12.26 Select Medical: Debt Service ProjectionPro Forma as of March 31, 2001
Source: Merrill Lynch & Co.
Source: Merrill Lynch & Co.
ĂÎ â»
Source: Merrill Lynch & Co.
(continued)
Source: Merrill Lynch & Co.
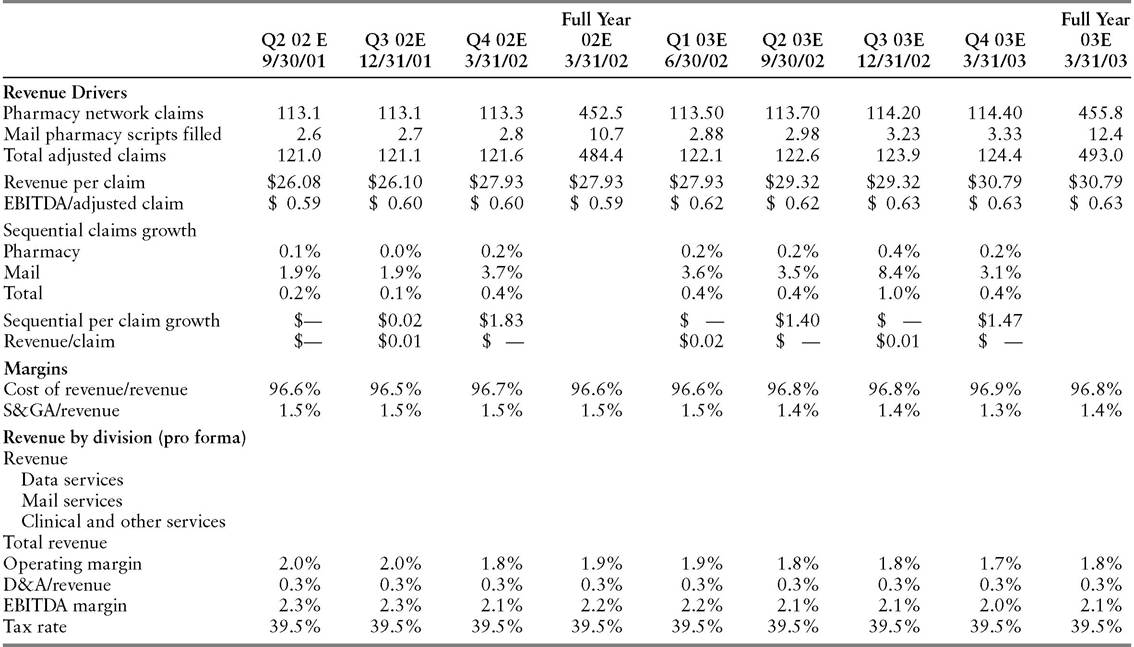
EXHIBIT 12.30 AdvancePCS: Forecast Assumptions
Source: Merrill Lynch & Co.
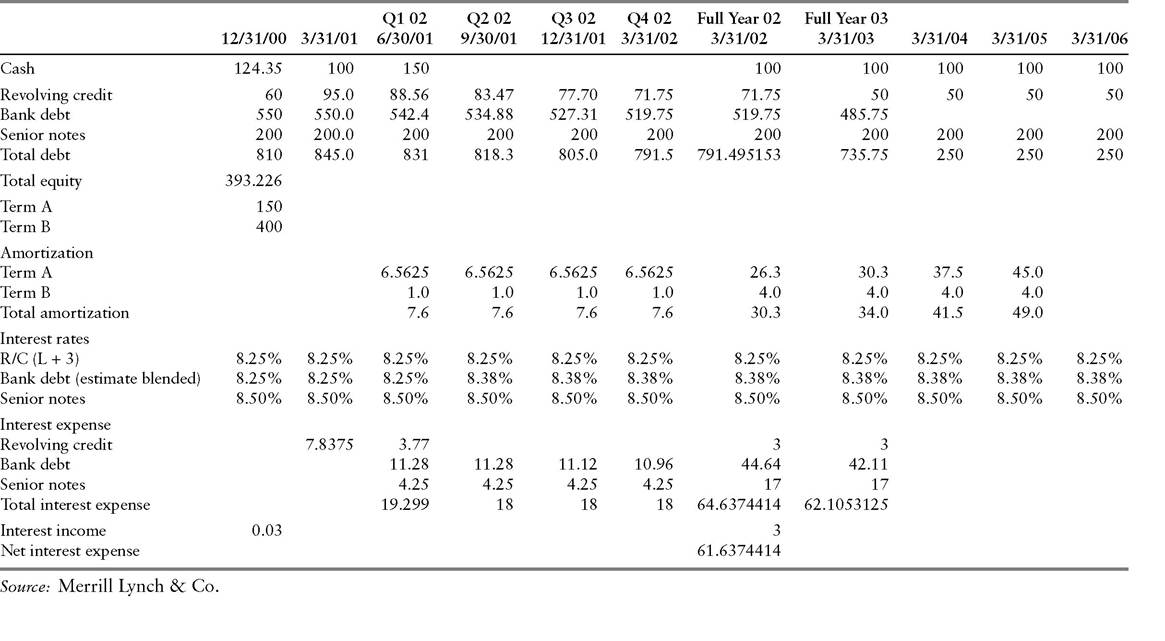
EXHIBIT 12.31 AdvancePCS: Debt Service Projection
AdvancePCS
AdvancePCS provides a variety of health improvement services, including integrated mail service, retail pharmacy networks, clinical services, customized disease management programs, research on clinical trials and outcomes, prescription drug service for the uninsured, and an Internet pharmacy.
As a service provider, the company does not have substantial working capital requirements, unlike manufacturers and retailers that must carry large inventories. class=a7 style='text-indent:18.0pt'>Analyst Gray’s forecasting task is consequently less complex than in the case of Select Medical. The company’s historical and projected revenue (Exhibit 12.29) is largely a function of pharmacy network claims and prescriptions filled by mail (Exhibit 12.30). Gray projects rising revenue per claim, based largely on continued escalation in the price of prescription drugs. Also contributing to the expected rise in revenue per claim is growth in the mail order business, which tends to fill larger orders (three-month, as opposed to one-month prescriptions) than the other pharmacy operations. Again in contrast to Select Medical, AdvancePCS enjoys extremely stable margins. Exhibit 12.31 rounds out the story with a projection of debt service requirements.