RELATING RATIOS TO CREDIT RISK
The discussion of financial ratios up to this point has sidestepped an obvious and critical question: How does an analyst who has calculated a ratio know whether it represents good, bad, or indifferent credit quality? Somehow, the analyst must relate the ratio to the likelihood that the borrower will satisfy all scheduled interest and principal payments in full and on time.
In practice, this is accomplished by testing financial ratios as predictors of the borrower’s propensity not to pay (to default). For example, a company with high financial leverage is statistically more likely to default than one with low leverage, all other things being equal. Similarly, high fixed-charge coverage implies less default risk than low coverage. After identifying the factors that create high default risk, the analyst can use ratios to rank all borrowers on a relative scale of propensity to default.Many credit analysts conduct their ratio analyses within ranking frameworks established by their employers. Individuals engaged in processing loan applications may use criteria derived from the lending institution’s experience over many years in recognizing the financial characteristics that lead to timely payment or to default. In the securities field, bond ratings provide a structure for analysis. Exhibits 13.5 and 13.6 show the rating definitions of two leading bond rating agencies, Moody’s Investors Service and Standard & Poor’s. (The following discussion uses the rating notations and their corresponding “spoken equivalents” interchangeably—AAA and Triple-A, AA and Double-A, etc.)
Because much credit work is done in the context of established standards, the next order of business is to explain how companies can be ranked by ratios on a relative scale of credit quality.
Bond ratings are the standard on which the discussion focuses, but the principles are applicable to inhouse credit-ranking schemes that analysts may encounter. Following a demonstration of the use of credit rating standards, the chapter concludes with an examination of the methods underlying the construction of standards to show readers how financial ratios are linked to default risk.The analysis in this section focuses primarily on determining the probability that a borrower will pay interest and principal in full and on time. It does not address the percentage of principal that the lender is likely to recover in the event of default. Certainly, expected recoveries have an important bearing on the decision to extend or deny credit, as well as on the valuation of debt securities. Bankruptcy analysis, however, is a huge topic in its own right. Its proper practice depends on a detailed knowledge of the relevant legislation and a thorough understanding of the dynamics of the negotiations between creditors and the management of a company in Chapter 11 reorganization proceedings. Such matters are beyond the scope of the present work. For the securities of highly rated companies, moreover, the potential p ercentage recovery of principal tends to be a comparatively minor valuation factor. Over the short to intermediate term, the probability of a bankruptcy filing by such a company is small.
Although the reader will not find a complete guide to bankruptcy analysis in these pages, Chapter 14 is relevant from the standpoint of determining
EXHIBIT 13.5 Moody’s Bond Ratings (Definitions) Debt Ratings
Aaa
Bonds and preferred stock which are rated Aaa are judged to be of the best quality. They carry the smallest degree of investment risk and are generally referred to as “gilt edged.” Interest payments are protected by a large or by an exceptionally stable margin and principal is secure.
While the various protective elements are likely to change, such changes as can be visualized are most unlikely to impair the fundamentally strong position of such issues.Aa
Bonds and preferred stock which are rated Aa are judged to be of high quality by all standards. Together with the Aaa group they comprise what are generally known as high-grade bonds. They are rated lower than the best bonds because margins of protection may not be as large as in Aaa securities or fluctuation of protective elements may be of greater amplitude or there may be other elements present which make the long-term risk appear somewhat larger than the Aaa securities.
A
Bonds and preferred stock which are rated A possess many favorable investment attributes and are to be considered as upper-medium-grade obligations. Factors giving security to principal and interest are considered adequate, but elements may be present which suggest a susceptibility to impairment some time in the future.
Baa
Bonds and preferred stock which are rated Baa are considered as medium-grade obligations (i.e., they are neither highly protected nor poorly secured). Interest payments and principal security appear adequate for the present but certain protective elements may be lacking or may be characteristically unreliable over any great length of time. Such bonds lack outstanding investment characteristics and in fact have speculative characteristics as well.
Ba
Bonds and preferred stock which are rated Ba are judged to have speculative elements; their future cannot be considered as well-assured. Often the protection of interest and principal payments may be very moderate, and thereby not well safeguarded during both good and bad times over the future.
Uncertainty of position characterizes bonds in this class.B
size=1 color=black face=Cambria>Bonds and preferred stock which are rated B generally lack characteristics of the desirable investment. Assurance of interest and principal payments or of maintenance of other terms of the contract over any long period of time may be small.
Caa
Bonds and preferred stock which are rated Caa are of poor standing. Such issues may be in default or there may be present elements of danger with respect to principal or interest.
EXHIBIT 13.5 Continued
Ca
Bonds and preferred stock which are rated Ca represent obligations which are speculative in a high degree. Such issues are often in default or have other marked shortcomings.
C
Bonds and preferred stock which are rated C are the lowest rated class of bonds, and issues so rated can be regarded as having extremely poor prospects of ever attaining any real investment standing.
Moody’s assigns ratings to individual debt securities issued from medium-term note (MTN) programs, in addition to indicating ratings to MTN programs themselves. Notes issued under MTN programs with such indicated ratings are rated at issuance at the rating applicable to all pari passu notes issued under the same program, at the program’s relevant indicated rating, provided such notes do not exhibit any of the characteristics listed below. For notes with any of the following characteristics, the rating of the individual note may differ from the indicated rating of the program:
1) Notes containing features which link the cash flow and/or market value to the credit performance of any third party or parties.
2) Notes allowing for negative coupons, or negative principal.
3) Notes containing any provision which could obligate the investor to make any additional payments.
Market participants must determine whether any particular note is rated, and if so, at what rating level.
Moody’s encourages market participants to contact Moody’s Ratings Desks directly if they have questions regarding ratings for specific notes issued under a medium-term note program.Note: Moody’s applies numerical modifiers 1, 2, and 3 in each generic rating classification from Aa through Caa. The modifier 1 indicates that the obligation ranks in the higher end of its generic rating category; the modifier 2 indicates a mid-range ranking; and the modifier 3 indicates a ranking in the lower end of that generic rating category.
Source: Reprinted with permission from Moody’s Investors Service.
EXHIBIT 13.6 Standard & Poor’s Bond Ratings (definitions)
Issue Credit Rating Definitions
A Standard & Poor’s issue credit rating is a current opinion of the creditworthiness of an obligor with respect to a specific financial obligation, a specific class of financial obligations, or a specific financial program (including ratings on medium term note programs and commercial paper programs). It takes into consideration the creditworthiness of guarantors, insurers, or other forms of credit enhancement on the obligation and takes into account the currency in which the obligation is denominated. The issue credit rating is not a recommendation to purchase, sell, or hold a financial obligation, inasmuch as it does not comment as to market price or suitability for a particular investor. Issue credit ratings are based on current information furnished by the obligors or obtained by Standard & Poor’s from other sources it considers reliable. Standard & Poor’s does not perform an audit in connection with any credit rating and may, on occasion, rely on unaudited financial information. Credit ratings may be changed, suspended, or withdrawn as a result of changes in, or unavailability of, such information, or based on other circumstances.
Issue credit ratings can be either long-term or short-term. Short-term ratings are generally assigned to those obligations considered short-term in the relevant market. In the U.S., for example, that means obligations with an original maturity of no more than 365 days—including commercial paper. Short-term ratings are also used to indicate the creditworthiness of an obligor with respect to put features on long-term obligations. The result is a dual rating, in which the short-term rating addresses the put feature, in addition to the usual long-term rating. Mediumterm notes are assigned long-term ratings.style='font-size:8.5pt;line-height:110%;font-weight:bold'>Long-term issue credit ratings
Issue credit ratings are based, in varying degrees, on the following considerations:
• Likelihood of payment-capacity and willingness of the obligor to meet its financial commitment on an obligation in accordance with the terms of the obligation;
• Nature of and provisions of the obligation;
• Protection afforded by, and relative position of, the obligation in the event of bankruptcy, reorganization, or other arrangement under the laws of bankruptcy and other laws affecting creditors’ rights.
The issue rating definitions are expressed in terms of default risk. As such, they pertain to senior obligations of an entity. Junior obligations are typically rated lower than senior obligations, to reflect the lower priority in bankruptcy, as noted above. (Such differentiation applies when an entity has both senior and subordinated obligations, secured and unsecured obligations, or operating company and holding company obligations.) Accordingly, in the case of junior debt, the rating may not conform exactly with the category definition.
EXHIBIT 13.6 Continued
AAA
An obligation rated “AAA” has the highest rating assigned by Standard & Poor’s. The obligor’s capacity to meet its financial commitment on the obligation is extremely strong.
AA
An obligation rated “AA” differs from the highest rated obligations only in small degree. The obligor’s capacity to meet its financial commitment on the obligation is very strong.
A
An obligation rated “A” is somewhat more susceptible to the adverse effects of changes in circumstances and economic conditions than obligations in higher rated categories. However, the obligor’s capacity to meet its financial commitment on the obligation is still strong.
BBB
An obligation rated “BBB” exhibits adequate protection parameters. However, adverse economic conditions or changing circumstances are more likely to lead to a weakened capacity of the obligor to meet its financial commitment on the obligation. Obligations rated “BB,” “B,” “CCC,” “CC,” and “C” are regarded as having significant speculative characteristics. “BB” indicates the least degree of speculation and “C” the highest. While such obligations will likely have some quality and protective characteristics, these may be outweighed by large uncertainties or major exposures to adverse conditions.
BB
An obligation rated “BB” is less vulnerable to nonpayment than other speculative issues. However, it faces major ongoing uncertainties or exposure to adverse business, financial, or economic conditions which could lead to the obligor’s inadequate capacity to meet its financial commitment on the obligation.
B
An obligation rated “B” is more vulnerable to nonpayment than obligations rated “BB,” but the obligor currently has the capacity to meet its financial commitment on the obligation. Adverse business, financial, or economic conditions will likely impair the obligor’s capacity or willingness to meet its financial commitment on the obligation.
CCC
An obligation rated “CCC” is currently vulnerable to nonpayment, and is dependent upon favorable business, financial, and economic conditions for the obligor to meet its financial commitment on the obligation. In the event of adverse business, financial, or economic conditions, the obligor is not likely to have the capacity to meet its financial commitment on the obligation.
(continued)
EXHIBIT 13.6 Continued
CC
class=50 style='line-height:110%'>An obligation rated “CC” is currently highly vulnerable to nonpayment.C
A subordinated debt or preferred stock obligation rated “C” is CURRENTLY HIGHLY VULNERABLE to nonpayment. The “C” rating may be used to cover a situation where a bankruptcy petition has been filed or similar action taken, but payments on this obligation are being continued. A “C” also will be assigned to a preferred stock issue in arrears on dividends or sinking fund payments, but that is currently paying.
D
An obligation rated “D” is in payment default. The “D” rating category is used when payments on an obligation are not made on the date due even if the applicable grace period has not expired, unless Standard & Poor’s believes that such payments will be made during such grace period. The “D” rating also will be used upon the filing of a bankruptcy petition or the taking of a similar action if payments on an obligation are jeopardized.
Plus (+) or minus (-)
The ratings from “AA” to “CCC” may be modified by the addition of a plus or minus sign to show relative standing within the major rating categories.
r
This symbol is attached to the ratings of instruments with significant noncredit risks. It highlights risks to principal or volatility of expected returns which are not addressed in the credit rating.
N.R.
This indicates that no rating has been requested, that there is insufficient information on which to base a rating, or that Standard & Poor’s does not rate a particular obligation as a matter of policy.
Short-term issue credit ratings
A-1
A short-term obligation rated “A-1” is rated in the highest category by Standard & Poor’s. The obligor’s capacity to meet its financial commitment on the obligation is strong. Within this category, certain obligations are designated with a plus sign (+). This indicates that the obligor’s capacity to meet its financial commitment on these obligations is extremely strong.
A-2
A short-term obligation rated “A-2” is somewhat more susceptible to the adverse effects of changes in circumstances and economic conditions than obligations in higher rating categories. However, the obligor’s capacity to meet its financial commitment on the obligation is satisfactory.
EXHIBIT 13.6 Continued
A-3
A short-term obligation rated “A-3” exhibits adequate protection parameters. However, adverse economic conditions or changing circumstances are more likely to lead to a weakened capacity of the obligor to meet its financial commitment on the obligation.
B
A short-term obligation rated “B” is regarded as having significant speculative characteristics. The obligor currently has the capacity to meet its financial commitment on the obligation; however, it faces major ongoing uncertainties which could lead to the obligor’s inadequate capacity to meet its financial commitment on the obligation.
C
A short-term obligation rated “C” is currently vulnerable to nonpayment and is dependent upon favorable business, financial, and economic conditions for the obligor to meet its financial commitment on the obligation.
D
A short-term obligation rated “D” is in payment default. The “D” rating category is used when payments on an obligation are not made on the date due even if the applicable grace period has not expired, unless Standard & Poor’s believes that such payments will be made during such grace period. The “D” rating also will be used upon the filing of a bankruptcy petition or the taking of a similar action if payments on an obligation are jeopardized.
Local currency and foreign currency risks
Country risk considerations are a standard part of Standard & Poor’s analysis for credit ratings on any issuer or issue. Currency of repayment is a key factor in this analysis. An obligor’s capacity to repay foreign currency obligations may be lower than its capacity to repay obligations in its local currency due to the sovereign government’s own relatively lower capacity to repay external versus domestic debt. These sovereign risk considerations are incorporated in the debt ratings assigned to specific issues. Foreign currency issuer ratings are also distinguished from local currency issuer ratings to identify those instances where sovereign risks make them different for the same issuer.
Source: Used with permission from sandp.com, a website from Standard & Poor’s (www.standardpoor.com/ResourceCenter/RatingsDefinitions.html). the failed firm’s equity value, a key step in the reorganization or liquidation of the company. In addition, the Bibliography includes books that discuss bankruptcy in extensive detail.
Comparative Ratio Analysis
The basic technique in assigning a relative credit ranking is to compare a company’s ratio with those of a peer group. Size and line of business are the key criteria for identifying a company’s peers.
On the matter of size, a manufacturer with $5 billion in annual sales will ordinarily be a better credit risk than one with similar financial ratios but only $5 million in sales. As a generalization, bigger companies enjoy economies of scale and have greater leverage with suppliers by virtue of their larger purchasing power. A big company can spread the risks of obsolescence and competitive challenges over a wide range of products and customers, whereas a smaller competitor’s sales are likely to be concentrated on a few products and customers. Particularly vulnerable is a company with just a single manufacturing facility. An unexpected loss of production could prove fatal to such an enterprise. Lack of depth in management is another problem commonly associated with smaller companies.
Unquestionably, some very large companies have failed in the past. There is ample evidence, as well, of inefficiency in many large, bureaucratic organizations. The point, however, is not to debate whether big corporations are invincible or nimble, but to determine whether they meet their obligations with greater regularity, on average, than their pint-sized peers. Statistical models of default risk confirm that they do. Therefore, the bond rating agencies are following sound methodology when they create sizebased peer groups.
A survey of Standard & Poor’s Compustat database in 2001 identified 452 companies with ratings on their senior debt and shareholders’ equity of less than $200 million. Of that total, only 40 were rated in the investment grade category, defined as BBB- or higher and just 11 were rated A- or higher. The concentration of smaller companies in the speculative grade category, defined as BB+ or lower, supports a strong presumption on S&P’s part that size is inversely correlated with propensity to default.
Line of business is another basis for defining a peer group. Because different industries have different financial characteristics, ratio comparisons across industry lines may not be valid. A machinery manufacturer’s sales may fluctuate substantially over the capital goods cycle. In contrast, a packaged food company derives its revenues from essential products that are in demand year in and year out. The food processor therefore has greater predictability of earnings and cash flow. It can tolerate a higher level of fixed charges, implying a larger proportion of debt in its capital structure, than the machinery manufacturer. The rating agencies may assign Double-A ratings to a food company with a 35% ratio of total debt to total capital, whereas a machinery maker with a similar ratio might be rated no higher than Single-A.
A ratio comparison between a packaged food producer and a machinery manufacturer sheds little light. The latter company can look good in comparison with the former, yet still be too highly leveraged in view of the operating risks in its industry. Comparability problems become even more pronounced when ratio analysis crosses boundaries of broadly defined sectors of the economy (e.g., industrial, financial, utility, and transportation).
Carrying this principle to its logical conclusion, however, requires a peer group consisting of companies with virtually identical product lines. Operating risk varies to some extent even among closely allied businesses. Strictly speaking, a producer of coated white paper is not comparable to a producer of kraft linerboard, nor a producer of facial tissue to a producer of fine writing paper.
Too zealous an effort to create homogeneous peer groups, though, narrows the field to such an extent that ratio comparisons begin to suffer from having too few data points. At the extreme, a comparison with only one other peer company is not terribly informative. The company being evaluated may rank above its lone peer, but the analyst does not know whether the peer is strong or weak.
Suppose, on the other hand, that with respect to a particular financial ratio a company ranks fourth among a peer group of ten companies, with eight in the group tightly distributed around the median and with one outlier each at the high and low ends. It is valid to say that the company has average risk within its peer group, at least in terms of one particular ratio.
There are two techniques for resolving the trade-off between strict comparability and adequate sample size. By employing both, the analyst can achieve a satisfactory assessment of relative credit risk.
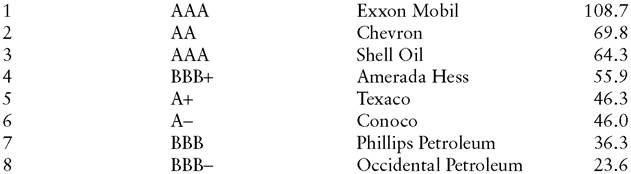
The first technique is to compare the company against a narrowly defined industry peer group, as in Exhibit 13.7. The credit analyst can use this type of analysis to “slot” a company within its industry. The ratios in the sample comparison are averages, computed over three years. Averaging minimizes the impact of unrepresentative results that any company may report in a single year. Observe as well that the eight-member peer group includes only oil companies and is further restricted to the integrated competitors. (An integrated company produces, transports, refines, and
EXHIBIT 13.7 Comparative Ratio Analysis of Integrated Oil and Gas Companies Annual Average 1998-2000
Rank Standard & Poor’s Rating Company Times
Pretax Interest Coverage
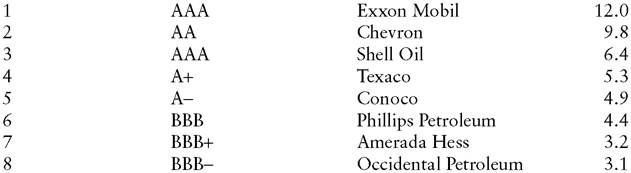
Funds Flow as a Percentage of Total Debt
Total Debt as a Percentage of Capital
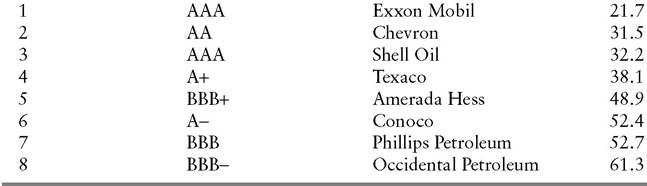
markets petroleum. An independent company, on the other hand, typically performs only one of those functions.)
ExxonMobil ranks well ahead of all its competitors on each of the three financial ratios. It deserves to carry the peer group’s highest rating, which is also the highest on Standard & Poor’s scale, AAA. Similarly, Occidental Petroleum ranks eighth on each financial measure and carries the group’s lowest rating, BBB-.
Among the remaining members of the integrated oil peer group, the correspondence between ranking and rating is less exact. The companies in slots 4 through 7 trade places from one ratio to the next. Other considerations by which the rating agencies establish a pecking order under such circumstances include subjective assessments of competitive position, management quality, and the like. Observe also that Chevron outranks Shell Oil by every measure shown, yet is rated lower (AA versus AAA). This seeming anomaly is explained by Shell Oil’s position as a key subsidiary of a vast multinational enterprise, Royal Dutch/Shell Group of Companies. Although the parent company does not formally guarantee the subsidiary’s debt, Standard & Poor’s awards Shell Oil the AAA rating of Royal Dutch/Shell on the basis of implicit credit support.
Exhibit 13.7 also brings out an important characteristic of financial ratios—their interrelatedness. Except for Amerada Hess, no company ranks further than one slot away from where it ranks on the other measures. This is not a chance result. It would be difficult for a company to have (as an example), both a comparatively high ratio of debt to capital and comparatively high interest coverage. A combination of unusually low-interest-rate debt and exceptionally high return on capital could produce such a result, but it is hardly a common occurrence.
An important implication of this observation is that beyond a certain point, calculating and comparing companies on the basis of additional financial ratios contributes little incremental insight. Each additional ratio merely represents a new way of expressing information already contained in the analysis. Accordingly, analysts rely on a limited number of ratios to extract the bulk of the information obtainable through this mode of analysis. They can put their remaining time and energy to best use by searching for other pertinent facts, both inside and outside the financial statements.
The second technique of comparative ratio analysis is to rank a company within a rating peer group. As noted, it is not appropriate to compare companies in disparate sectors of the economy, such as industrials and utilities. A rating peer group can, however, legitimately include a variety of industries within a broadly defined economic sector. The expanded sample available under this approach enables the analyst to fine-tune the slotting achieved via the industry peer group comparisons.
Instead of displaying ratios for all 151 industrial companies rated Single-A by Standard & Poor’s, Exhibit 13.8 lists the medians for the Sin- gle-A group. As a further aid in slotting companies, the table includes the cutoff points for the upper and lower quartiles in the rankings of Single-A companies.
Texaco’s rating at the high end (Astyle='font-size:9.5pt;font-family:"Arial",sans-serif'>+) of the Single-A peer group appears generous, relative to its ranking within the rating peer group. The company’s statistics approximately match the medians for funds flow as a percentage of
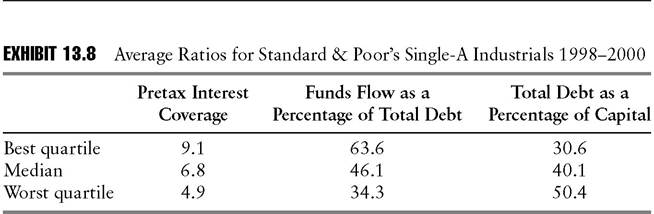
Source: Standard & Poor’s.
total debt and total debt as a percentage of capital. As for pretax interest coverage, Texaco’s ratio is closer to the worst quartile than the median.
Does Texaco’s overall showing, as of 2000, imply an overrating of the company by Standard & Poor’s? Based solely on the financial ratios, that would be a reasonable inference. Far from being in imminent danger of a rating reduction, however, Texaco was on S&P’s watchlist for possible upgrading as it reported its year-end results.
Several factors explained this seeming paradox. To begin with, S&P attributed great significance to Texaco’s strong competitive position. In addition to its strong brand names, the company boasted an excellent record of replacing its oil production with new discoveries at a comparatively low cost. Financial flexibility was another of the company’s strong suits. Texaco could fund its exploration and production budget from internally generated funds, precluding any need to borrow. The final factor that supported a rating somewhat higher than the company’s financial ratios implied was management’s credibility with S&P’s analysts. Having committed themselves to capping the company’s total debt at 40% of capital, Texaco’s senior managers kept their word. In one instance, that required the funding of a major acquisition with equity, a financing strategy ordinarily not calculated to win the applause of shareholders. As for S&P’s watchlisting of the company for an even higher rating, there was another critical factor not visible in Exhibit 13.7. Chevron, a more highly rated peer, had made an offer to acquire Texaco.
The lesson is that although comparative ratio analysis plays a large role in the bond rating process, Moody’s and Standard & Poor’s also consider factors outside the financial statements. Therefore, analysts working outside the rating agencies must be cautious about concluding that a company is rated incorrectly. If they make such an inference without exploring the possibility of extenuating circumstances, they may recommend buying or selling a bond in expectation of an upgrade or downgrade that has little chance of materializing.
With that proviso, analysts can derive considerable value from comparative ratio analysis. It is helpful to determine that a company not rated by Moody’s or Standard & Poor’s most closely resembles the companies in a particular rating category. In assigning a nonrated company to a rating category based on ratio comparisons, analysts should keep in mind the size criterion, previously discussed, for creation of peer groups.
Comparative ratio analysis is also useful in assessing the credit impact of a major transaction, such as a debt-financed acquisition or a major stock repurchase. The analyst can calculate ratios based on pro forma financial statements (see Chapter 12) and slot the company in a grid of median ratios by rating category (see Exhibit 13.9). In view of changes in the peer group ratios that arise from fluctuations in business conditions, it is important to use data that is as up-to-date as possible for the exercise.
Analysts should also bear in mind that a company can potentially avert a downgrade implied by the pro forma ratios, provided management’s credibility with the rating agencies is high. The key is to present a plausible plan for restoring financial leverage to its pretransaction level within a few years. Note, however, that the company will merely delay the downgrade if it does not begin fairly quickly to make palpable progress toward the long-range target. The rating agencies tend to be skeptical about a company’s ability to implement a three-year plan entirely in the third year.
Ratio Trend Analysis
Comparative ratio analysis is an effective technique for assessing relative credit risk, yet it leaves the analyst exposed to a major source of error. Suppose two companies in the same industry posted an identical fixed-charge coverage of 3.5 times last year. On a ratio comparison, the two appear to be equally risky. Suppose, however, that one company had coverage of 5.0 times five years ago and has steadily declined to 3.5 times. Imagine, as well,
EXHIBIT 13.9 Median Ratios by Bond Rating Category (Industrials, 1997-1999)
|
| AAA | AA | A | BBB | BB | B | CCC |
| EBIT interest coverage (x) | 17.5 | 10.8 | 6.8 | 3.9 | 2.1 | 1.0 | 0.2 |
| EBITDA interest coverage (x) | 21.8 | 14.6 | 9.6 | 6.1 | 3.5 | 2.0 | 1.4 |
| Funds flow/total debt (%) | 105.8 | 55.8 | size=1 color=black face=Cambria>46.1 | 30.5 | 18.4 | 9.4 | 5.8 |
| Free operating cash flow/ total debt (%) | 55.4 | 24.6 | 15.6 | 6.6 | 3.1 | (4.5) | (14.0) |
| Return on capital (%) | 28.2 | 22.9 | 19.9 | 14.0 | 11.7 | 7.2 | 0.5 |
| Operating income/sales (%) | 29.2 | 21.3 | 18.3 | 15.3 | 15.6 | 0cm.5pt 0cm.5pt;height:10.8pt'> 13.6 | |
| Long-term debt/total capital (%) | 15.2 | 26.4 | 32.5 | 41.0 | 59.0 | 70.7 | 80.3 |
| Total debt/capital (%) | 26.9 | 35.6 | 40.1 | 47.4 | 63.9 | 74.6 | 89.4 |
that the other company’s coverage has improved over the same period from 2.0 times to 3.5 times. If the two companies’ trends appear likely to continue, based on analysis, then the happenstance that both covered their interest by 3.5 times last year should have little bearing on the credit assessment. The company that will have stronger coverage in the future is the better risk.
A further complication is that improving or deteriorating financial ratios can have different implications for different companies. In some cases, a declining trend over several years signals that a company has genuinely fallen to a new, lower level of credit quality. For other companies, negative year-over-year comparisons merely represent the downlegs of their normal operating cycles.
Certain industries enjoy fairly stable demand, year in and year out. Small-ticket nondurables such as food, beverages, and beauty aids are not items that consumers cease to buy during recessions. At worst, people trade down to cheaper products within the same categories. In contrast, consumers tend to postpone purchases of big-ticket durable goods when credit is tight or when they have misgivings about economic conditions. Producers of automobiles, houses, and major appliances are among the businesses that experience wide swings in demand between peaks and troughs in the economy. Profits typically fluctuate even more dramatically in these industries, due to the high fixed costs entailed in capital-intensive production methods.
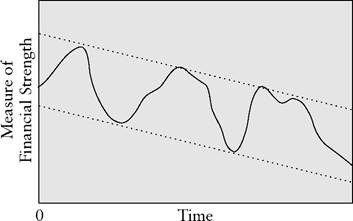
In evaluating the long-range creditworthiness of cyclical companies, the bond rating agencies historically focused on cycle-to-cycle, rather than year-to-year trends. Their notion was that a cycle-to-cycle pattern of similar highs and similar lows (Exhibit 13.10) did not imply a true impairment of financial strength. Deterioration was indicated only when a company displayed a trend of successively lower highs and lower lows (Exhibit 13.11).
Moody’s and Standard & Poor’s label this traditional approach “rating through the cycle.” Although it still influences the agencies’ analysis, they have deemphasized the concept somewhat in recent years. The evolution reflects, in part, a perception that although business activity still fluctuates from year to year, the United States economy no longer undergoes the classic business cycles of former decades. By implication, an extended upturn or downtrend in a company’s ratios is more likely than in bygone times to represent a longer-lived shift.
Even in years past, when the agencies adhered more closely to the doctrine of rating through the cycle, it was often difficult to distinguish a normal, cyclical decline from more permanent deterioration, without the benefit of hindsight. There was always a danger that a company’s management was portraying a permanent reduction in profitability as a routine
EXHIBIT 13.10 Cycle-to-Cycle Stability (Similar highs and lows)
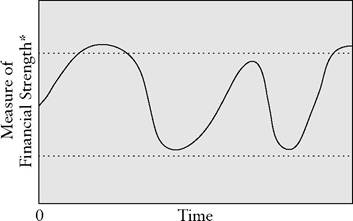
*Examples: Operating margin, fixed charge coverage, ratio of cash flow to total debt.
cyclical slump. Then, as now, an analyst had to look beyond the financial statements to make an informed judgment about the likely persistence of an improvement or deterioration in financial measures.
Default Risk Models
As noted, comparative ratio analysis and ratio trend analysis are techniques for placing companies on a relative scale of credit quality. Many analysts have no need to look more deeply into the matter, but it is impossible to
EXHIBIT 13.11 Cycle-to-Cycle Deterioration (Successively lower highs and lower lows)
cover the topic of credit analysis satisfactorily without discussing two more fundamental issues. First, there is the question of how to set up a ranking scheme such as bond ratings in the first place. Second, there is the problem of conflicting indicators. How, for example, should an analyst evaluate a company that ranks well on fixed-charge coverage but poorly on financial leverage? A rigorous approach demands something more scientific than an individual analyst’s subjective opinion that coverage should be weighted twice as heavily as leverage, or vice versa.
The solution to both of these problems lies in establishing a statistical relationship between financial ratios and default. This requires, first of all, collecting data on the default experience in a given population. Next, statistical methods are employed to determine which financial ratios have historically predicted defaults most reliably. Using a model derived from the best predictors, the analyst can then rank companies on the basis of how closely their financial profiles resemble the profiles of companies that defaulted.
One example of the various models that have been devised to predict defaults is Edward I. Altman’s Z-Score model, which takes the following form:
![]()
where: x1 = Working capital/Total assets (%, e.g.,.20, or 20%) x2 = Retained earnings/Total assets (%)
x3 = Earnings before interest and taxes/Total assets (%) x4 = Market value of equity/Total liabilities (%)
xsize=1 face=Cambria>5 = Sales/Total assets (number of times, e.g., 2.0 times)
In this model, scores below 1.81 signify serious credit problems, whereas a score above 3.0 indicates a healthy firm.
A refinement of the Z-Score model, the Zeta model developed by Altman and his colleagues,7 achieved greater predictive accuracy by using the following variables:
x1 = Earnings before interest and taxes (EBIT)/Total assets
x2 = Standard error of estimate of EBIT/Total assets (normalized) for 10 years
x3 = EBIT/interest charges
x4 = Retained earnings/Total assets
x5 = Current assets/Current liabilities
x6 = Five-year average market value of equity/Total capitalization
x7 = Total tangible assets, normalized
Quantitative models such as Zeta, as well as others that have been devised using various mathematical techniques, have several distinct benefits. First, they are developed by objectively correlating financial variables with defaults. They consequently avoid guesswork in assigning relative weights to the variables. Second, the record of quantitative models is excellent from the standpoint of classifying as troubled credits most companies that subsequently defaulted. In addition, the scores assigned to nondefaulted companies by these models correlate fairly well with bond ratings. This suggests that although Moody’s and Standard & Poor’s originally developed their rating methods along more subjective lines, their conclusions are at least partially vindicated by statistical measures of default risk. Therefore, the credit analyst can feel comfortable about using methods such as ratio trend analysis to slot companies within the ratings framework. Although one can quarrel with the rating agencies’ assessments of particular companies or particular industries, there is strong statistical support for the notion that in the aggregate, ratings provide a valid, if rough, assessment of default risk. The lower a company’s present rating, the higher is its probability of defaulting over the next year, next 2 years, and so on up to 20 years.8
Useful as they are, though, quantitative default models cannot entirely replace human judgment in credit analysis.
For one thing, quantitative models tend to classify as troubled credits not only most of the companies that eventually default, but also many that do not default.9 Often, firms that fall into financial peril bring in new management and are revitalized without ever failing in their debt service. If faced with a huge capital loss on the bonds of a financially distressed company, an institutional investor might wish to assess the probability of a turn- around—an inherently difficult-to-quantify prospect—instead of selling purely on the basis of a default model.
The credit analyst must also bear in mind that companies can default for reasons that a model based solely on reported financial data cannot pick up. For example, U.S. Brass entered Chapter 11 proceedings in 1994 in an effort to resolve litigation involving defective plastic-plumbing systems that it had manufactured. Dow Corning’s 1995 bankruptcy filing offered a possible means of resolving massive litigation arising from silicone gel breast implants sold by the company, which were alleged to cause autoimmune disease and other maladies. In 1999, Gulf States Steel, Inc. of Alabama filed for bankruptcy to address, among other matters, pending litigation with the Environmental Protection Agency and other potential environmentally related claims.10 Typically, in such cases, neither the company’s balance sheet nor its income statement signals an impending collapse. U.S. Brass’s parent company, Eljer Industries, specifically indicated
that the bankruptcy filing did not result from a cash flow shortfall. The problems were apparent in the company’s Notes to Financial Statements, but default models based entirely on financial statement data do not deal with contingent liabilities.
In the case of the Zeta model, the default hazard posed by a company’s environmental or product liability litigation may be picked up, at least in part, by the ratio of market value of equity to total capitalization. Stock market investors consider such risks in determining share prices.
Some default risk models dispense with statement data altogether in favor of complete reliance on the equity market’s wisdom. The best-known are marketed by KMV and Helix Investment Partners, L.P. Underlying these models is the observation that a company’s debt and equity both derive their value from the same assets. Equity holders have only a residual claim after bondholders have been paid. Therefore, if the market value of a company’s assets falls below the value of its liabilities, the stock becomes worthless. At the same time, the company becomes bankrupt; its liabilities exceed its assets. Extending the logic, a declining stock price indicates that the company is getting closer to bankruptcy. In theory, then, credit analysts can skip the financial statement work and monitor companies’ default risk simply by watching their stock prices.
Like the quantitative models consisting of financial ratios, the default risk models based on stock prices provide useful, but not infallible, signals. For example, when a company dramatically increases its total-debt-to- total-capital ratio by borrowing money to repurchase stock, its default risk clearly rises. At the same time, its stock price may also rise, reflecting the positive impact on earnings per share of increased financial leverage and a reduction in the number of shares outstanding. According to the theory underlying the stock-based default risk models, however, a rising share price indicates declining default risk. This is one of several caveats typically accompanying credit opinions derived from stock-based models.
Even if share prices were perfect indicators of credit risk, credit analysts would not escape the rigors of tearing apart financial statements. To begin with, not every company’s shares trade in the public market. The producers of stock-based models attempt to get around this problem by using share prices of industry peers to create surrogates for private companies’ unobservable equity values. This method, however, cannot capture the sort of company-specific risks that led to the bankruptcies of U.S. Brass, Dow Corning, and Gulf States Steel Inc. of Alabama. Neither can stock-based default risk models relieve the analyst of such tasks as creating pro forma financial statements to gauge the impact of a potential merger or major asset sale. At most, incorporating stock prices into credit analysis is a useful complement to plumbing the financial statements for meaning with time-tested ratio calculations.
CONCLUSION
Default risk models can provide a solid foundation for credit analysis but must be complemented by the analyst’s judgment on matters too complex to be modeled. Much the same applies to all of the quantitative techniques discussed in this chapter. A lender should not provide credit before first “running the numbers.” By the same token, it is a mistake to rely solely on the numbers in order to sidestep a difficult decision. This can take the form either of rejecting a reasonable risk by inflexibly applying quantitative criteria, or of approving a credit against one’s better judgment while counting on financial ratios that are technically satisfactory as a defense against criticism if the loan goes bad.
As other chapters in this book demonstrate, financial statements are vulnerable to manipulation, much of which is perfectly legal. Often, the specific aim of the manipulators is to outfox credit analysts who mechanically calculate ratios without pausing to consider whether accounting ruses have defeated the purpose. Another danger in relying too heavily on quantitative analysis is that a company may unexp ectedly and radically alter its capital structure to finance an acquisition or to defend itself against a hostile takeover. Such action can render ratio analysis on even the most recent financial statements largely irrelevant. In the end, credit analysts must equip themselves with all the tools described in this chapter, yet not be made complacent by them.