COMBINATION RATIOS
Each of the financial ratios discussed so far in this chapter is derived from numbers collected from just one of the three basic financial statements.
In financial analysis, these rudimentary tools are analogous to the simple ma- chines—the wedge, the lever, the wheel, and the screw—that greatly increased the productivity of their prehistoric inventors. How much more remarkable an advance it was, however, when an anonymous Chinese combined two simple machines, a lever and a wheel, to create a wheelbarrow! In similar fashion, combining numbers from different financial statements unleashes vast new analytical power.Rate-of-Return Measures
One of the most valuable types of combination ratios combines earnings with balance sheet figures. Such ratios measure the profit that an enterprise is generating relative to the assets employed or the capital invested in it. This kind of measure provides a link between credit analysis and the economic concept of productivity of capital.
To illustrate, consider Companies A, B, and C, all of which are debt- free. If we look only at net margin, a ratio derived solely from the income statement, Company A is superior to both its direct competitor, Company B, and Company C, which is in a different business. Looking at the combination ratio of return on equity, however, we find that Company C ranks highest, notwithstanding that sales margins tend to be narrower in its industry:
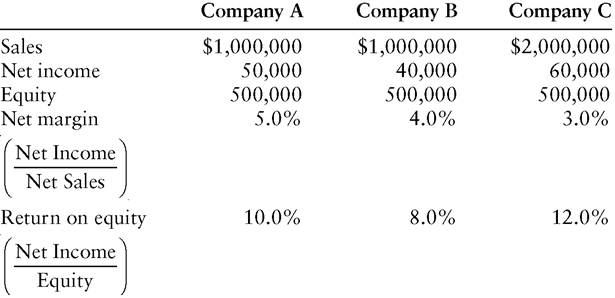
To an economist, this result suggests that investors earning 8% to 10% in Company A and Company B’s industry will seek to shift their capital to Company C’s industry, where 12% returns are available.
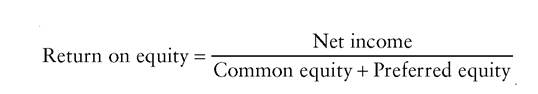
The credit implication of this migration of capital is that Companies A and B will have greater difficulty raising funds and therefore less financial flexibility. The credit impact on Company C, conversely, is favorable.There are several variants of the rate-of-return combination ratio, each with a specific analytical application. Return on equity, which has already been alluded to, measures a firm’s productivity of equity and therefore provides an indication of its ability to attract a form of capital that provides an important cushion for the debtholders:
In calculating this ratio, analysts most commonly use as the denominator equity as of the final day of the year in which the company earned the income shown in the numerator. This method may sometimes produce distortions. A company might raise a substantial amount of new equity near the end of the year. The denominator in the return-on-equity calculation would consequently be increased, but the numerator would not reflect the benefit of a full year’s earnings on the new equity because it was employed in the business for only a few days. Under these circumstances, return on equity will compare unfavorably (and unfairly) with that of a company that did not abruptly expand its equity base.
The potential for distortion in the return-on-equity calculation can be reduced somewhat by substituting for end-of-year equity so-called average equity:
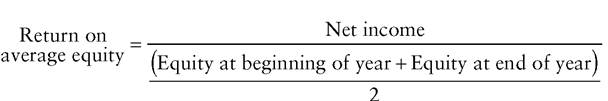
(Some analysts prefer this method to the year-end-based calculation, even when sudden changes in the equity account are not an issue.)
Another limitation of combination ratios that incorporate balancesheet figures is that they have little meaning if calculated for portions of years.
Suppose that in 2001 a company earns $6 million on year-end equity of $80 million, for a return on equity of 7.5%. During the first half of 2002, its net income is $4 million, of which it pays out $2 million in dividends, leaving it $82 million in equity at June 30, 2002. With the company having earned in half a year two-thirds as much as it did during all of 2001, it is illogical to conclude that its return on equity has fallen from 7.5% to 4.9% ($4 million ÷ $82 million).To derive a proper return on equity, it is necessary to annualize the earnings figure. Merely doubling the first half results can introduce some distortion, though, since the company’s earnings may be seasonal. Even if not, there is no assurance that the first-half rate of profitability will be sustained in the second half. Accordingly, the best way to annualize earnings is to calculate a trailing 12-months’ figure:
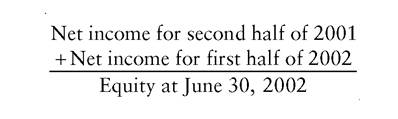
If the analyst is working with the company’s 2001 annual report and 2002 second-quarter statement, 2001 second-half earnings will not be available without some backing out of numbers. For ease of calculation, the numerator in the preceding ratio can be derived as follows:
Net income for full year 2001
Less: Net income for first half of 2001
Plus: Net income for first half of 2002
For the credit analyst, return on equity alone may be an insufficient, or even a misleading, measure. The reason is that a company can raise its return on equity by increasing the proportion of debt in its capital structure, a change that reduces credit quality.
In Exhibit 13.4, Company Y produces a higher return on equity than the more conservatively capitalized Company X, even though both have equivalent operating margins.Note that Company Y enjoys its edge despite having to pay a higher interest rate on account of its riskier financial structure.
Income statement ratios such as net margin and fixed-charge coverage, which point to higher credit quality at Company X, serve as a check against return on equity, which ranks Company Y higher. A later section of this chapter explores systematic approaches to reconciling financial ratios that give contradictory indications about the relative credit quality of two or more
EXHIBIT 13.4 Effect of Debt on Return on Equity ($000 omitted)
Company X Company Y
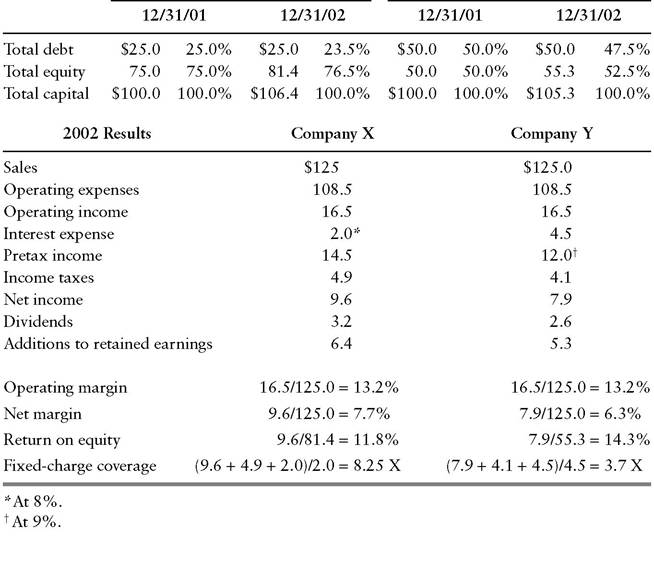
companies. The more immediately relevant point, however, is that other combination ratios can also be used as checks against an artificially heightened return on equity. Using the same figures for Companies X and Y, the analyst can calculate return on total capital, which equalizes for differences in capital structure. On this basis, Company Y enjoys only a negligible advantage related to its slower growth in retained earnings (and hence in capital):
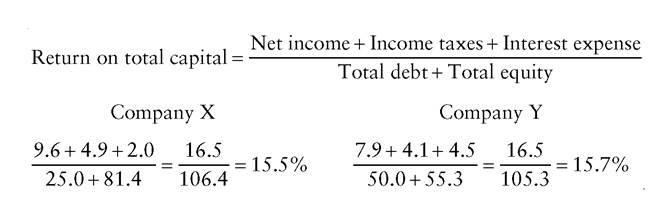
Total debt in this calculation includes short-term debt, current maturities of long-term debt, and long-term debt, for reasons described earlier under “What Constitutes Total Debt?” Similarly, total equity includes both preferred and preference stock.
If there is a minority interest, the associated income statement item should appear in the numerator, and the balance sheet amount in the denominator.Turnover Measures
In addition to measuring return on investment, a particular type of combination ratio known as a turnover ratio can provide valuable information about asset quality. The underlying notion of a turnover ratio is that a company requires a certain level of receivables and inventory to support a given volume of sales. For example, if a manufacturer sells its goods on terms that require payment within 30 days, and all customers pay exactly on time, accounts receivable on any given day (barring seasonality in sales) will be 30 ÷ 365 or 8.2% of annual sales. Coming at the question from the opposite direction, the analyst can calculate the average length of time that a receivable remains outstanding before it is paid (the calculation uses the average amount of receivables outstanding during the year): 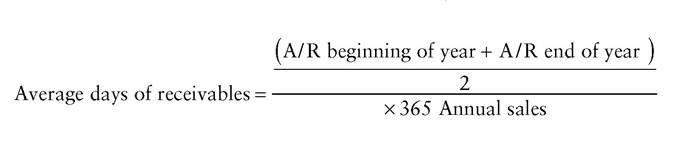
This ratio enables the analyst to learn the company’s true average collection period, which may differ significantly from its stated collection period.
By inverting the first portion of the average days of receivables calculation, one can determine how many times per year the company turns over its receivables:
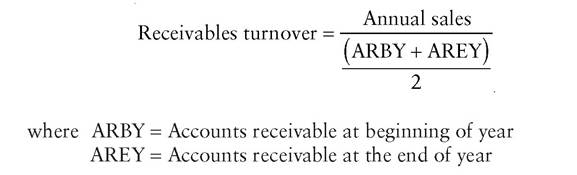
As long as a company continues to sell on the same terms, its required receivables level will rise as its sales rise, but the ratio between the two should not change.
A decline in the ratio may signal that the company’s customers are paying more slowly because they are encountering financial difficulties. Alternatively, the company may be trying to increase its sales by liberalizing its credit standards, allowing its salespeople to do more business with less financially capable customers. Either way, the ultimate collectibility of the accounts receivable shown on the balance sheet has become less certain. Unless the company has reflected this fact by increasing its allowance for doubtful receivables, it may have to write off a portion of receivables against income at some point in the future. The analyst should therefore adjust the company’s total-debt-to-total-capital ratio for the implicit overstatement of equity.Another asset quality problem that can be detected with a combination ratio involves unsalable inventory. A fashion retailer’s leftover garments from the preceding season or an electronics manufacturer’s obsolete finished goods can be worth far less than their balance sheet values (historical cost). If the company is postponing an inevitable write-off, it may become apparent through a rise in inventory without a commensurate rise in sales, resulting in a decline in inventory turnover:
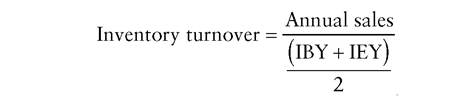
where IBY = Inventory at beginning of year
IEY = Inventory at end of year
A drop in sales is another possible explanation of declining inventory turnover. In this case, the inventory may not have suffered a severe reduction in value, but there are nevertheless unfavorable implications for credit quality. Until the inventory glut can be worked off by cutting back production to match the lower sales volume, the company may have to borrow to finance its unusually high working capital, thereby increasing its financial leverage. Profitability may also suffer as the company cuts its selling prices, accepting a lower margin to eliminate excess inventory.
One objection to the preceding inventory-turnover calculation involves the variability of selling prices. Suppose that the price of a commodity chemical suddenly shoots up as the result of a temporary shortage. A chemical producer’s annual sales—and hence its inventory turnover—may rise, yet the company may not be physically moving its inventory any faster than before. Conversely, a retailer may respond to a drop in consumer demand and cut its prices to avoid a buildup of inventory. The shelves and back room have no more product than previously, yet the ratio based on annual sales indicates that turnover has declined.
To prevent such distortions, the analyst can use the following variant ratio:
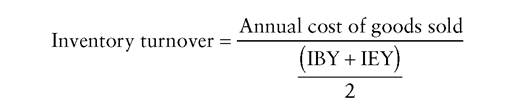
This version should more closely capture the reality of a company’s physical turnover. Cost of goods sold and inventory are both based on historical cost, whereas selling prices fluctuate with market conditions, causing a mismatch between the numerator and denominator of the turnover calculation.
Total-Debt-to-Cash-Flow Ratio
A final combination ratio that is invaluable in credit analysis is the ratio of total debt to cash flow:
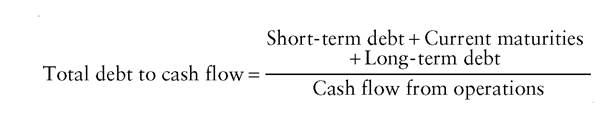
This ratio expresses a company’s financial flexibility in a most interesting way. If, for the sake of illustration, a company has total debt of $60 mil-
lion and cash flow from operations of $20 million, it has the ability to liquidate all its debt in three years by dedicating 100% of its cash flow to that purpose. This company clearly has greater financial flexibility than a company with $80 million of debt and a $10-million annual cash flow, for an eight-year debt-payback period. In the latter case, flexibility would be particularly limited if the company’s debt had an average maturity of significantly less than eight years, implying the possibility of significant refinancing pressure under tight credit conditions.
All very interesting, one might say, but in reality how many companies dedicate 100% of their cash flow to debt retirement? The answer is “very few,” but total debt to cash flow is still a good ratio to monitor for credit quality. It enjoys distinct advantages over some of the more frequently invoked credit-quality measures, which are derived from the balance sheet or income statement alone. The total-debt-to-total-capital ratio has the inherent flaw that equity may be understated or overstated relative to its economic value. After all, the accounting rules do not permit a writeup of assets unless they are sold, nor do the rules require a writedown until someone makes the often subjective determination that the assets have fallen in value. In comparison, total debt is an objective number, a dollar amount that must contractually be repaid. Fixed-charge coverage, too, has a weakness, for it is based on earnings, which are subject to considerable manipulation. Cash flow eliminates one major opportunity for manipulation: underdepreciation. If a company inflates its reported earnings by writing down its fixed assets more slowly than economic reality dictates, it is merely taking money out of one cash flow pocket and putting it into the other. Cash flow, then, puts companies on equal footing, whatever their depreciation policies.
Built from two comparatively hard numbers, the ratio of total debt to cash flow provides one of the best single measures of credit quality. Analysts should not worry about whether its literal interpretation—the period required for a total liquidation of debt—is realistic, but instead focus on its analytical value.
More on the topic COMBINATION RATIOS:
- Heavy Tail Distributions with Heavier Randomness
- Positivity and Conflict
- DID THOMSON DISCOVER THE ELECTRON?
- The Government Budget: Some Facts and Figures
- Principles of the Rule of Law, the Factor of Honour, and Pragmatism According to Data from Field Research
- Precision medicine-approaches to targeted therapy
- Heterotroph diets can be determined from the isotopic composition of food sources
- Content of the law. Law-scale behavior of the individual.
- D Popper and Probability
- Management of Twin Anaemia- Polycythaemia Sequence