The Government Budget: Some Facts and Figures
Use the measures of government outlays and taxes to measure government surpluses and deficits.
Before getting into the analytical issues of fiscal policy, we set the stage by looking at the components of the government budget and their recent trends.
We discuss three main aspects of the budget: (1) spending, or outlays; (2) tax revenues, or receipts; and (3) the budget surplus or deficit. Our discussion reviews and builds on Chapter 2, in which we introduced basic budget concepts.Government Outlays
Government outlays, the total spending by the government during a period of time, are classified into three primary categories: government purchases, transfer payments, and net interest payments.
FIGUREJ5.1
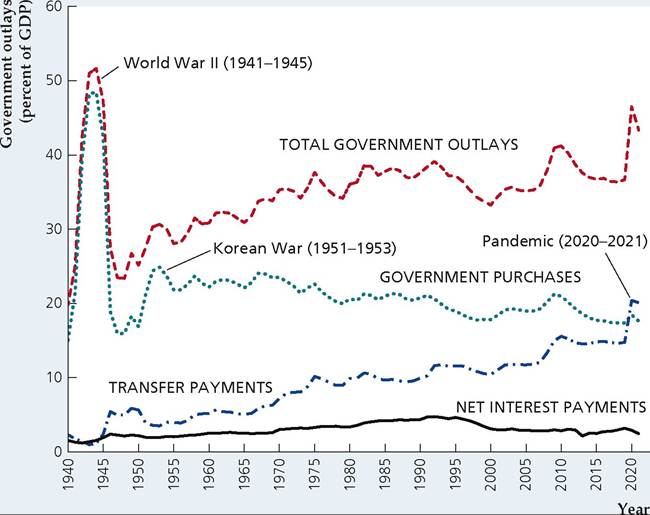
Government outlays: Federal, state, and local, 1940-2021
The figure shows the behavior since 1940 of the three major components of government outlays, as well as total government outlays, for all levels of government combined and measured as a percentage of GDP. Government purchases rose most sharply during World War II (1941-1945) and the Korean War (1951-1953). Transfer payments have risen steadily as a share of GDP and then jumped sharply in the pandemic of 2020-2021. Interest payments rose most sharply during World War II and in the 1980s.
Sources: National Income and Product Accounts, Bureau of Economic Analysis, www.bea.gov. GDP: Table 1.1.5; components of government outlays: Table 3.1. For detailed updates and projections of the Federal budget by the Congressional Budget Office, see www.cbo.gov.
1. Government purchases (G) are government expenditures on currently produced goods and services, including capital goods. Government spending on capital goods, or government investment, accounts for about one-sixth of government purchases of goods and services. The remaining five-sixths of government purchases are government consumption expenditures.
2. Transfer payments (TR) are payments made to individuals for which the government does not receive current goods or services in exchange. Examples of transfers are Social Security benefit payments, military and civil service pensions, unemployment insurance, welfare payments (Temporary Assistance for Needy Families), and Medicare.1
3. Net interest payments (INT) are the interest paid to the holders of government bonds less the interest received by the government—for example, on outstanding government loans to students or farmers.
In addition there is a minor category called subsidies less surpluses of government enterprises. Subsidies are government payments that are intended to affect the production or prices of various goods. Examples are price support payments to farmers and fare subsidies for mass transit systems. The surpluses of government enterprises represent the profits of government-run enterprises such as the Tennessee Valley Authority (an electricity producer). This category of outlays is relatively small, so for simplicity we will ignore it.
In the United States, total government outlays (Federal, state, and local) were about 37% of GDP over the past five years. Figure 15.1 shows the trends since 1940 in the three main categories of government outlays, as well as total government outlays, expressed as a percentage of GDP. The most obvious feature of Fig. 15.1 is the enormous increase in government purchases during World War II: In 1943 and 1944, when the war effort was at its peak, government purchases exceeded 45% of GDP. The impact of the Korean War (1951-1953) also is evident, though less dramatic. The share of GDP devoted to government purchases drifted gradually downward from about 23% of GDP in the late 1960s to around 17% of GDP in the late 1990s and then rose during the financial crisis of 2008 and its aftermath before declining again to about 17% in recent years.
1Although government outlays for Medicare and Medicaid are used to pay for current medical services, they are treated as transfer payments to individuals who then purchase these services.
Figure 15.1 also shows that transfer payments rose steadily as a share of GDP from the early 1950s until the early 1980s, doubling their share of GDP during that thirty-year period. Transfers averaged about 12% of GDP in the 2000s before the financial crisis in 2008 and averaged about 15% from 2008 until the pandemic in 2020-2021, when they rose sharply. The long-term increase in transfer payments is the result of the creation of new social programs (such as Medicare and Medicaid in 1965), the expansion of benefits under existing programs (such as Social Security, which is discussed later in the chapter in the Application "Social Security in the United Kingdom: How Can It Be Fixed?"), and the increased number of people covered by the various programs.
Finally, Fig. 15.1 shows how net interest payments—interest payments, for short—have evolved. Because interest payments are much smaller than the other two categories of government outlays, they appear to fluctuate less. However, interest payments rose sharply as a percentage of GDP in two periods. First, interest payments doubled from 1.2% of GDP in 1941 to 2.4% of GDP in 1946, reflecting the large amount of government borrowing done to finance the war effort during World War II. Second, interest payments as a share of GDP increased significantly during the 1980s, rising from 3.2% in 1979 to 4.2% in 1989. This increase reflected both increased borrowing by the government and the generally high level of interest rates during the 1980s. Net interest payments as a share of GDP declined in the 1990s because interest rates fell and the government budget moved into surplus and fell further in the 2000s as interest rates declined even more.
How does the rate of government expenditure in the United States compare with rates in other countries with similar living standards? Because official accounting rules for measuring the government budget vary widely among countries, the answer isn't as straightforward as you might think.
Nevertheless, Table 15.1 compares the ratios of government spending to GDP for 18 countries in the Organization for Economic Cooperation and Development (OECD). The United States has the fourth lowest rate of total government spending as a percentage of GDP; the lowest is Ireland at just 25.0%. The low rate of government spending in the United States relative to most of the other countries largely reflects the more extensive government-financed social welfare programs (such as national health insurance) in those countries.Taxes
On the revenue side of the government's budget are tax receipts. There are four principal categories of tax receipts: personal taxes, contributions for social insurance, taxes on production and imports, and corporate taxes. Figure 15.2 shows the history of revenues from these four major categories of taxes in the United States, all expressed as a percentage of GDP. The share of taxes in GDP grew dramatically from 15.7% of GDP in 1940 to 28.3% of GDP in 2000, declined to 23.5% in 2011, and was 25% to 27% from 2013 to 2021.
TABLE 15.1
Government Spending in 18 OECD Countries, Percentage of GDP, 2021
| Country | |
| United States | 45.1 |
| Japan | 43.0 |
| Germany | 51.6 |
| France | 59.1 |
| Italy | 55.6 |
| United Kingdom | 47.3 |
| Canada | 46.0 |
| Australia | 40.2 |
| Austria | 56.0 |
| Belgium | 54.9 |
| Denmark | 51.0 |
| Finland | 54.9 |
| Greece | 56.9 |
| Iceland | 49.3 |
| Ireland | 25.0 |
| Netherlands | 46.4 |
| Spain | 50.6 |
| Sweden | 49.6 |
| Source: OECD Economic Outlook, Annex Table 29, | |
| www.oecd.org/economy/outlook/EO1111_ balnncce-and-Public-lndebtaecss.slsx. | _Fiscnl- |
The largest category of tax receipts is personal taxes, which are primarily personal income taxes and property taxes.
Income taxes were first introduced at the Federal level in the United States (at very low rates and for only the richest people) during the Civil War. However, this tax faced a series of legal challenges, and eventually the Supreme Court declared the income tax unconstitutional. In 1913, the Sixteenth Amendment to the Constitution gave Congress the right to impose an income tax. Used lightly at first, this tax is now a major source of revenue for government.Personal taxes took their biggest jump during World War II, rising from 1.7% of GDP in 1940 to 8.5% of GDP in 1945. The general upward drift in personal tax receipts from 1945 to 2000 was interrupted by several tax cut bills, notably the Kennedy-Johnson tax cut of 1964 and the Reagan tax cut of 1981. Personal taxes rose as a result of the deficit-reduction efforts of President Bill Clinton and then declined with President George W. Bush's tax cuts in the 2000s.
Figure 15.2 shows that a large share of the increase in tax receipts since World War II reflects the increase in a second category of taxes, Contributionsfor social insurance (primarily Social Security taxes). Social insurance contributions usually are levied as a fixed percentage of a worker's salary, up to a ceiling; income above that ceiling isn't taxed.[280] In most cases the worker's contributions are matched by the employer so that the deduction appearing on the worker's paycheck reflects only half the total tax levied. Increases in social insurance contributions are the result of increases both in the contribution rate and higher ceilings on the amount of income subject to the tax.
A third category of tax receipts is taxes on production and imports, mainly sales taxes. These taxes declined as a share of GDP during World War II and haven't shown any significant long-term increase or decrease since.
FIGUREJ5.2
Taxes: Federal, state, and local, 1940-2021 Shown is the history of revenues collected from various types of taxes, for all levels of government combined and measured as a percentage of GDP.
Total taxes drifted upward from 1940 to 2000 but have declined since then. Most of the earlier increase in taxes was accounted for by increases in contributions for social insurance and in personal taxes.Sources: National Income and Product Accounts, Bureau of Economic Analysis, www.bea.gov/itable/national-gdp-and- personal-income. GDP: Table 1.1.5; components of government receipts: Table 3.1.
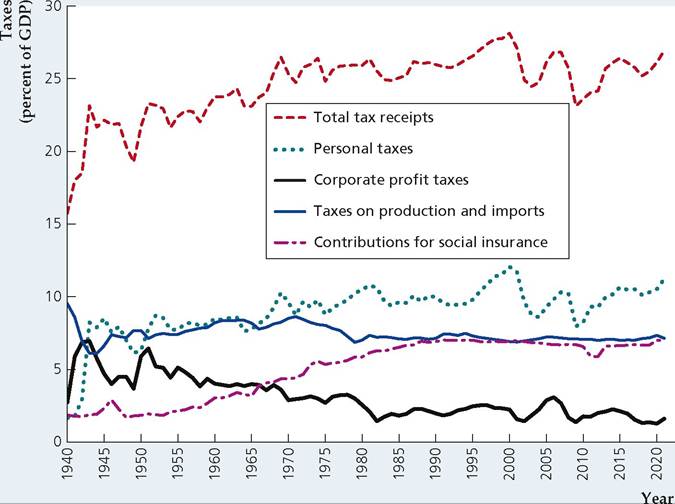
A final category of tax receipts is corporate taxes, particularly corporate profit taxes. Figure 15.2 shows that corporate taxes rose sharply during World War II and the Korean War and then drifted gradually downward as a share of GDP from the mid-1950s until the mid-1980s. Corporate tax receipts have accounted for 1% to 2% of GDP in recent years.
The Composition of Outlays and Taxes: The Federal Government Versus State and Local Governments. The components of government spending shown in Fig. 15.1 and the components of taxes shown in Fig. 15.2 lump together Federal, state, and local governments. For most purposes of macroeconomic analysis, combining Federal, state, and local fiscal policy is the most sensible choice. The macroeconomic effect of a new highway-building program, for example, shouldn't depend on whether the new highways are financed from the Federal, state, or local budgets—or from a combination of those budgets. In this respect the tendency of many news stories about fiscal policy to focus exclusively on the Federal government's budget can be misleading.
Nevertheless, it is useful to know that in the United States, Federal government budgets have a much different composition, on both the expenditure and the revenue sides, than those of state and local governments. A summary of the major components of both the Federal and the combined state and local government budgets for 2021 is given in Table 15.2. Note in particular the following points:
1. Government consumption expenditures. Over 60% of state and local current expenditures (expenditures excluding investment) is for consumption expenditures. In contrast, less than 20% of Federal current expenditures is for consumption
TABLE 15.2
Government Receipts and Current Expenditures, 2021
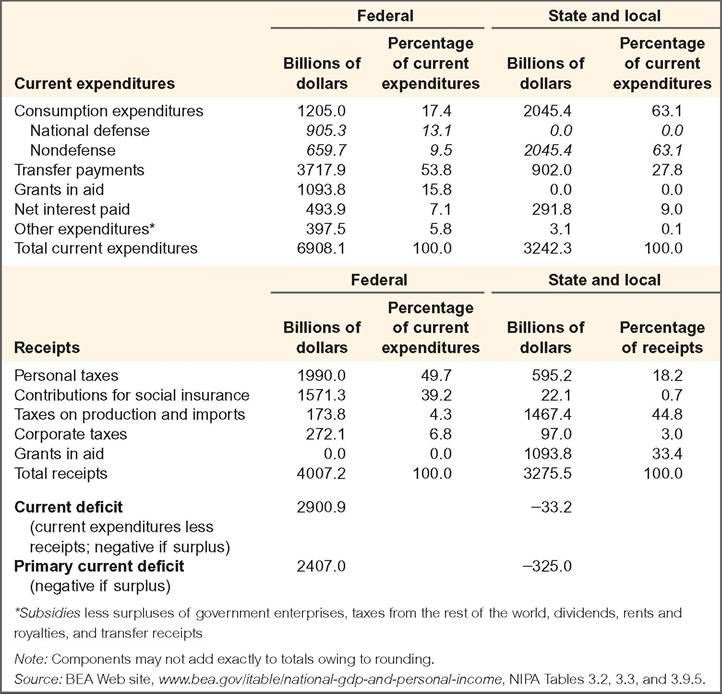
expenditures, and about three-fourths of this amount is for national defense. About 75% ofgovernment consumption expenditures on nondefense goods and services in the United States comes from state and local governments.
2. Transfer payments. The Federal budget is more heavily weighted toward transfer payments (particularly, benefits from Social Security and related programs) than state and local budgets are.
3. Grants in aid. Grants in aid are payments made by the Federal government to state and local governments to help support various education, transportation, and welfare programs. Grants in aid appear as a current expenditure for the Federal government and as a receipt for state and local governments. In 2021, these grants made up about one-third of state and local government receipts.
4. Net interest paid. Because of the large quantity of Federal government bonds outstanding, net interest payments are an important component of Federal spending. In contrast, net interest payments for state and local governments are smaller and sometimes negative, which occurs when state and local governments (which hold substantial amounts of Federal government bonds) receive more interest than they pay out.
5. Composition of taxes. More than 80% of Federal government receipts come from personal taxes (primarily the Federal income tax) and contributions for social insurance. Less than 10% of Federal revenues are from corporate taxes, and less than 5% are from taxes on production and imports such as sales taxes. In contrast, taxes on production and imports account for about half of state and local revenues. About one-fifth of state and local revenues come from personal taxes (both income taxes and property taxes) and contributions for social insurance. As already mentioned, state and local governments also count as revenue the grants in aid they receive from the Federal government.
Deficits and Surpluses
Government outlays need not equal tax revenues in each period. In Chapter 2 we showed that, when government outlays exceed revenues, there is a government budget deficit (or simply a deficit); when revenues exceed outlays, there is a government budget surplus. For ease of reference, we write the definition of the deficit as
deficit = outlays — tax revenues (15.1)
= (government purchases + transfers + net interest) — tax revenues = (G + TR + INT) — T.
A second deficit concept, called the primary government budget deficit, excludes net interest from government outlays:
primary deficit = outlays — net interest — tax revenues (15.2)
= (government purchases + transfers) — tax revenues = (G + TR) — T.
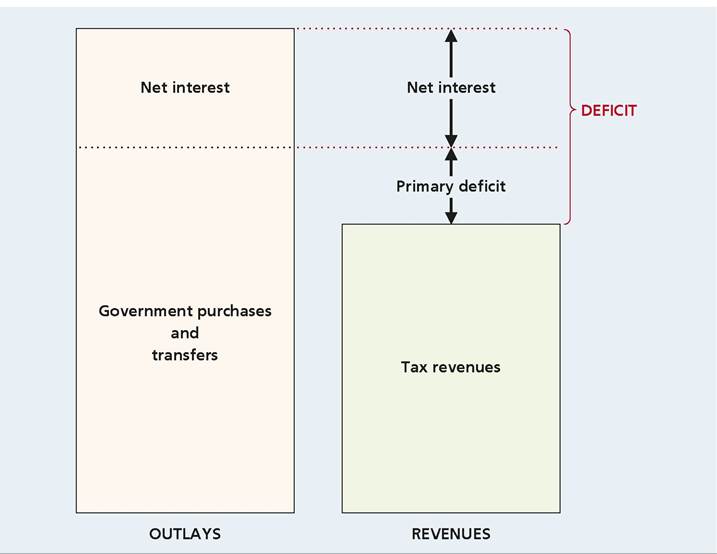
The primary deficit is the amount by which government purchases and transfers exceed tax revenues; the primary deficit plus net interest payments equals the deficit. Figure 15.3 illustrates the relationship between the two concepts.
Why have two deficit concepts? The reason is that each answers a different question. The standard or total budget deficit answers the question: How much does the government currently have to borrow to pay for its total outlays? When measured in nominal terms, the deficit during any year is the number of additional dollars that the government must borrow during that year.
The primary deficit answers the question: Can the government afford its current programs? If the primary deficit is zero, the government is collecting just enough tax revenue to pay for its current purchases of goods and services and its current social programs (as reflected by transfer payments). If the primary deficit is greater than zero, current government purchases and social programs cost more than current tax revenue can pay for. Net interest payments are ignored in the primary deficit because they represent not current program costs but costs of past expenditures financed by government borrowing.
FIGUREJ5.3
The relationship between the total budget deficit and the primary deficit
The standard measure of the total government budget deficit is the amount by which government outlays exceed tax revenues. The primary deficit is the amount by which government purchases plus transfers exceed tax revenues. The total budget deficit equals the primary deficit plus net interest payments.
The separation of government purchases into government investment and government consumption expenditures introduces another set of deficit concepts: the current deficit and the primary current deficit. The current deficit is equivalent to the deficit in Eq. (15.1), with outlays replaced by current expenditures, which are all government outlays except government investment. The primary current deficit is the current deficit minus interest payments. Table 15.2 shows the current deficit and the primary current deficit for 2021.
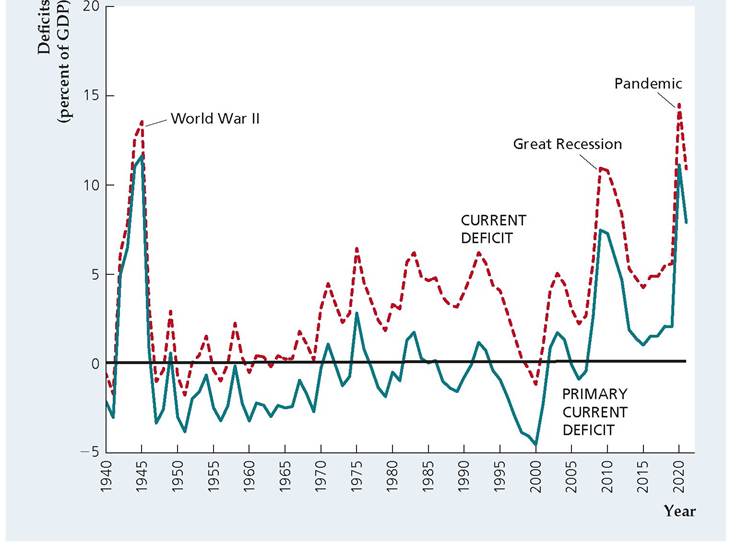
Figure 15.4 shows the current deficit and primary current deficit for all levels of government combined as a percentage of GDP since 1940. Again, the World War II period stands out; the government financed only part of the war effort with taxes and thus ran large primary and overall deficits.[281] Large deficits (using both concepts) also occurred in the mid-1970s and again in the early 1980s. Although the primary deficit actually became a primary surplus for several years in the 1980s and 1990s, large interest payments kept the overall deficit large until the late 1990s, when the overall budget went into surplus. Tax cuts in the early 2000s eliminated the large primary current surplus of the late 1990s. The Federal government increased spending during the Great Recession from 2007 to 2009, leading to large current deficits and primary current deficits for several years. From 2013 to 2017, the current deficit was 4% to 5% of GDP, while the primary current deficit was 1% to 2% of GDP. The tax cut of 2017, led to an increase in both deficits substantially as a share of GDP in 2018 and 2019.
FIGUREJ5.4
Current deficit and primary current deficit: Federal, state, and local, 1940-2021 Shown are the current government budget deficit and the primary current deficit, both measured as a percentage of GDP, since 1940. The government ran large primary current deficits during World War II, after the financial crisis in 2008 and during the pandemic in 2020. The widening gap between the current deficit and the current primary deficit between 1975 and 1991 reflects increasing interest payments on the government's accumulated debt.
Sources: National Income and Product Accounts, Bureau of Economic Analysis, www.bea.gou/ itable/national-gdp-and-personal- income. GDP: Table 1.1.5; current deficit: Table 3.1; primary current deficit: authors' calculations from data on deficit and net interest paid in Table 3.1.
15.2
More on the topic The Government Budget: Some Facts and Figures:
- WAGE DISPERSION: MEASUREMENT AND STYLIZED FACTS
- Taxation
- THEORETICAL CONSIDERATIONS
- Entrepreneurship and small/medium-sized enterprises (SMEs)
- Kuwait
- Chapter 33 Agricultural Investment Risk Relationship to National Domestic Production
- Specific contributions: von Stein’s influence on the science of administration, the doctrine of a rational tax system and the mapping out of rules for public debt
- Fligstein Neil. The Banks Did It: An Anatomy of the Financial Crisis. Harvard University Press,2021. — 334 p., 2021
- Some empirical caveats
- Article 5.4 Microsoft beats Apple in the credit ratings league