Taxation
This chapter looks at the existing pattern of UK taxation and the changes that have taken place in recent years. We examine the degree of progressiveness of the UK tax system and the effects of the recent switches between direct and indirect taxation.
The changing burden of taxation in the UK is charted, and international comparisons are presented. We then consider the effect of higher taxes on incentives to work, save and take risks, and on the rise of the ‘black economy'. After a more general treatment of the direct versus indirect tax debate, we conclude with a brief look at recent reforms of local taxation and social security benefits.As we consider further in Chapter 30, taxation and public expenditure (Chapter 18) are key fiscal policy instruments for many of the advanced industrialized economies seeking more sustainable budgetary and National Debt outcomes after the major interventions required post ‘credit crunch'! We consider the monetary policy aspects of those interventions in Chapters 20 and 21 but ‘quantitative easing' and other such policies have brought taxation, together with public expenditure, into still sharper focus.
The taxes that are collected: some taxation concepts
Taxes may be classified in a number of different ways:
■ the method of collection;
■ the tax base;
■ the tax rate.
The method of collection
Taxes may be grouped by the administrative arrangement for their collection.
Direct or indirect
Income tax is paid directly to the Exchequer by the individual taxpayer (mainly through Pay As You Earn - PAYE), on the full amount of income from employment and investment in the fiscal year. The same is true of corporation tax, paid by firms on company profits. On the other hand, value added tax (VAT), though paid by consumers, reaches the Exchequer indirectly, largely through retailers acting as collecting agencies.
Taxes may therefore be classified as either direct or indirect, according to the administrative arrangement for their collection. From Table 19.1 we see that direct taxes - in the form of income tax, capital taxes, corporation tax and petroleum revenue tax - were expected to produce 36.8% (189.4/514.6) of total government receipts in 2009/10. Income tax is by far the most important direct tax, alone contributing almost 27% of government receipts. Strictly speaking we should add the various National Insurance contributions to the total for direct taxation. These are a compulsory levy on employers, employees and the self-employed, expressed as a fixed percentage of total earnings, and paid directly to the Exchequer (shown under the ‘Social Security receipts’ heading). They total some £95.6bn in 2009/10 and provide around 18.6% of government receipts. They are not, however, included in the Consolidated Fund revenue tables.Indirect taxes - VAT, a range of excise duties on oil, tobacco, alcohol and motor cars, and import duties - were expected to produce 24.1% of total government receipts in 2009/10. Of these VAT (13.6% of total ‘receipts’) was the most important.
Table 19.1 How public spending is paid for: income of general government.
| General government receipts (£bn) | |||
| 1998/99 | 2009/10 | 2009/10 % | |
| Inland Revenue: | |||
| Income tax | 86.4 | 140.0 | |
| Corporation tax1 | 30.0 | 35.8 | |
| Petroleum tax | 0.5 | 0.94 | |
| Windfall tax | 2.6 | 0.04 | ■ 36.8 |
| Capital gains tax | 1.8 | 2.54 | |
| Inheritance tax | 1.8 | 2.44 | |
| Stamp duty | 4.6 | 7.8 44 | |
| Total Inland Revenue | 127.7 | 189.4 | |
| Customs & Excise: | |||
| VAT | 52.3 | 70.1 | |
| Fuel duties | 21.6 | 26.2 44 | |
| Tobacco | 8.2 | 8.84 | |
| Alcohol | 5.9 | 9.04 | ■ 24.1 |
| Air passenger duty | 0.5 | 1.94 | |
| Insurance premium tax | 1.2 | 2.34 | |
| Others2 | 0.5 | 5.9 44 | |
| Total Customs & Excise | 94.0 | 124.2 | |
| Vehicle excise duties | 4.7 | 5.6 | |
| Oil royalties | 0.3 | - | |
| Business rates | 15.3 | 24.3 | ■ 8.8 |
| Others3 | 8.3 | 15.7 44 | |
| Total taxes | 250.3 | 359.2 | bgcolor=white>69.7|
| Social security receipts | 55.1 | 95.6 | |
| Council tax | 12.1 | 25.0 | |
| Interest and dividends | 4.3 | 7.7 | |
| Other receipts3 | 14.1 | 27.1 | |
| Total receipts | 335.9 | 514.6 | 100.0 |
Note: Items may not add up to totals because of rounding.
1Includes company tax credits.
2Includes Landfill Tax and Climate Change Levy, betting and gaming duties and customs duties.
3Net of own resource contributions to EU budget, VAT refunds, TV licenses and business rates payments by local authorities.
Source: Modified from HM Treasury (2010) Budget Report2010, June.
Table 19.2 Public sector borrowing requirement, 1996-2010.
£bn
| 1996/97 | 1999/2000 | 2002/03 | 2004/05 | 2007/08 | 2009/10 | |
| Public sector current expenditure | 299.4 | 326.6 | 395.0 | 455.4 | 548.0 | 600.6 |
| Public sector current receipts | 288.8 | 359.3 | 397.1 | 451.3 | 535.6 | 514.6 |
| Depreciation | 12.5 | 12.6 | 13.8 | 15.0 | 17.8 | 19.7 |
| Surplus on current budget | -23.1 | 20.0 | -11.7 | -19.0 | -30.2 | -105.6 |
| Net investment | 5.3 | 4.4 | 12.2 | 20.7 | 29.3 | 49.0 |
| Public sector net borrowing | 28.4 | -15.7 | 24.0 | 39.7 | 34.6 | 154.7 |
| (% GDP) | (3.6) | (-1.7) | (2.3) | (3.4) | (2.4) | (11.0) |
| Financial transactions | -5.7 | 7.1 | -1.5 | -1.0 | -3.4 | -10.7 |
| Net cash requirement | 22.7 | -8.5 | 22.5 | 38.7 | 31.2 | 144.0 |
| (% GDP) | (2.9) | (-0.9) | (2.1) | (3.3) | (2.2) | (10.2) |
Note: Items may not add up to totals because of rounding.
Sources: Adapted from HM Treasury (2010) Budget Report 2010, June; ONS (2010a) Financial Statistics, October.
The indirect taxes are collected by Revenue and Customs.
This Consolidated Fund revenue (£359.2bn), together with social security receipts (£95.6bn), business rates (some £24.3bn) and the Council Tax (£25.0bn) plus other miscellaneous receipts, are necessary to pay for the government’s expenditure plans outlined in Chapter 18.
Details of the main items of government income and expenditure are shown in Table 19.2. The growing economy of the late 1980s helped contribute to increased tax revenue and the creation of budget surpluses from 1987/88 to 1990/91. However, these surpluses shrank rapidly after 1989 as government revenue fell and government expenditure rose in the wake of the most protracted period of recession since the inter-war years. The government’s budget situation from the second half of the 1990s can be seen in Table 19.2. This format follows the new European system of accounts and shows the strong growth in public sector current receipts after 1996/97. For example, between 1998/99 and 2000/01 (not shown in Table 19.2) both the public sector net borrowing (formerly called the financial deficit) and the net cash requirement (formerly the public sector borrowing requirement) were negative, which meant that the government was in the healthy position of being able to repay debt. However, from 2001/02 onwards this trend was reversed as the government’s borrowing increased once more. This reversal was mainly due to a slowdown in the rate of economic growth (slower growth in tax receipts) and the government’s increasing commitment to public expenditure on education and health. The significant worsening of the public sector borrowing between 2007 and 2010 was the result of the combined effects of increased expenditure by the then Labour government, the effects of the financial crisis and the slow-down in economic growth.
The tax base
The tax base is essentially the ‘object’ to which the tax rate is applied. Excluding National Insurance contributions, taxes are usually grouped under three headings as regards tax bases: taxes on income (income, corporation and petroleum revenue taxes); taxes on expenditure (VAT and customs and excise duties); and taxes on capital (capital gains and inheritance tax).
Figure 19.1 shows that for 2009/10, taxes on income were expected to yield 49.2% of the Total Tax Revenue of £359.2bn, taxes on expenditure 36.7% and taxes on capital 1.4%. In addition to these taxes (not in Fig. 19.1) there were compulsory levies in the form of Social Security receipts (National Insurance contributions) from individuals and companies of
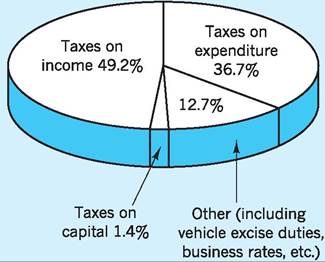
Fig. 19.1 Government revenue in 2009/10 and the tax base (as % of total tax revenue of £359.2bn).
was levied at 10% on savings income and a basic rate (20%) and higher rate (40%) on taxable income whilst VAT items that are not exempted are zero-rated or pay 17.5% (now 20%). These tax rates can be regarded as progressive, proportional or regressive, though such terms must be defined strictly as they are often used loosely. For a tax to be regarded as progressive, its rate structure must be such that the tax takes a rising proportion of total income as income increases; a proportional tax takes a constant proportion, whilst a regressive tax takes a declining proportion.
The pattern of UK taxation
£95.6bn and council tax of £25.0bn, raising the burden further on income.
Classifying taxes in terms of tax base, rather than method of collection, is often of more interest to economists, especially when calculating tax incidence (on whom the tax falls)! However, using the tax base does present problems of definition. For instance, Lord Wrenbury, in a legal judgment in 1925, defined income tax as being that which is ‘within the Act, taxable under the Act’.
National Insurance contributions, because they are based on calculations by actuaries, are not classified as a tax on income, yet they are levied as a percentage of income. Whatever the tax base, the taxes levied can be one of two types, either specific (lump sum) or ad valorem.Specific and ad valorem taxes
A specific tax is expressed as an absolute sum of money per unit of the good. Excise duties are often of this kind, being so many pence per packet of cigarettes or per proof of spirit. An ad valorem tax is a percentage tax, levied not on volume but on value; e.g. in 2009/10 VAT was 17.5% (now 20%) of sales price, and corporation tax was 28% of assessable profits for larger companies and 21% for smaller companies.
Rate of taxation
Another useful classification is between progressive, proportional and regressive taxes. Tax is imposed as a rate or series of rates; e.g. income tax in 2009/10
A broadly proportional tax system
Since a progressive tax means that the rich pay more, not only in an absolute sense, but as a proportion of their total income, we need to know more than that the marginal rate of tax rises with income.1 If, for instance, tax allowances and exemptions are more easily acquired by higher-income groups (as with mortgage repayments, etc.) then, despite a rising marginal rate, the individual may pay a smaller proportion of a higher total income in tax. In fact, it is the average rate2 that is the best guide to whether the tax or tax system is, or is not, progressive. If the average rate is rising with income, then the tax is taking a higher proportion of higher incomes, i.e. the tax is progressive.
As we know from any game, say cricket, only when an individual scores more on his last (marginal) innings than his average for all previous innings, will his overall average actually rise. In the same way, only when the marginal rate of tax is higher than the average rate, will the average rate rise as income rises, and the tax be progressive. If the marginal and average rates are equal, then the average rate will be unchanged as income rises, so that the tax is proportional. If the marginal rate is below the average rate, then the average rate falls as income rises, and the tax is regressive.
Figure 19.2 shows that, for the UK, direct taxes (the unshaded area in each bar) are progressive, taking a larger proportion of the total (gross) income of richer households. Indirect taxes are in contrast regressive, taking a declining proportion of such income. Overall, taking both direct and indirect taxes
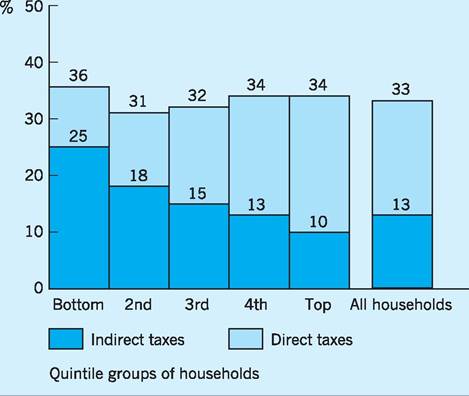
Fig. 19.2 Direct and indirect taxes as a percentage of gross household income (2008/09). Source: Adapted from ONS (2010c), The Effects of Taxes and Benefits on Household Income, 2008/09, June.
Table 19.3 The regressiveness of indirect taxes (2008/09).
Indirect taxes as percentage of disposable income per household
| Quintile groups of households | VAT | Other indirect taxes | Total indirect taxes |
| Bottom fifth | 10.7 | 17.9 | 28.6 |
| Next fifth | 8.3 | 12.6 | 20.9 |
| Middle fifth | 7.2 | 10.4 | 17.6 |
| Next fifth | 7.1 | 9.5 | 16.6 |
| Top fifth | 5.5 | 6.6 | 12.1 |
Source: Adapted from ONS (2010c) The Effects of Taxes and Benefits on Household Income, 2008/09, June.
together, the UK tax system is broadly proportional to income.
Although indirect taxes as a whole are regressive, there is some variation between different types of indirect tax. As we observe from Table 19.3, VAT is a more mildly regressive tax, whereas other indirect taxes are strongly regressive.
A shift towards indirect taxation
We have seen that indirect taxes are more regressive than direct taxes. Here we chart the substantial changes that took place in the direct/indirect tax ratio.
As Fig. 19.3 indicates, throughout the 1950s and 1960s taxes on income (direct) and expenditure (indirect) maintained a steady relationship, with taxes on income yielding around 10% more revenue. During the early and mid-1970s, however, the balance changed in favour of direct taxes on income as revenue providers for central government, due in part to inflation raising money incomes (and therefore direct tax receipts) and in part to fiscal drag. Fiscal drag is the extra tax yield which results from the fact that changes in both tax allowances and tax bands may
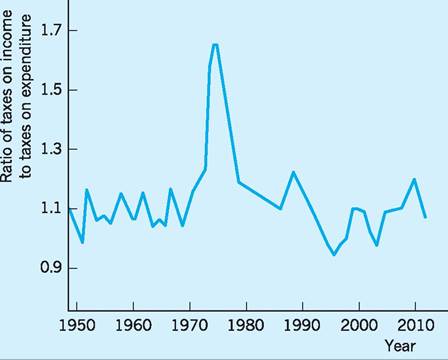
Fig. 19.3 The ratio of central government taxes on income to taxes on expenditure, 1949-2010. Source: HM Treasury (2010) Budget Report 2010, and previous issues.
not occur until after inflation has had its impact on money incomes. By 1975 direct taxes on income had peaked, providing some 60% more revenue than taxes on expenditure. The ratio fell substantially after that, and by 1986 direct taxes provided only some 10% more revenue than taxes on expenditure. After 1986 the ratio began to edge upwards again as incomes increased, with growing prosperity in the economy raising the yield from direct taxes. However, in 1988/89 the Chancellor once more reversed the trend by permitting a substantial over-indexation of tax allowances. This, together with the increase in VAT rates to 17.5% in the 1991 Budget, has caused the ratio to continue its downward path before settling to a ratio closer to its 1950-70 trend. Indeed, actual and projected increases in indirect tax (e.g. VAT rose to 20% in January 2011) are likely to further reduce this ratio.
Income taxes are more ‘visible’ to individuals than expenditure taxes, which to some extent are hidden in product prices. This may well have contributed to the feeling that the UK was overtaxed, despite the fact that this is contradicted by the evidence (see Table 19.5 below). It may be helpful to look further into the factors helping to establish the pattern shown in Fig. 19.3.
With the slowing down of inflation in the mid- to late 1970s, the ratio of direct to indirect taxes in total revenue began to fall. The new Conservative government in 1979 then made a deliberate switch away from direct income taxation towards indirect taxation, cutting the standard rate of income tax from 33% to 30%, and raising VAT from 8% to 15%. We might have expected this switch to reinforce the downward trend in the ratio of direct to indirect tax receipts. In fact, higher inflation in the early years of that government prevented the ratio falling. Since the early 1980s, the receipts from direct taxes on income have fluctuated around an average figure some 10% above those from indirect taxes on expenditure; we have returned to the broad pattern of the 1950s and 1960s. The restored importance of indirect taxes, whatever its source, must, in the context of our earlier analysis, have made the UK tax system less progressive than it would otherwise have been.
A rise in the UK tax burden
We have seen that the structure of UK taxation has changed in recent years. What about the level of taxation? The ratio of total tax take to National Income is a frequently used measure of tax ‘burden’. We can see from Table 19.4 that between 1964 and 1970 the total receipts from all taxes (including National Insurance) rose sharply as a proportion of
Table 19.4 The UK tax burden.
| Fiscal year | Tax as a percentage of GDP* |
| 1964-65 | 30.00 |
| 1969-70 | 37.50 |
| 1973-74 | 31.9 |
| 1978-79 | 33.1 |
| 33.5 | |
| 1980-81 | 35.5 |
| 1981-82 | 38.0 |
| 1982-83 | 38.2 |
| 1983-84 | 37.7 |
| 1984-85 | 38.2 |
| 1985-86 | 37.4 |
| 1986-87 | 37.0 |
| 1987-88 | 36.8 |
| 1988-89 | 36.1 |
| 1989-90 | 35.4 |
| 1990-91 | 34.9 |
| 1991-92 | 33.8 |
| 1992-93 | 32.7 |
| 1993-94 | 31.8 |
| 1994-95 | 33.0 |
| 1995-96 | 33.6 |
| 1996-97 | 34.0 |
| 1997-98 | 35.1 |
| 1998-99 | 35.5 |
| 1999-2000 | 35.5 |
| 2000-01 | 36.3 |
| 2001-02 | 35.8 |
| 2002-03 | 34.3 |
| 2003-04 | 34.3 |
| 2004-05 | 35.2 |
| 2005-06 | 35.9 |
| 2006-07 | 36.1 |
| 2007-08 | 36.4 |
| 2008-09 | 35.4 |
*Net taxes and National Insurance contributions as a percentage of money GDP.
Sources: Adapted from HM Treasury 2010, Budget Report2010; Office for Budget Responsibility (2010) Pre-budget Forecast, June.
GDP. Between 1970 and 1974 the tax ratio fell from 37.5% to 31.9% before rising to a peak in 1984/85. There was then a drift downwards in the figures until 1993/94 with substantial income tax reductions. However, the tax burden of 35.4% in 2009 was at a higher level than when the Conservatives came to power in 1979. The fear that the tax burden was likely to continue to rise during the first decade of the new millennium has led to proposals for radical changes in the Welfare State to curb growing government expenditure in this area. These concerns have become even more acute in 2011 with sharp reductions in government spending planned over the period to 2015.
The UK tax burden: a comparative survey
Despite the rise in UK tax burden since the mid- 1990s, and contrary to popular public opinion, the UK is only a middle-ranked country in terms of tax burden. From Table 19.5 we see that in 1981 the UK was the eighth-ranked country out of 20 in terms of tax burden, below the Scandinavian countries and close to Germany. OECD data in 2008 gave the UK a lower ranking of eleventh. Despite the high level of tax revenue as a proportion of GDP over this 20-year period, the UK tax burden in 2008 continued to lie well below that in the Scandinavian countries, where between 42% and 48% of GDP was taken in tax and social security contributions in that year, and was very similar to other major competitors such as Germany.
Tax burden and economic growth
It can be concluded from the evidence of Table 19.5 that there is little relationship between low tax burdens and faster economic growth. Belgium, with the third-highest tax burden in 2008, had an annual average growth rate of 2.5% in the period 1981-2008, close to the OECD average of 2.6% per annum, and was also ranked as high as ninth in terms of growth rate. On the other hand, Switzerland, with one of the lowest tax burdens, had only the sixteenth-fastest growth rate of 1.6% in that period, well below the OECD average.
Tax schedules and tax rates
We should, however, bear one or two cautionary points in mind before lapsing into complacency! A study by Messere etal. (1982) suggests that published tax schedules are a greater disincentive to effort than the ‘effective tax rates’ (i.e. the tax actually paid after
Table 19.5 Comparative tax burdens and economic growth.
| Tax* as a percentage of GNP | 1981 | 2008 | GDP growth (yearly average) 1981-2008 | |||
| Percentage | Rank | Percentage | Rank | Percentage | Rank | |
| Australia | 33.5 | 14 | 30.8 | 15 | 3.5 | 3 |
| Austria | 49.6 | 4 | 42.9 | 5 | 2.4 | 10 |
| Belgium | 49.6 | 4 | 44.3 | 3 | 2.5 | =9 |
| Canada | 40.0 | 12 | 32.2 | 13 | 2.7 | 7 |
| Denmark | 55.6 | 3 | 48.3 | 1 | 1.9 | 14 |
| Finland | 39.6 | 13 | 42.8 | 6 | 2.5 | =9 |
| France | 47.6 | 7 | 43.1 | 4 | 2.1 | =13 |
| Germany | 42.3 | 9 | 36.4 | 10 | 2.1 | =13 |
| Greece | 31.6 | 16 | 31.3 | 14 | 2.5 | =9 |
| Ireland | 41.6 | 10 | 28.3 | 17= | 5.6 | 1 |
| Italy | 33.4 | 15 | 43.2 | 3 | 1.7 | 15 |
| Japan | 28.3 | 19 | 28.3 | 17= | 2.2 | 12 |
| Luxembourg | 40.0 | 11 | 38.3 | 8 | 5.2 | 2 |
| Netherlands | 49.4 | 6 | 37.5 | 9 | 2.6 | =8 |
| Norway | 48.7 | 2 | 42.1 | 7 | 2.8 | 6 |
| Spain | bgcolor=white>27.220 | 33.0 | 12 | 3.2 | 4 | |
| Sweden | 56.9 | 1 | 47.1 | 2 | 2.3 | 11 |
| Switzerland | 30.8 | 18 | 29.4 | 16 | 1.6 | 16 |
| United Kingdom | 42.4 | 8 | 35.7 | 11 | 2.6 | =8 |
| United States | 31.1 | 17 | 26.9 | 18 | 3.1 | 5 |
*Including social security contributions.
Sources: OECD (2010c) Taxation: Key Tables for OECD, April and previous issues; OECD (2010a) Economic Outlook, No. 87, Annex, Table 1.
all personal and other allowances have been calculated). The argument here is that it is tax schedules as shown in Table 19.6, widely publicized in newspapers and annual tax returns, which form the basis for the ordinary citizen’s notion of tax burden.
In analysing tax schedules, the Messere study found that a higher proportion of taxpayers (over 95%) paid the basic rate in the UK than elsewhere, and that both the initial and top rates of tax on earned income were higher in the UK than elsewhere. Nevertheless, the taxpayer on average income in the UK paid a marginal rate no higher than in other OECD countries. Since 1987/88 the Conservative, Labour and (since 2010), Coalition governments have simplified the tax structure and reduced tax rates (as shown in Table 19.6 and Fig. 19.4) in order to try to encourage incentives. By the late 1990s, and as was
Table 19.6 UK income tax schedules, 1987/88 and 2010/11.
| Rate of tax (%) | 1987/88 Taxable income (£) | 2010/11 Taxable income (£) |
| 20 | - | 0-37,400 |
| 27 | 0-17,900 | - |
| 40 | 17,901-20,400 | Over 37,400 |
| 45 | 20,401-25,400 | - |
| 50 | 25,401-33,300 | Over 150,000 |
| 55 | 33,301-41,200 | - |
| 60 | Over 41,200 | - |
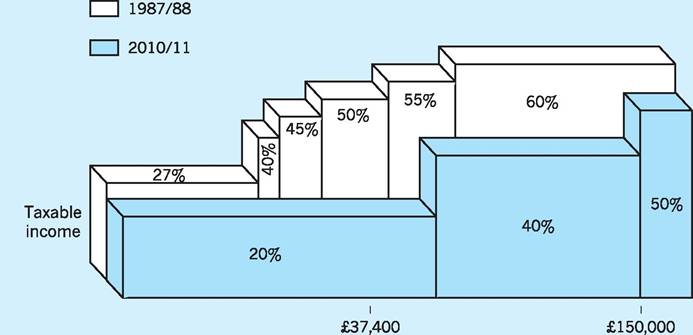
Fig. 19.4 Comparison of income tax between 1987/88 and 2010/11.
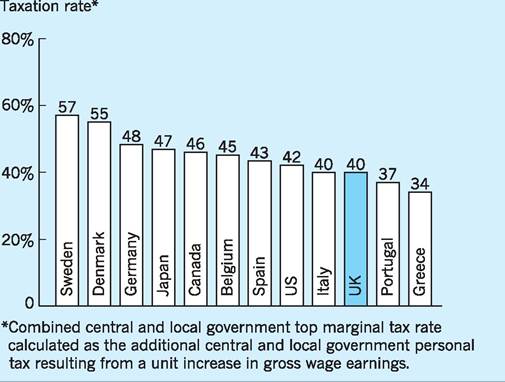
Fig. 19.5 Top marginal rates of personal income tax, 2009. Source: Adapted from OECD (2010b) Tax Database 2009.
still the case in 2009, the Treasury could safely claim that the UK’s top marginal rate of income tax at 40% was below that of its major competitors, as can be seen from Fig. 19.5. However, in April 2010 a new marginal rate of tax of 50% was introduced for those earning over £150,000 of taxable income, so that the UK is now less attractive than previously for high earners.
A further reason for taxpayers believing that the burden of taxation is higher than it actually is may arise from a failure to understand the method of collection of income tax. Income tax is not collected on the total amount of income. Each individual is granted allowances or exemptions that reduce the total amount of income liable to tax. In 2010/11 each single person under 65 was, for example, given an allowance of £6,475. These allowances, plus a few others, are deducted from the total income to produce the taxable income. Tax rates of 20%, 40% (on taxable incomes over £37,400) and 50% (on taxable incomes over £150,000) are then applied to this taxable income. Thus the average burden of taxation for the average taxpayer is considerably below the main 20% and 40% seen in the tax schedules.
Overall there appears little evidence that the UK has an excessive burden of tax in comparison to other countries. Although the proportion of GNP taken in tax has tended to rise in the UK since the early 1970s, the UK is, in comparative terms, a lower- ranked country in terms of tax-take, with tax (including Council Tax) amounting to 35.4% of GDP in 2009/10. However, particular groups of UK taxpayers at the lowest and highest taxable income scales did suffer unusually high marginal rates during the 1970s and 1980s. This, together with the growing ‘visibility’ of the income tax and social security payments system in the UK, may have created the impression of a comparatively high tax burden, but this impression was, in fact, misleading for the average taxpayer and arguably even for the top taxpayer (Fig. 19.5). The post-1988/89 reduction in tax rates and simplifications of the system have helped to improve the tax burden on low-income earners, and have reduced the overall burden of the tax system over the last 25 years as seen in Table 19.4.
I Does the level of taxation matter?
Clarke suggested in 1945, with the support of Keynes, that when taxation of all kinds was more than 25% of National Income, damaging pressures would follow. In fact, most industrial countries passed this figure over 30 years ago, with tax ratios of over 40% for some countries in the 1970s, yet they experienced low inflation and rapid growth of real incomes. However, perceptions of the benign nature of taxation have begun to change in more recent years, reverting back to those of Clarke and Keynes. Two of the major criticisms of a high tax burden relate to its (alleged) erosion of economic incentives and its encouragement of tax avoidance and evasion. We now consider these criticisms.
Impact of taxes on incentives to work, save and take risks
As the reader familiar with indifference curve analysis will know, a higher tax on income will have two effects, which pull in opposite directions. First, there is an ‘income effect’, with real income reduced via higher taxes, which means less consumption of all items, including leisure, i.e. more work is performed. Second, there is a ‘substitution effect’, with leisure now cheaper via higher taxes, since less real income is now sacrificed for each unit of leisure consumed. The substitution effect leads to cheaper leisure being substituted for work, i.e. less work. On grounds of theory alone we cannot tell which effect will be the stronger, i.e. whether higher taxes on income will raise or lower the time devoted to work rather than leisure (where, of course, the worker has some choice).
The only general conclusions that can be drawn from indifference analysis are the following.
1 Progressive taxes have higher substitution effects, and are therefore likely to cause a greater increase in leisure consumption (i.e. less work) than if the same sum of money were raised via a proportional tax.
2 Taxes on savings create a strong disincentive to future savings via their double-taxation effect. Since saving takes place out of real disposable (net) income, to tax the returns on savings is to impose a further tax on net income.
3 Taxes on investment may discourage high-risk projects. Investment projects involve combinations of risk and yield, those with more risk usually providing more yield. If yields on investment income are more heavily taxed, then this may discourage high-risk investments, such as North Sea oil-prospecting, and encourage low-risk investments (including cash-holding).
Theory can take us little further than this general analysis. Beyond it we must look at actual behaviour to assess the impact of higher taxes on incentives. Empirical studies have taken three forms: (a) controlled experiments, usually observing how selected persons respond to higher benefits (negative taxes);
(b) questionnaires based on random samples, and
(c) econometric studies using data on how people have responded in the past to tax changes.
Studies up to 1970
Brown and Dawson (1969) conducted an exhaustive review of tax studies in the UK and USA from 1947 to 1968. They concluded that higher taxation had a disincentive effect on work (income < substitution effect) for between 5% and 15% of the population. These were mainly people who had the greatest freedom to vary their hours of employment - those without families, the middle-aged, the wealthy, and rural workers. In contrast, higher taxation had an incentive effect on work (income > substitution effect) for a rather smaller percentage of the population, who were characteristically part of large families, young, less well-off, urban dwellers. From a national viewpoint the small net disincentive effect on the population of higher taxes was regarded by Brown and Dawson as of little significance; over 70% appeared neutral (income = substitution effect) in their work response to higher taxes.
As regards the UK, two of the most important studies reviewed by Brown and Dawson were those based on questionnaires by Break (1957) and Fields and Stanbury (1971). In 1956, Break found a small net disincentive effect, with an extra 3% of the population claiming higher taxes to be a disincentive to further work than claimed it to be an incentive. In 1968 Fields and Stanbury updated Break’s UK study and found the net disincentive effect to have grown to 8% of the population. In both studies the net disincentive effect was greater for higher-income groups, as one might expect with these paying higher marginal taxes (stronger substitution effects). This small growth in overall net disincentive effect between 1956 and 1968, and its being more pronounced at higher- income levels, was really all the empirical support there was in the UK for those suggesting that higher taxes discouraged work effort.
Studies after 1970
Controlled experiments and questionnaire results after 1970 gave no clearer a picture than those before 1970. If anything, they again pointed to a slight disincentive of higher taxes. For instance, Brown and Levin found that an increase in marginal tax rates for 2,000 Scottish workers in 1974 reduced hours worked, at least for higher-income groups. Fiegehen and Reddaway conducted a study on incentives amongst senior managers at board level in 94 companies in 1978, just before the large tax cuts introduced by the (then) newly elected Conservative government a year or so later. Similarly to Break and Fields and Stanbury (see above), they showed that 12% of managers reported an incentive effect of high taxation on hours of work, while an equal percentage reported a disincentive effect. The most common response from 41% was ‘no reply or don’t know’. Fiegehen and Reddaway concluded: ‘it is clear that, in total, any disincentive effects that operated on senior managers had a minimal impact on the activities of British industry’. Such studies were hardly a basis for advocating that tax cuts would lead to an upsurge in work effort! An important study by the Institute of Fiscal Studies (Dilnot and Kell 1988) tried to assess the effects of the 1979/80 reduction in the top rate of UK income tax from 83% to 60% on tax receipts. The argument used to support these top-rate tax cuts was that the lower income tax rates should provide extra incentives to work harder and thus boost tax revenue. The study found that the subsequent increase in tax revenue during the period to 1985/86 could be explained mostly by factors such as employment growth, growth of earnings and growth of self-employment rather than by any ‘incentive’ effects. Dilnot and Kell felt that any ‘incentive’ effect which may have been present could only account, at most, for £1.2bn or 3% of the total increase in tax revenues over the period studied.
Flemming and Oppenheimer (1996) also found little evidence to support the suggestion that reduced marginal tax rates at the upper end would unleash entrepreneurial talent and labour effort. They argued that if skilled or energetic workers supplied more effort (i.e. labour input/hours worked) as higher marginal tax rate fell, then one might expect that the relative price of their time/effort, i.e. wage per hour, would fall vis-a-vis other lower-skilled groups via an increase in relative supply resulting in a decrease in relative price (i.e. wage per hour). However, as noted in Chapter 14, pre-tax hourly earnings between different skill and occupational levels have widened considerably over the last 20 years, indicating that the higher-income earners have increased their relative wages. This rather suggests that the higher-income, higher-skilled segment of the workforce may not have increased the number of hours worked, i.e. the supply of effort, but may merely have benefited from demand changes which have moved in their favour, as discussed in Chapter 14. Interestingly, the disincentive to work resulting from high real marginal rates of tax is arguably more of a problem for those
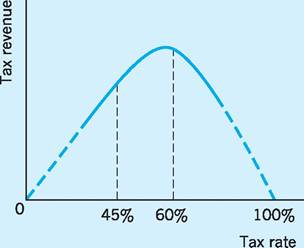
Fig. 19.6 The ‘Laffer' curve.
on below-average incomes, as the discussion of the poverty ‘trap’ indicates below.
The Laffer curve
Professor Laffer derived a relationship between tax revenue and tax rates of the form shown in Fig. 19.6. The curve was the result of econometric techniques, through which a ‘least squares line’3 was fitted to past US observations of tax revenue and tax rate. The dotted line indicates the extension of the fitted relationship (continuous line), as there will tend to be zero tax revenue at both 0% and 100% tax rates. Tax revenue = tax rate ? output (income), so that a 0% tax rate yields zero tax revenue, whatever the level of output. A 100% tax rate is assumed to discourage all output, except that for subsistence, again yielding zero tax revenue. Tax revenue must reach a maximum at some intermediate tax rate between these extremes.
The London Business School has estimated a Laffer curve for the UK using past data. Tax revenue was found to reach a peak at around a 60% ‘composite tax rate’, i.e. one which includes both direct and indirect taxes, as well as various social security payments, all expressed as a percentage of GDP. If the tax rate rises above 60% then the disincentive effect on output is so strong (i.e. output falls so much) that tax revenue (tax rate ? output) actually falls, despite the higher tax rate. The Laffer curve in fact begins to flatten out at around a 45% composite tax rate. In other words, as tax rate rises above 45%, the disincentive effect on output is strong enough to mean that little extra tax revenue results. Econometric studies of this type have given support to those in favour of limiting overall rates of tax. It is interesting to note that shortly after this study, the top rate of tax on earned income in the UK was indeed reduced from 83% to 60%.4
The reduction in the top income tax rate to 40% in 1988/89 was inspired by the Laffer curve and supplyside economics. The Chancellor of the Exchequer believed that the tax cuts would increase revenue. He based his tax cuts on American research by Lindsey that concluded that reductions in the top tax rates to the American government in 1981/82 were costless as the top 170,000 taxpayers ended up paying $26.6bn under new legislation instead of $26bn under the old. Lindsey argued that the tax cuts not only created incentives but also increased the cost of tax avoidance.
This research has been criticized partly because it is American evidence and partly because the American rates were slashed by 23% over three years, with the top personal rate being reduced from 70% to 50% whilst the UK moved from 60% to 40% in just one year. Finally, Lindsey and other tax experts have consistently argued that as tax rates are cut, economic efficiency is raised by reducing tax breaks and shelters at the same time. However, fresh evidence on the impact of cuts in high rates of British taxation has been provided by Minford and Ashton (see Brown 1988). The latter study concluded that the cut in the higher British tax rates to 40% would increase hours worked by 8%.
In summary, those who advocate ‘supply-side economics’, with tax reduction a key instrument for improving economic incentives, leading to an upsurge of productive activity, receive limited support from empirical studies. Only a small net disincentive effect has been found from studies using questionnaires, such as those by Break and by Fields and Stanbury. This conclusion was reinforced by the later study of Dilnot and Kell. On the other hand, the Laffer curve constructed for the UK by the London Business School, and work by Minford in the UK and Lindsey in the US, do indicate that reductions in the composite rate of tax below 60% and down as far as around 45%, have strong incentive effects on output - the converse of rises in tax rate between 45% and 60% having strong disincentive effects. However, we noted in Table 19.4 that the UK composite tax rate is currently less than 40%, and reductions below this level receive little support from econometric studies.
Nevertheless ‘supply-side economics’ has reemerged in the taxation debate in recent times with the idea of a ‘flat tax’.
Table 19.7 I mpacts of various ‘flat tax' options.
| Average tax rate on taxpayers’ total income | Flat tax rate on taxed income | Allowances and deductions | Losers - millions (net number) | Tax revenue lost |
| 18 | 23 | Unchanged | 27 | Nil |
| 15 | 20 | Personal allowances | 8 | £10bn |
| raised by £2,500 | ||||
| 13 | 18 | Unchanged | None | £20bn |
The idea of a single, low income tax rate to be paid by all, i.e. a ‘flat tax’, has been much discussed in recent times. For example, the Adam Smith Institute (ASI) has proposed a ‘flat tax rate’ of 22% with a personal allowance of £15,000 (over twice as high as the current allowance). The cost of setting such a high level of personal allowances - to lift the poorest out of tax - would be £63bn, but the ASI believed this could be recouped in three years as lower taxes create incentives for us all to work harder and to stop avoiding tax. The suggestion of supporters of the flat tax is that the British tax system has become so complex that few can understand it, unintended disincentives to work frequently occur, and failure to follow simpler, lower tax regimes in the rest of the world is undermining UK international competitiveness.
However, critics of the ‘flat tax’ approach point out that it is a myth that the poor will benefit from lower tax rates. For example, Brian Reading, of Lombard Street Research, noted that 50% of the total income tax revenue is actually paid by the top 10% of income earners, so that 10% (3 million people) would gain the most and the other 90% (27 million people) would lose the most from a move to a ‘flat tax’ regime which collected the same amount of income tax revenue as is currently collected and kept the same personal allowances. This would require a flat tax rate of 23% and would potentially result in 24 million losers ‘net’.
Table 19.7 provides some useful data in this respect. The average tax rate is currently 18%, but the flat tax rate would have to be set higher than this because of personal allowances which remove taxes from initial slices of income.
Poverty and unemployment traps
One area where the facts do strongly suggest that the current level and type of taxation may have eroded incentives, concerns the ‘poverty’ and ‘unemployment’ traps. The families in these traps are enmeshed in a web of overlapping tax schedules and benefit thresholds, developed and administered by two separate departments (Department for Work and Pensions and the Treasury) with differing objectives in mind.
The ‘poverty trap’ describes a situation where a person on low income may gain very little, or even lose, from an increase in gross earnings. This is because as gross earnings rise, the amount of benefits paid out decreases while income tax deductions increase. In extreme circumstances, net income may actually fall when a person’s gross earnings rise, i.e. an implicit marginal tax rate (or marginal net income deduction rate) of over 100%. After 1988, the government tried to resolve the gross disincentive effects of such high rates of deduction by relating benefits to net income after tax. However, the problems of the poverty trap dilemma still occur, if not to the same extent as before.
Table 19.8 shows the net income situation of a married man with two children in April 2009 when his gross income rises from £150 to £300 per week. We can see that net income rises little over this range. For example, an increase in income from £150 to £200, i.e. £50 per week, gives only an extra £2.25 in income after deductions, i.e. £47.75 is lost. This results in an implicit marginal tax rate (or marginal deduction rate) of about 95% (47.75/50). In 1992, using a similar family situation and gross income change, the rate was as high as 124%. The improvements in the family credit arrangements since 1992 have eased such extreme situations but the rates are still high and often provide little encouragement for those in the area of the poverty trap to work harder.
A high implicit marginal tax rate (marginal deduction rate) can therefore act as a major disincentive to low income earners. This point is further exemplified
Table 19.8 The poverty trap: married couple with two children under 11.1
April 2009
| (£ pw) | (£ pw) | (£ pw) | (£ pw) | |
| Gross earnings2 | 150 | 200 | 250 | 300 |
| Plus Child benefit | 33.20 | 33.20 | 33.20 | 33.20 |
| Child tax credit | 96.32 | 96.32 | 96.32 | 96.32 |
| Working tax credit | 61.48 | 41.98 | 22.48 | 2.98 |
| Housing benefit | 20.78 | 11.03 | 1.28 | - |
| Council tax benefit | 12.16 | 9.16 | 6.16 | 3.16 |
| Less | ||||
| Income tax | 5.10 | 15.10 | 25.10 | 35.10 |
| 4.40 | 9.90 | 15.40 | 20.90 | |
| Net income | 364.44 | 366.69 | 368.94 | 379.66 |
1For a married man with two children under 11 with weekly Local Authority rent of £69.00 and Council tax of £27.00.
230 hours per week at the minimum wage (April 2009) was £171.9.
Source: Adapted from Department for Work and Pensions (2009) Tax/Benefit Model Tables (April 2009).
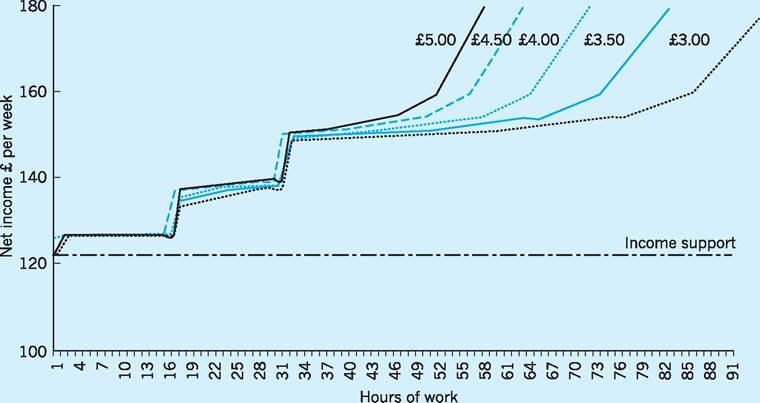
Fig. 19.7 Hours, wages and net family income: couple (one earner) with two children aged 4 and 6. Source: Child Poverty Action Group (1998), Fig. 1.
by Fig. 19.7 which simulates the net income of a family with two young children and only one income earner, under different income circumstances just prior to the introduction of the Minimum Wage in 1999 (Child Poventy Action Group 1998).
The vertical axis presents net pay after all benefits (here income support) and tax payments have been taken into consideration. The horizontal axis presents the hours worked per week. The income support level for such a family under the Jobseekers’ Allowance would be around £125 per week and would correspond to the income that the family would receive if the only wage earner in the family was unemployed. The two other lines in Fig. 19.7 denote the change in net income which the family would receive if the person was in employment. The net income lines are plotted for wages of between £3.00 and £5.00 per hour and, as one would expect, net income tends to rise in line with increases in the number of hours worked. Notice, however, that when the wage per hour is only £3.00, net income barely rises between 10 and 20 hours’ work per week, and for more than 30 hours’ work per week. For example, if the worker increases the number of hours worked from 30 to 80 hours a week, the net pay rises by only about 3p for every pound earned. In fact the ‘plateaux’ broadly represent the impact of the poverty trap. If wages increase to £5.00 per hour then there is much less evidence of any such plateaux. This analysis would seem to suggest that the reason for the existence of a poverty plateau is a combination of the complexity of the benefit/tax structure (which creates very high implicit marginal tax rates at lower income levels), and the very low wages per hour paid to many workers. The extent of this problem can be gauged from the fact that there were still some 1.8 million UK workers earning less than £3.40 per hour and some 3.75 million earning less than £3.50 per hour prior to the introduction of the £3.60 hourly minimum wage in 1999.
The continued problems of a low wage and its effects on the poverty trap can be seen in Table 19.9. The table presents figures for the number of workers in jobs paying less than the minimum wages for different age groups between 2004 and 2009. The estimates indicate that a total of 242,000 people were in jobs paying less than the minimum wage in 2009, comprising 0.9% of the workforce. In absolute terms, most of the people earning such low wages were over 22 years of age, but in percentage terms, it was the young people aged between 16 and 21 who had the highest figure. Although the low pay situation has improved since the late 1990s, it has been difficult to make major inroads into this intractable low pay/ poverty trap problem.
As we have noted, the ‘poverty trap’ relates to people who are in work but find little incentive to improve their situation by extra work effort. On the other hand, some workers never even enter the labour market because of another problem, often called the ‘unemployment trap’.
The ‘unemployment trap’ occurs when people find that their income when employed is no better than if they were unemployed. Taking figures for April 2009, Table 19.10 shows that when the gross wage of the married man in our example is £200 per week, the net income after various allowances and deductions is £366.69. If he was unemployed, his net income would be £334.95, i.e. the replacement rate is 91.34%. The replacement rate measures the proportion of a person’s net income that will be ‘replaced’ by the benefit system if that person loses his or her job. The introduction of family credit in 1988 helped to decrease the number of people with replacement rates of over 100%. The replacement rate for a person
Table 19.9 Number and percentage of jobs paid below the national minimum wage in the UK.
| Jobs held by people aged 16-17 | Jobs held by people aged 18-21 | Jobs held by people aged 22+ | All jobs | |||||
| 000s | (%) | 000s | (%) | 000s | (%) | 000s | (%) | |
| April 2004 | - | (0.0) | 44 | (2.3) | 233 | (1.0) | 276 | (1.1) |
| April 2005 | 20 | (4.0) | 55 | (3.0) | 233 | (1.0) | 308 | (1.2) |
| April 2006 | 14 | (3.8) | 44 | (2.3) | 238 | (1.0) | 296 | (1.2) |
| April 2007 | 16 | (4.0) | 49 | (2.6) | 231 | (1.0) | 296 | (1.1) |
| April 2008 | 16 | (3.9) | 46 | (2.5) | 212 | (0.9) | 274 | (1.0) |
| April 2009 | 14 | (4.1) | 44 | (2.6) | 184 | (0.8) | 242 | (0.9) |
Source: ONS (2010b) Statistical Bulletin: Low Pay Estimates 2009.
Table 19.10 The unemployment trap: unemployed married couple with two children under 11.*
| In work | £ pw | Out of work | £ pw |
| Gross earnings | 200 | Jobseekers’ allowance | 100.95 |
| Child benefit | 33.20 | Child benefit | 33.20 |
| Child tax credit | 96.32 | Child tax credit | 96.32 |
| Working tax credit | 41.98 | Housing benefit | 69.00 |
| Housing benefit | 11.03 | Council tax benefit | 27.00 |
| Council tax benefit | 9.16 | Meals and welfare | 8.48 |
| Income tax | 15.10 | ||
| National insurance | 9.90 | ||
| Net income | 366.69 | Net income | 334.95 |
| Replacement ratio | 334^5 = 91.34 |
366.69
*For a married man with two children under 11 with weekly Local Authority rent of £69.00 and Council tax of £27.00. Unemployed married couple with one earner previously working more than 30 hours a week.
Source: Adapted from Department for Work and Pensions (2009) Tax/Benefit Model Tables (April 2009).
in the same situation as our present example in 1992 was 104%, representing a marginal improvement. However, the fact that the income of a person when out of work is still around 91% of his income when in work provides little incentive to work.
From these examples, we can see that both poverty and unemployment traps provide a disincentive to work because people caught in these problematic situations find it difficult, if not impossible, to improve their position through their own efforts.
Impact of taxes on avoidance and evasion
Tax avoidance is legal; tax evasion is illegal, involving concealment in one form or another, and therefore fraud.
The black economy
The Inland Revenue has estimated that tax evasion was equal to between 6% and 8% of GDP in the UK - often called the ‘black economy’. However, other estimates have suggested that the black economy may even be as high as 10-12% of GDP (Lyssiotou et al. 2004). A National Audit Office report in 2008 calculated that there were approximately 2 million people involved in the black economy and that it had increased by 13% in real terms between 2003/04 and 2006/07. The value of the ‘black or hidden economy’ was calculated in 2006/07 as £145m which is equal to the GDP of Portugal, or as much as the UK Treasury earned from income tax in 2009/10 (see Table 19.1). One way in which the black economy can be estimated is through the difference between National Income when measured by the income method and when measured by the expenditure method. Apart from errors and omissions, these are defined in the National Accounts in such a way that they come to the same value. If, however, people receive income and do not declare it in tax returns, it will not appear on the income side, though expenditure will increase as the unrecorded income is spent on goods and services. In recent years the ‘income’ valuation - based on tax returns - has fallen short of the ‘expenditure’ valuation by progressively larger amounts.
I Direct versus indirect taxes
In Fig. 19.3 above we observed a switch from direct to indirect taxation since the late 1970s. We noted that this switch entailed a move towards a more regressive system of taxation, i.e. one which takes a smaller proportion of higher incomes. This must follow since we move away from direct taxes which we saw to be progressive, towards indirect taxes, which at best are proportional (VAT), and more usually are regressive (the Community Charge - now the Council Tax, Uniform Business Rate, excise duties, import duties, etc.). It might be useful to consider in more general terms the advantages and disadvantages of direct and indirect systems of taxation. For convenience we shall compare the systems under four main headings, with indirect taxes considered first in each case.
Macroeconomic management
Indirect taxes can be varied more quickly and easily, taking more immediate effect, than can direct taxes. Since the Finance Act of 1961, the Chancellor of the Exchequer has had the power (via ‘the regulator’) to vary the rates of indirect taxation at any time between Budgets. Excise and import duties can be varied by up to 10%, and VAT by up to 25% (i.e. between 13.13% and 21.87% for a 17.5% rate of VAT). In contrast, direct taxes can be changed only at Budget time. In the case of income tax, any change involves time-consuming revisions to PAYE codings. For these reasons, indirect taxes are usually regarded as a more flexible instrument of macroeconomic policy.
Economic incentives
We have already seen how, in both theory and practice, direct taxes on income affect incentives to work. We found that neither in theory nor in practice need the net effect be one of disincentive. Nevertheless, it is often argued that if the same sum were derived from indirect taxation, then any net disincentive effect that did occur would be that much smaller. In particular, it is often said that indirect taxes are less visible (than direct), being to some extent hidden in the quoted price of the good. However, others suggest that consumers are well aware of the impact of indirect taxes on the price level. Let us look in more detail at the direct versus indirect argument, first in relation to incentives to work and second in relation to incentives to save and take risks.
Work effort
In terms of effects on the supply of work effort, a case against the current system of direct taxes and in favour of a switch towards indirect taxes might be made in the specific cases of poverty and unemployment traps. However, no general case can be made for such a switch. In fact, both income and substitution effects of a rise in indirect taxes are in the same direction as those for a rise in direct taxes. By raising the prices of goods, higher indirect taxes also reduce real income, and at the same time reduce the cost of leisure in terms of goods forgone. In other words, the income and substitution effects we considered above apply to higher indirect taxes as well as to higher direct taxes. Whether the magnitude of the income and substitution effects will be the same for indirect as for direct taxes is quite another matter. It will partly depend upon which items are taxed. If indirect taxes are levied on goods with highly inelastic demand curves, then the indirect taxes will be largely passed on to consumers as higher prices. Both income and substitution effects will then be substantial in magnitude. Of course the converse also applies - if the indirect taxes are levied on goods with elastic demand curves, both income and substitution effects will be small. We can make no general claim for ‘superiority’ of either type of tax with regard to work incentives.
Saving and risk-taking
With regard to incentives for saving, indirect taxes have the advantage of avoiding the ‘double-taxation effect’ imposed by direct income taxes. Saving takes place out of net income, i.e. income that has already been taxed. To tax the return on savings, via a tax on investment income (e.g. dividends), is to impose a type of double taxation on that income, an obvious disincentive to saving. This is, however, a weak argument in support of indirect taxes as it is quite possible to devise a system of direct taxation that avoids double taxation.
The argument that indirect taxes are to be preferred because they avoid the discrimination against risky investments of a direct tax system can also be rebutted. Risky investments do usually have higher yields, and do therefore pay more direct tax than less risky investments. However, such discrimination could be reduced, perhaps by raising the value of allowances (e.g. on exploration costs, etc.) that can be set against tax.
In terms of incentives, then, there is no general case to be made for or against one or other type of tax system. If we are to be more specific, we must compare one particular type of indirect tax system with one particular type of direct tax system.
Economic welfare
It is sometimes argued that indirect taxes are, in welfare terms, preferable to direct taxes, as they leave the taxpayer free to make a choice. The individual can, for instance, avoid the tax by choosing not to consume the taxed commodity. Although this ‘voluntary’ aspect of indirect taxes may apply to a particular individual and a particular tax, it cannot apply to all individuals and all taxes. In other words, indirect taxes cannot be ‘voluntary’ for the community as a whole. If a chancellor is to raise a given sum through a system of indirect taxes, individual choices not to consume taxed items must, if widespread, be countered either by raising rates of tax or by extending the range of goods and services taxed.
Another argument used to support indirect taxes on welfare grounds is that they can be used to combat ‘externalities’. In Chapter 10 we noted that an externality occurs where private and social costs diverge. Where private costs of production are below social costs, an indirect tax could be imposed, or increased, so that price is raised to reflect the true social costs of production. Taxes on alcohol and tobacco could be justified on these grounds. By discriminating between different goods and services, indirect taxes can help reallocate resources in a way that raises economic welfare for society as a whole.
On the other hand, indirect taxes have also been criticized on welfare grounds for being regressive, the element of indirect tax embodied in commodity prices taking a higher proportion of the income from lower-paid groups. Nor is it easy to correct for this. It would be impossible administratively to place a higher tax on a given item for those with higher incomes, although one could impose indirect taxes mainly on the goods and services consumed by higher- income groups, and perhaps at higher rates.
In terms of economic welfare, as in terms of economic incentives, the picture is again unclear. A case can be made with some conviction both for and against each type of tax.
Administrative costs
Indirect taxes are often easy and cheap to administer. They are paid by manufacturers and traders, which are obviously fewer in number than the total of individuals paying income tax. This makes indirect taxes, such as excise and import duties, much cheaper to collect than direct taxes, though the difference is less marked for VAT, which requires the authorities to deal with a large number of mainly small traders.
Even if indirect taxes do impose smaller administrative costs than direct taxes for a given revenue yield, not too much should be made of this. It is, for instance, always possible to reform the system of PAYE and reduce administrative costs. The Inland Revenue is, in fact, considering a change from PAYE to an American system of income tax, with the obligation on taxpayers themselves to estimate and forward tax, subject to random checks. Also, the computerization of Inland Revenue operations may, in the long run, significantly reduce the administrative costs associated with the collection of direct taxes.
In summary, there is no clear case for one type of tax system compared to another. The macroeconomic management and administrative cost grounds may appear to favour indirect taxes, though the comparison is only with the current system of direct taxation. That system can, of course, be changed to accommodate criticisms along these lines. On perhaps the more important grounds of economic incentives and economic welfare the case is very mixed, with arguments for and against each type of tax finely balanced. To be more specific we must compare the particular and detailed systems proposed for each type of tax.
Tax and social security reform
The subject of tax reform is a topic in its own right and can only be touched upon here. Tax reform had been low on the political agenda before 1965, with the basic structure of taxes remaining unchanged for decades. Since then there have been more new taxes introduced than in any other equivalent peacetime period. Changes have included the introduction and repeal of selective employment tax; VAT replacing purchase tax; corporation tax replacing profits tax; the amalgamation of surtax and income tax; new taxes such as gambling and betting duties, and capital gains tax; and the replacement of estate duty first by capital transfer tax and subsequently by an inheritance tax.
Local taxation
In the late 1980s the Conservative government increased the pace of its tax reform. It introduced the Community Charge in England and Wales during 1990 (in Scotland during 1989), together with the Uniform Business Rate (UBR) in the same year. The unpopularity of the Community Charge or ‘poll tax’ led to its replacement in April 1993 by the Council Tax.
The ‘rates' system
The Community Charge was introduced to replace what was seen as the ‘unfairness’ of the old local authority rates system. The rates were a property tax, paid by tenants and owner occupiers. The total amount paid per household in tax was based on two figures: first, on the ‘rateable value’ of the property, which was a value based on an assessment of what the property could earn if it were let out on the open market; and second, on a ‘poundage’ expressed as ‘so many pence in the pound’. This was calculated by the local authority in accordance with the revenue it needed to raise to pay for local services. For example, if the local authority valued a house at £30,000 and the local poundage was 2p in the pound, then the total rates for that house would be £30,000 ? 0.02 or £600 per year. There were persistent complaints that the rates system was complicated and inequitable, for instance because it was difficult to properly assess the rentable value of any property. It was also based on the household unit, irrespective of how many people were actually living in the household. Also the rates had a regressive effect on some members of the public, e.g. on elderly people who sometimes occupied large, highly rated properties but who could no longer afford to pay the rates demanded since their incomes were insufficient. Finally, the total rates collected by this method were often inadequate to meet the increasing cost of local government spending on education, etc. As a result, this system was abolished for domestic premises and replaced by the Community Charge in 1990. For business premises the rating principle was retained in a modified form known as the Uniform Business Rate (UBR).
Hypothecation
A recent approach favoured by many as a means of raising the tax take whilst retaining public support, involves the idea of hypothecation. This is the allocation of current or additional taxes to specific spending outcomes. An example is the suggestion in the 1992 election manifesto by the Liberal Democrats that an extra 1% should be added to the basic rate of income tax and the entire extra revenue raised be used for education spending.
The Uniform Business Rate (UBR)
The UBR payable on any commercial property is based on two factors - the rateable value of that property, and a UBR ‘multiplier’. The rateable value represents the annual rental value of the property on the open market and is fixed by an independent valuation officer, with rateable values reviewed periodically throughout the UK. To determine the actual amount of UBR to be paid per year, the rateable value is then multiplied by a rating ‘multiplier’ or poundage. The Standard UBR multiplier in England for 2009/10 was 48.5p in the pound.
One of the inevitable problems with this new tax was that business properties in the more dynamic or prosperous areas would find their valuations rising overnight to a much higher level than before, while other businesses in less prosperous areas would experience a fall in their valuations. The UBR also represented a change in that the ‘poundage rate’ under this scheme was now set by central government and not by the local authority. Although the local authorities actually collect the UBR, the receipts are paid into a central fund outside local authority control. The fund is then redistributed to local authorities at a fixed rate per adult, with extra finance made available to those local authorities with special problems. This is clearly a further curbing of local authority financial control.
The Community Charge
Unlike the UBR, the Community Charge sought to depart from the old rating system method of calculating local taxes. The Community Charge was to be based not on the household, but on the individual. In other words, the Community Charge (or poll tax) was a personal tax assessed on each adult and expressed in the form of a lump-sum payment per year.
The Community Charge was unpopular because it meant an increase in tax for many families, especially those with a number of adults living in one household. It was also accused of being a regressive tax, in that the fixed charge per head tended to affect low income earners more than high income earners despite the existence of rebates for poor families. Also, the cost of administering the tax was high, at some 4% of its yield, whereas other taxes cost less than half that amount to collect. Many of these costs were associated with the need to register individuals and with the problems of chasing non-payers. The tax also created tensions between central government and some local authorities who felt that their ‘needs’ were greater than was implied by their Standard Spending Assessment (see below). As a result, some local authorities (often in hard-pressed urban areas) put an extra levy on their Community Charge. This increase in the Community Charge in major urban areas resulted in a general dissatisfaction with this form of local taxation. The intense unpopularity of the Community Charge led to its replacement by the Council Tax on 1 April 1993.
Council Tax
The Council Tax is a hybrid tax, which is both part property or household tax and part personal tax. The Council Tax is based on the capital value of each property, on the assumption that it contains two- adult members. If the property contains only one adult, then he or she will pay only 75% of the bill of a two-adult household. No additional tax is paid on a property where more than two adults reside. Also, personal discounts are given to certain classes of adults, e.g. those on very low incomes, handicapped people, those in full-time education, and so on. It has been calculated that about 25% of all households are entitled to some form of Council Tax rebate.
Properties are valued on a sample basis (e.g. one house may be taken as typical of that street or area) and assigned to specific property bands, as shown in Table 19.11. The average national property value is calculated and assigned to the appropriate band, i.e. band D in this case. From this base, the tax bills for properties in both higher and lower bands are calculated. For example, the average property value in England in 2009/10 was deemed to be £80,000, i.e. it is located in band D - between £68,000 and £88,000 (column one). This means that this band ranges from between 85% and 110% of the average property value (second column). Therefore the tax paid by property owners in band D is regarded as the ‘average’, i.e. 100 (third column). Properties which are valued at under £40,000 will pay 67% of the average bill, those valued at between £88,000 and £120,000 will pay 122% of the average bill, and so on.
The central government calculates a Standard Spending Assessment (SSA) for each authority based
Table 19.11 Council Tax: bands and property values, 2009/10 (England).
| Band | Property value (£) | Property value (% of national average) | Council tax (% of average property) | Average bill* (£) |
| A | Under 40,000 | up to 50 | 67 | 934 |
| B | 40,001-52,000 | 50-65 | 78 | 1,090 |
| C | 52,001-68,000 | 65-85 | 89 | 1,245 |
| D | 68,001-88,000 | 85-110 | 100 | 1,401 |
| E | 88,001-120,000 | 110-150 | 122 | 1,712 |
| F | 120,001-160,000 | 150-200 | 144 | 2,023 |
| G | 160,001-320,000 | 200-400 | 167 | 2,335 |
| H | Over 320,000 | 400-500 | 200 | 2,802 |
*For a property in SE England (2 or more adults).
Source: Adapted from Guide to 2009/10 Council Tax and Business Rate (2010).
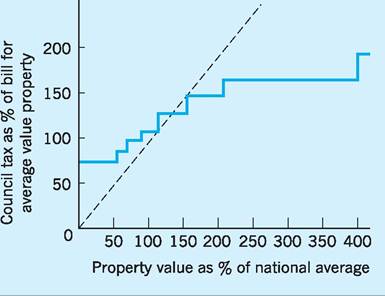
Fig. 19.8 Council Tax: property values and tax in each band.
Source: Adapted from Guide to 2009/10 Council Tax and Business Rate (2010) www.communities.gov.uk/documents.
on its estimate of the amount of money the authority needs to provide a ‘standard’ level of service given the demographic and other characteristics of the local area. The government grant to each local authority is then equal to its SSA minus an estimate of how much the authority can raise from other sources, e.g. Community Charge and the UBR. If all authorities kept to their SSA, then the actual average household bill would be shown in column four of Table 19.11.
There are some points worth noting about this scheme. First, the Council Tax, as in the case of rates, is a regressive tax in that occupiers of properties of below-average value pay proportionately more in tax, while occupiers of properties of above-average value pay proportionately less in tax. This can be seen from Fig. 19.8, in that the Council Tax line is flatter than the dotted 45% line, which would represent a proportionate tax. However, it may be said to be fairer than the Community Charge in that the tax does, at least, rise with the value of the house and it is reasonable to assume that those living in more expensive houses have higher incomes than those living in less expensive dwellings. Second, the administration of the scheme will be much easier because, unlike the Community Charge, collection is based on the household and not on the individual. Third, as with the Community Charge, the central government will still estimate the amount each local authority ‘needs’ to spend, i.e. the SSA. If a local council exceeds this amount, then the local Council Tax will be increased by a factor greater than the excess spending (i.e. the high-spending councils are penalized).
It has been calculated that some 37% of families were better off, and 37% worse off, as a result of the change from Community Charge to the Council Tax.
Tax, social welfare policies and work incentives
In addition to the significant changes which have taken place in local taxation, there have also been attempts by government to modify the tax structure in order to make it more equitable, while at the same time encouraging savings and increasing the base of UK share ownership. For example, the Approved Profit Sharing scheme (APS), the SAYE scheme and the Discretionary Share Option Scheme all provide tax incentives for employees to buy shares in their companies. Also the Personal Equity Plans (PEPs) introduced initially in 1986 encouraged small savers to invest in UK companies through unit and investment trusts. By making the income and capital gains from investing in such trusts free of tax, up to a maximum amount of £6,000 a year, it was hoped that savings would be encouraged, thereby helping to channel investment into UK industry. In April 1999, these were replaced by Individual Savings Accounts (ISAs). For example, during the 2009/10 tax year, savers can invest up to £10,200 tax free in an ISA with the advantage that they can have instant access to the tax-free saving. ISAs have also been sold by a wider range of providers, e.g. by post offices and supermarkets, as well as by the financial institutions. It is difficult to measure the success of such share and savings schemes in stimulating UK industry, since any increase in share ownership by employees will not necessarily improve company performance per se.
On the personal taxation front, 1990 saw the introduction of a greater measure of equity, in that independent taxation for married couples was introduced. This gave married women independent status as taxpayers, i.e. they could control their own tax affairs. Since 1805 husbands had been legally responsible for the married couple’s tax affairs and any married couple’s allowance had been received by the husband. In the budget of 1992 it was announced that from 1993/94 onwards any extra married allowance can be claimed in its entirety by either husband or wife, or it can be shared equally between them, thus making the tax system fairer to married women. In 1999, the married couple’s allowance was abolished, leaving a working husband and wife each receiving the single person’s allowance.
As far as the social security system was concerned, the government introduced important measures in 1988 to modify the whole system. These covered unemployment benefits, pensions, income support, housing benefits, a family credit system and the social funds. The State Earnings Related Pensions Scheme (SERPS), which provided a pension based on National Insurance contributions, was cut back. Designated occupational pension schemes could now ‘contract out’ of SERPS. This meant that state pensions would be reduced, but the private scheme must then guarantee to at least make up the difference. Contracted-out workers pay a rate of National Insurance contribution reduced by 2%, as do their employers. At the same time the old supplementary benefit and heating allowances were abolished and a new system of income support was introduced.
The incoming Labour government of 1997 built on these reforms in order to tackle both the poverty and unemployment traps discussed earlier. A Jobseeker’s Allowance (JSA) had already been introduced in 1996 to encourage more active job search during the first months of unemployment. Under the JSA the unemployed person and the Employment Service Adviser must draw up an agreement specifying what is expected of the unemployed person if they are to continue receiving the allowance. In April 1998 the government’s ‘New Deal’ or ‘Welfare to Work’ initiative took such measures further by offering wage subsidies to employers to take on the unemployed and by offering new training and education opportunities.
From April 2001 the New Deal programme was extended to cover many groups, including young people aged 18-24 years, adults over 25 years old, lone parents, the disabled, the over 50s and musicians. The greatest emphasis was on the first group, i.e. the New Deal for Young People (NDYP) to improve job search and interview skills through consultation sessions and training by approved organizations. If the person still failed to obtain work, then four options were available - they could opt for a subsidised job placement and a training allowance while being paid a wage by the employer; for fulltime education for up to 12 months; for work in the voluntary sector; or for work with the Environmental Task Force. Participation in one of the four options was mandatory in order to receive benefits and a refusal to participate led to the benefit being stopped.
From October 2009 a Flexible New Deal was introduced, which was designed to upgrade the New Deal and place greater emphasis on a stronger framework of rights and responsibilities, with more attention being placed on providing jobs that offer opportunities for progression. The Flexible New Deal is delivered for Jobcentre Plus by organizations called ‘Providers’ who help the unemployed to find work. The package includes the provision of work experience for four weeks to improve the chances of finding a permanent job. Over the period 1999-2009, it has been estimated that the New Deal structure has helped 1.8 million people into jobs and placed an extra 300,000 lone parents into work. Research by the Institute for Fiscal Studies found that NDYP increased the probability of finding a job by 20% while work by the National Institute of Economic and Social Research (NIESR) found that NDYP benefited the economy by £500m per year (Department for Work and Pensions 2008).
Perhaps the biggest change in the ‘welfare to work’ system has been the introduction of tax credits as a means of alleviating poverty and improving incentives to work. Under this system, help is given to the needy through the tax system rather than as a ‘handout’ from the benefit agencies. The Working Family Tax Credit (WFTC) system operated from 1999 to 2003 but was replaced by the Child Tax Credit (CTC) and the Working Tax Credit (WTC) in April 2003. The Child Tax Credit is paid directly by the Inland Revenue to the main carer in the family, whilst the Working Tax Credit is paid through the wage packet to working people (those with or without children).
In 2009/10, there were many types of benefits available on the WTC scheme, depending on people’s particular situations. For example, a working couple with one child could claim the basic element of £1,890 per year plus up to 80% of the costs of childcare up to a maximum limit of £175 per week. The family’s income in the previous tax year is then compared with the threshold figure of £6,420. If that income is below that threshold, then the full WTC is given, but if the income is above the threshold, then the maximum WTC is reduced by 39p for every £1 of excess income.
The CTC is paid to families with children regardless of whether the parents work. Families with incomes up to £13,910 would qualify for £545 per year in the form of a ‘family element’ of the credit, plus a ‘child element’ of £2,300 for each child. Families earning between £16,190 and £50,000 receive only the family element of the credit and this element is also gradually taken away for incomes above £50,000 until it becomes zero at £58,000.
Finally, the benefit system in the UK provides Child Benefit (CB) to all children under 16 years old and also to those under 20 years old who are in full-time education. In 2010 the benefits were £20.30 per week to the oldest child and £13.40 per week for other children.
By guaranteeing minimum incomes and adjusting take-home pay through tax credits, the new system attempts to overcome the poverty and unemployment traps illustrated in Tables 19.8 and 19.10. The new system was designed to be more generous whilst at the same time providing an incentive to work by decreasing the implicit tax rates (marginal deduction rates) discussed previously. The main problem with these various types of benefits is the ‘take-up rate’. However, figures released in 2010 showed more impressive results than for previous benefit systems in that some 81% of eligible families claimed CTC. For WTC, the take-up rate was much less, showing only a 57% take-up rate. The hope is that the WTC and CTC will, over time, build on the old WFTC which had already begun to increase incentives to work for certain groups, i.e. unemployed households and single-parent families (Blundell 2000). A recent assessment of the effects of the old WFTC shows that it also had strong employment effects on married mothers in poor households in that the childcare component of the WFTC made it more likely for mothers to remain in the workforce and/or stimulated such mothers to enter the labour market (Francesconi et al. 2009). A study carried out by the Institute for Fiscal Policy in 2001 attempted to analyse the potential effect of the new credits (WTC and CTC) and noted that the poorest 30% of families would probably gain an average of 2.7% in income as a result of the new changes. However, the report also indicated that the work incentive effect of the new credit system may not be very significant, because for people without children, entering work already increases income significantly above the welfare benefit level. In part this is because benefits currently available when such people are unemployed are relatively low (Clark and Myck 2001). This relatively weak relationship between the new CTC/WTC and incentives to work was substantiated by research undertaken over the period 2002-05 for the Joseph Rowntree Foundation. The study found that WTC made no difference to the number of hours that women in families worked and that the employment rates of lone parents or mothers in couple families were in fact lower for those receiving CTC (Chzhen and Middleton 2007). The overall incentive effects of such benefits on employment is therefore uncertain and seems to affect various groups of relatively poor people in different ways.
I Conclusion
The UK tax system is broadly proportional. Direct taxes are, as a group, progressive in the UK, taking a larger proportion of the income of richer households. Indirect taxes are, as a group, regressive, though this is not the case for all indirect taxes. VAT is broadly proportional with the exception of the top fifth of income earners. The movement towards indirect taxation has therefore made the UK tax system less progressive than it would otherwise have been. The overall tax burden measured as a percentage of GDP has fluctuated since the late 1960s and rose during the 1990s to levels experienced in the early 1980s. However, the UK is not overtaxed compared to other countries. Neither does higher tax necessarily mean lower economic growth. Certainly the empirical case for higher taxes being a disincentive to effort and output is rather flimsy, whether from questionnaire or econometric study. There can be no general presumption in favour of either indirect or direct taxation, when we assess each system in terms of macro-management, economic incentives, economic welfare and administrative costs. The dilemma of how to construct an equitable and efficient form of local taxation remains, while the complicated relationships between tax changes and social security benefits still create difficulties for those families caught in the poverty or unemployment ‘traps’. Various ‘welfare to work’ reforms are aiming to provide greater opportunities and incentives to those seeking employment.
Key points
■ Taxes on income account for around 50% of all tax receipts, with taxes on expenditure around 37%.
■ UK direct taxes are progressive while indirect taxes are regressive. Overall, the UK has a broadly proportional tax system.
■ The UK tax burden as a percentage of GDP has averaged over 35% of GDP over the past decade.
■ The UK is a middle-ranked country in terms of tax revenue as a percentage of GDP, i.e. in terms of ‘tax burden’.
■ There is no clear relationship between high income tax rates and disincentives to work. Detailed surveys show only a potentially small disincentive effect.
■ A current topic of debate is the so-called ‘flat tax’, with a single tax rate levied on all earned income.
■ The ‘poverty trap’ has improved since 1992 with implicit marginal tax rates for some households falling from 124% in 1992 to around 95% by 2009. Low hourly wages tend to worsen the poverty trap situation, though the minimum wage may help in this respect.
■ The ‘unemployment trap’ has eased slightly, with replacement rates for an unemployed married couple with two children falling from 104% in 1992 to 91% by 2009.
■ Labour market reforms, such as the Working Tax Credit (WTC) and the Child Tax Credit (CTC), and other ‘Welfare to Work’ initiatives have gone some way in helping relieve the unemployment and poverty ‘traps’.
Now try the self-check questions for this chapter on the Companion Website. You will also find useful links to relevant websites.
Notes
1 As it does in the UK, e.g. 20% on the first £37,400 of taxable income, 40% on taxable income up to £150,000 and 50% on higher income.
2 The average rate is total tax paid, divided by total income.
3 That is, that line which minimizes the sum of squared deviations from the line.
4 Note, however, that the Laffer curve strictly refers only to overall tax level, and not to that for any particular tax.
References and further reading
Alm, J. (2011) The Economics of Taxation, Cheltenham, Edward Elgar.
Benassy-Quere, A. and Coeure, B. (2010) Economic Policy, Oxford, Oxford University Press.
Blundell, R. (2000) Work incentives and ‘in work’ benefit reforms: a review, Oxford Review of Economic Policy, 16(1): 27-44.
Break, G. (1957) The effects of taxation on incentives, British Tax Review, June, 101-13.
Brown, C. (1988) Will the 1988 income tax cuts either increase work incentives or raise more revenue?, Fiscal Studies, 9(4): 93-107.
Brown, C. V. and Dawson, D. A. (1969) Personal Taxation, Incentives and Tax Reforms, Political and Economic Planning (PEP) Broadsheet 506, London, HMSO.
Child Poverty Action Group (1998) After the minimum wage: social security for working families with children, Poverty, Journal of the Child Poverty Action Group, 99, Spring.
Chzhen, Y. and Middleton, S. (2007) The Impact of Tax Credits on Mothers’ Employment, October, York, Joseph Rowntree Foundation. Clark, T. and Myck, M. (2001) Credit Where it’s Due? An Assessment of the New Tax Credits, Commentary No. 86, London, Institute for Fiscal Studies.
Crawford, M. and Dawson, D. (1982) Are rates the right tax for local government?, Lloyds Bank Review, 145( July): 15-35.
CSO (1995) Taxes and Social Security contributions: an international comparison 1981-1993, Economic Trends, 505, November.
Department for Work and Pensions (2008) Transforming Britain’s Labour Market: Ten Years of the New Deal, January, London, The Stationery Office.
Department for Work and Pensions (2009) TaxiBenefit Model Tables (April 2009), London, The Stationery Office.
Dilnot, A. W. and Kell, M. (1988) Top-rate tax cuts and incentives: some empirical evidence, Fiscal Studies, 9(4): 70-92.
Fields, D. and Stanbury, W. (1971) Income taxes and incentives to work: some additional empirical evidence, The American Economic Review, 61: 3, Part 1 (June), 435-43.
Flemming, J. and Oppenheimer, P. (1996) Are Government spending and taxes too high? National Institute Economic Review, 157(July): 58-73.
Francesconi, M., Rainer, H. and van der Klaauw, W. (2009) The effects of in-work benefit reform in Britain on couples: theory and evidence, Economic Journal, February, 66-100.
Giavazzi, F. and Blanchard, O. (2010) Macroeconomics: A European Perspective, Harlow, Financial Times/Prentice Hall.
HM Treasury (2010) Budget Report 2010, June, London.
House of Commons (1990) Low Income Statistics, Social Services Committee, Fourth Report, London.
Kay, J. and King, M. (1990) The British Tax System, Oxford, Oxford University Press.
Lyssiotou, P., Pashardes, P. and Stengos, T. (2004) Estimates of the black economy based on consumer demand approaches, Economic Journal, July, 622-40.
Messere, K., Owen, J. and Teir, G. (1982) Tax trends and impact of taxes on different income groups, The OECD Observer, 25 January.
OECD (2000) OECD in Figures, Paris, Organisation for Economic Cooperation and Development.
OECD (2010a) Economic Outlook, No. 87, Annex tables, Paris, Organisation for Economic Cooperation and Development.
OECD (2010b) Tax Database 2009, Paris, Organisation for Economic Cooperation and Development.
OECD (2010c) Taxation: Key Tables for OECD, April, Paris, Organisation for Economic Cooperation and Development.
Office for Budget Responsibility (2010) Pre-budget Forecast, June, London.
ONS (2010a) Financial Statistics, October, London, Office for National Statistics.
ONS (2010b) Statistical Bulletin: Low Pay Estimates 2009, London, Office for National Statistics.
ONS (2010c) The Effects of Taxes and Benefits on Household Income, 2008/09, London, Office for National Statistics.
Reading, B. (2005) Lombard Street Research, London.
Smith, D. (1996) Moonlighters cheat taxman out of £85bn, Sunday Times, 31 March.
More on the topic Taxation:
- The Scotland Act 2012: linking taxation and spending
- Dynamic Effects of Distortionary Taxation
- Optimal Dynamic Ramsey Taxation
- Empire and Cities: Taxation
- Systems of needs and principles of taxation
- TAX AND SPEND?
- The Provision of Public Goods: Weak Versus Strong States
- Concluding remarks
- Georgism’s Pragmatic Land Value Tax
- Government Spending, Taxes, and the Macroeconomy