Entrepreneurship and small/medium-sized enterprises (SMEs)
The small to medium-sized enterprise (SME) or firm is the subject matter of this chapter. It begins by examining the notion of ‘entrepreneurship’, given that there has been an increasing emphasis by governments across the world on developing characteristics of ‘entrepreneurial behaviour’ or ‘enterprise’ within the workforce.
Often the term ‘entrepreneurship’ is associated with business start-ups, so this chapter first reviews the term, its characteristics and measurement before examining its impact on the SME. Of course developing such workforce characteristics is arguably just as important for those working in larger organizations, and the term ‘intrapreneurship’ is often used in this context. We then outline the difficulties of finding an adequate definition for the SME itself, along with problems of measurement. Fragmentary statistical evidence is reviewed, to see whether the small firm and mediumsized firm really is becoming more important in UK employment and net output, and to compare the SME in the UK with its position in other countries. We consider the historical reasons for the neglect of the small firm, and why, in more recent times, there has been a resurgence of interest in them. Measures to help the SME are outlined, from both government and private sources. The chapter concludes with a cautionary note against placing too heavy a reliance on the small or even medium-sized firm for economic regeneration.Entrepreneurship and business start-ups
Business creation is a key driver of economic prosperity. New businesses contribute to economic growth; social enterprises enrich communities; enterprising employees revitalise organizations, all contributing to the regeneration of communities and creating a significant positive impact on both local and national economies.
As we note in Table 4.2 (p. 68) small firms resulting from new business start-ups are extremely important with around 78% of all UK businesses ‘sole traders’ with zero to one employees, a further 13% employing between two and four people, and another 5% between five and nine people.
In other words, some 96% of all UK businesses employ less than 10 people and account for some 27% of total employment and 20% of turnover. It follows that a key question is what are the entrepreneurial characteristics which help businesses to start-up and, just as important, what are the entrepreneurial characteristics needed to help establish and grow the business? The latter is particularly important given that the UK five-year survival rate for businesses ‘born’ in 2004 and still active in 2009 was only 46.8% (ONS 2010)!Role of the entrepreneur
The increased importance of small businesses has given renewed emphasis to the role of the ‘entrepreneur’, which received little attention in earlier economic analysis. Schumpeter (1934), however, did recognise the importance of the entrepreneur as an innovator, bringing about change through the introduction of new technological processes or products. Knight (1940) saw the entrepreneur as a calculated risk taker, earning profit as a reward for decision making under uncertain conditions which, by definition, cannot be insured against. Shackle (1954) saw the entrepreneur as creative and imaginative, better able than others to recognize opportunities and then exploit them.
Many of these perspectives are usefully captured in the following definition of entrepreneurship:
Entrepreneurship, rigorously defined, refers to the creation of a new economic entity centred on a novel product or service, at the very least one which differs significantly from products or services offered elsewhere in the market (Curran and Stanworth 1989, p. 12).
A better understanding of the key attributes of entrepreneurs is clearly important as there are numerous studies that point to the lack of effectiveness of government and other interventions in small business support. The Federation of Small Businesses (FSB) in the UK has conducted annual surveys of its members and these have highlighted the apparently very low levels of effectiveness of government funded business support, a view corroborated by a recent report on small firms (Richard 2008).
Entrepreneurial personality
Early work by McClelland (1961) identified the following key characteristics and competencies of successful entrepreneurs:
■ proactive - demonstrating initiative and assertiveness;
■ achievement oriented - an ability to identify opportunities and act to exploit them;
■ committed - to both the achievement of the tasks set and to the people involved.
Linking these personality traits to the views on the role of the entrepreneur mentioned above, we can perhaps add the following to Mclellands’ list of personality characteristics:
■ calculated risk taker;
■ creative;
■ innovative.
Meredith (1982) broadly concurs with this set of personality characteristics in the five he identifies as being core traits:
1 self-confidence;
2 risk taking activity;
3 flexibility;
4 need for achievement;
5 strong desire to be independent.
High self-confidence is a common theme of many analysts seeking to understand the personalities of entrepreneurs since such self-confidence helps sustain a belief in one’s own abilities to mobilize resources, motivate others and achieve change, as in new business start-ups! However, Kets de Vries (1977) also emphasizes the non-conformist, even deviant, trait often found in successful entrepreneurs.
Timmons (1994) emphasizes both a high need for achievement and a ‘high internal locus of control’ as being important to successful entrepreneurs. By ‘high internal locus of control’, Timmons meant the desire of entrepreneurs to be in charge of their own destiny. Unlike some analysts who believe entrepreneurs are ‘born’, not ‘made’, Timmons and others do recognize the role of learning and that entrepreneurs can be taught or at least given structured experiences to help them acquire important characteristics. Timmons certainly believed that many of the entrepreneurial characteristics are closely related to management and leadership skills which can be acquired via appropriate training and exposure.
However, he regarded certain attributes as more innate, such as emotional stability, creativity, conceptual thinking and a capacity to inspire.Early stage entrepreneurs
In recent years there has been an increasing emphasis by governments across the world on developing attributes of ‘entrepreneurship’ or ‘enterprise’ within the workforce. A term widely used in discussions of entrepreneurship is ‘early stage entrepreneurial activity’, which refers to the percentage of the population aged 18-64 years which is involved in starting new businesses at any one time. As we can see from Fig. 4.1, there is a wide variation across countries in this percentage, with such early-stage entrepreneurial activity seeming to be related in interesting ways to the standard of living, measured by Gross Domestic Product (GDP) per capita.
Figure 4.1 demonstrates that entrepreneurship rates are not just a function of differences in economic development (or welfare) but also other factors (as R1 is only 0.39). Examples of such factors might include population growth, which can stimulate demand and help increase the stock of existing business owner-managers, who serve as role models and who are more likely to start a business than other individuals. Eastern European countries, with falling populations and a low stock of business owner-managers as a legacy of communism, are clusters below the trend line, while Latin American countries, with healthy population growth rates and a larger stock of business owners, tend to appear above the trend line.
High-expectation entrepreneurs
In more recent times the term ‘high-expectation entrepreneurs’ has come into use. This is defined by the Global Entrepreneurship Monitor as ‘All start-ups and newly formed businesses which expect to employ at least 20 employees within five years’. Only around 14% of all start-up attempts are expected to create 20 or more jobs within the first five years, while 44% are expected to create five or more jobs.
High- growth entrepreneurs, sometimes termed ‘gazelles’, are given particular attention by national policy-makers because of the significant (and disproportionate) contribution they make to national new-job creation! Figure 4.2 shows the percentage of the working age population for different countries in such high- growth expectation business start-ups (< 42 months old) over the period 2004-2009. China has over 4% of its adult population engaged in high-growth expectation business start-ups compared to 1.5% in the US, 0.7% in the UK, and less than 0.5% in many EU economies.I Definition of the small firm
There are a number of ways of defining small and medium-sized firms.
Bolton Committee Report of 1971
This had recognised the difficulty of defining the small firm. Rather than depending solely on numbers of employees or other data, it suggested that the emphasis be placed on the characteristics which make the performance of small firms significantly different from those of large firms. Three such characteristics were identified as being of particular importance:
1 having a relatively small share of the market;
2 being managed by owners in a personal way rather than via a formalized management structure;
id="Picutre 30" class="lazyload" data-src="/files/uch_group77/uch_pgroup315/uch_uch7347/image/image027.jpg">
Fig. 4.1 Early-stage entrepreneurial activity rates and per capita GDP, 2009. Source: Bosma and Levie (2010).
3 being independent of larger enterprises, so that its owner-managers are free from outside control when taking their decisions.
The 1985 Companies Act
This was more specific and defined a company in the UK as small if it satisfied any two of the following criteria:
■ turnover of less than £2.8m;
■ net assets under £1.4m;
■ fewer than 50 employees.
The Department of Business, Innovation and Skills
This defines SMEs in terms of numbers of employees as follows:
■ micro firm (0-9 employees);
■ small firm (10-49 employees);
■ medium-sized firm (50-249 employees);
■ large firms (over 250 employees).
European Union (EU)
This definition of an SME involves four criteria, as listed in Table 4.1.
To qualify as an SME, both the employees and independence criteria must be satisfied together with either the turnover or the balance sheet criteria. An SME is defined as an ‘independent enterprise’ when the amount of capital or voting rights in that firm held by one or more non-SME firms does not exceed 25%. The values shown in Table 4.1 for turnover and balance sheet are liable to be changed over time as the
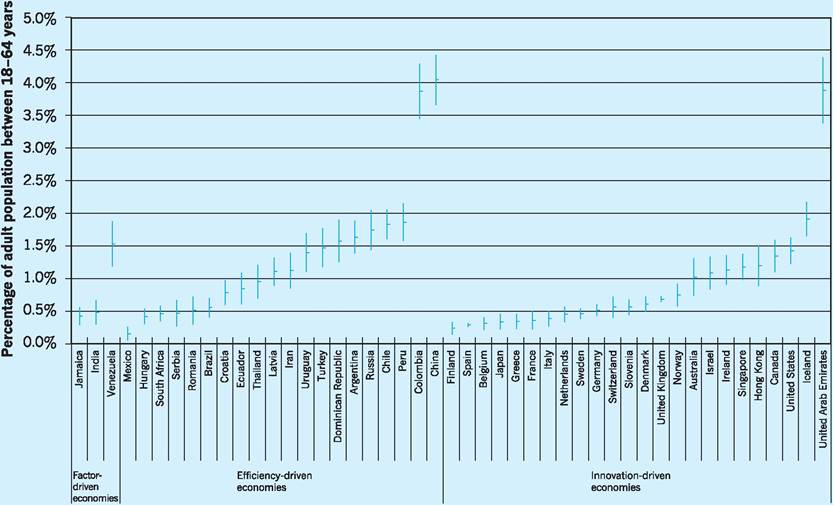
Fig. 4.2 High-growth expectation early-stage entrepreneurship (HEA), 2004/09. Source: Bosma and Levie (2010).
Table 4.1 EU definitions of micro, small and medium-sized firms.
| Micro firm | Small firm | Medium firm | |
| Turnover (A) Balance sheet total (A) Employees Independence criteria | Not exceeding 2 million Not exceeding 2 million Fewer than 10 | Not exceeding 10 million Not exceeding 10 million Fewer than 50 25% or less | Not exceeding 50 million Not exceeding 43 million Fewer than 250 25% or less |
Table 4.2 N umbers of business, employment and turnover share by size band (2009).
Share of total (%)
| Employment size band | Number of businesses | Businesses | Employment | Turnover |
| 0 or 1 | 3,832,670 | 77.8 | 14.6 | 7.9 |
| 2-4 | 629,860 | 12.8 | 6.3 | 6.0 |
| 5-9 | 240,015 | 4.9 | 5.5 | 6.2 |
| 10 -19 | 122,600 | 2.5 | 5.7 | 7.3 |
| 20-49 | 59,155 | 1.2 | 6.1 | 6.7 |
| 50-99 | 19,845 | 0.4 | 4.6 | 5.7 |
| 100 -199 | 9,165 | 0.2 | 4.3 | 5.4 |
| 200-249 | 1,840 | 0.0 | 1.4 | 2.0 |
| 250-499 | 3,765 | 0.1 | 4.3 | 8.1 |
| 500 or more | 4,405 | 0.1 | 47.3 | 44.7 |
| Total | 4,923,320 | 100.0 | 100.0 | 100.0 |
Note: ‘with no employees’ comprises sole proprietorship and partnerships comprising only self-employed owner manager(s) and companies comprising of only one employee director.
Source: Department for Business Innovation and Skills (2010b) Small and Medium Enterprise Statistics for UKand Regions, October.
absolute monetary values require adjustments because of inflation.
The importance of the small firm
Since 1995, information on the size distribution of all UK firms has been improved with the introduction of the new Inter-Departmental Business Register (IDBR).
This register keeps statistics of all businesses registered for VAT and also those businesses which operate a PAYE scheme. This means that the IDBR includes small businesses below the VAT threshold but with a PAYE system, together with those businesses trading in goods exempt from VAT but operating a PAYE system, e.g. small firms in finance, insurance and education. Of course, the IDBR does not collect information on unregistered businesses, i.e. those which do not register for VAT or operate PAYE systems. Thus, figures for activities such as sole
proprietors and partnerships have to be estimated from the Labour Force Survey (LFS) and added to the IDBR figures.
Table 4.2 shows that there were some 4,923,000 businesses in the UK in 2009. The lower employment band category of ‘0 and 1’ includes sole proprietors and partnerships comprising only self-employed owner-manager(s) and companies comprising only one employee-director. This category reflects the growth of self-employment in the UK, but while it accounts for 77.8% of the total number of businesses, it accounts for only some 14.6% of total employment and 7.9% of total turnover. Small businesses with fewer than 50 employees can be seen from the table to account for over 38% of total employment and around 34% of total turnover. If we include SMEs, i.e. businesses employing fewer than 250 employees, then such businesses account for around 48% of employment and 47% of turnover. The total number of businesses in the UK rose from 2.4 million in 1979 to over 4.9 million in 2009 and, since most of the new businesses are small, this reflects a significant growth in the small firm sector.
As we see later in the chapter, the 1980s saw a renewed interest in the role of the small firm in the UK, with a variety of policy measures directed towards its support. As a result the relative size of the small firms sector in the UK is now much closer to that in other countries than it was at the beginning of the 1980s. As Table 4.3 indicates, in 2008/09 the small (micro) firm in the UK employing fewer than 10 persons made up 95.5% of all enterprises and provided some 26.4% of all employment and 20.1% of total turnover.
While the figures for the contribution for micro enterprises were similar in the UK and the EU, it is interesting to note that SMEs as a whole tended to contribute less to employment and turnover in the UK than in the EU. The mirror image of this can be seen in the noticeably greater contribution that large firms make to employment and turnover in the UK as compared to the EU.
The neglect of small firms
Early economic theory was broadly favourable to the small firm. The theory of perfect competition had shown that in markets where many small firms produced identical products, the eventual equilibrium would be at the ‘technical optimum’, i.e. the level of output with lowest average cost. Monopoly, on the
Table 4.3 Shares of enterprises, employment and turnover: UK and EU (2008/9).
| Micro (0-9) | Small (10-49) | Medium (50-249) | Large (250+) | |
| Enterprises | bgcolor=white>||||
| UK | 95.5 | 3.7 | 0.6 | 0.2 |
| EU | 91.8 | 6.9 | 1.1 | 0.2 |
| Employment | ||||
| UK | 26.4 | 11.8 | 10.3 | 51.6 |
| EU | 29.7 | 20.7 | 17.0 | 32.6 |
| Turnover | ||||
| UK | 20.1 | 14.0 | 13.1 | 52.8 |
| EU | 18.7 | 19.2 | 19.9 | 42.2 |
Sources: Adapted from Department for Business Innovation and Skills (2010b) Small and Medium Enterprise Statistics for the UK and the Regions, October; EC (2010) Annual Report on EU Small and Medium Sized Enterprises 2009.
other hand, was regarded with suspicion, the exploitation of market power giving the opportunity for restricting output and raising prices (see Chapter 6).
The rise of limited liability and the development of the capital market had, by the end of the nineteenth century, made it easier for firms to raise finance for growth. There was also a greater awareness that increased size could secure substantial economies of scale. These developments shifted the focus of attention away from small firms and towards large firms. During the inter-war period, economic theory gave further grounds for viewing large-scale production in a more favourable light. The theory of imperfect competition developed during the 1930s showed that many small firms producing differentiated products could, as with monopoly, produce output below the technical optimum, with prices above the competitive level.
Bannock (1981) argues that after the Second World War attitudes towards large firms became still more positive, with attention being focused on the innovatory role of large firms. Particularly influential was the American economist Schumpeter, who wrote in 1943 that ‘the large-scale establishment... has come to be the most powerful engine in [economic] progress and in particular of the long-run expansion of total output’ (Bannock 1981). Price competition in traditional competitive theory was, to Schumpeter, less important than the ‘gales of creative destruction’ which replaced old products, processes and organizations with new ones. Technical progress to bring about these innovative changes would, in Schumpeter’s view, require substantial monopoly profits to fund research and development (R & D). The large sums needed to research and develop products in the aerospace, nuclear and computer industries lent weight to this argument. The fact that in the two decades after the Second World War, increasing industrial concentration coincided with the most rapid and sustained period of economic growth in the twentieth century was seen by many as supporting Schumpeter’s view.
British government policy reflected this growing preoccupation with larger size as a means of reaping economies of scale and reducing unit costs of production, so that UK products would become more competitive on world markets. For example, in 1966 the government announced the formation of the Industrial Reorganization Corporation (IRC). The White Paper inaugurating the IRC had emphasized the need for increased concentration in British industry, so that firms could benefit from economies of scale in production and increase expenditure on R & D. The IRC was set up to encourage the reorganization of UK industry, which in practice led to it promoting mergers through financial and other assistance. Although the IRC was wound up in 1971, the Industry Acts of 1972 and 1975 continued to offer financial help to industry on a selective basis in order to encourage modernization, efficiency and expansion, in particular through the activities of the National Enterprise Board (NEB). However, emphasis on increasing size as a means of achieving greater efficiency began to wane by the early 1970s, with a reawakening of interest in small firms.
The renewed interest in small firms
Empirical and other evidence began to accumulate in the late 1960s which challenged the views of Schumpeter that large firms must be the engine of economic progress.
First, it began to be felt that large firms might not always be the most innovative. Instead of large firms growing still larger by capturing new markets as a result of product and process innovation, they often grew by taking over existing firms with established products and processes. A study by Hannah and Kay (1977) had shown that virtually all the increase in concentration that occurred in the UK between 1957 and 1973 resulted from mergers between existing companies and not from internal growth.
Second, evidence began to be published which indicated that small firms were themselves beginning to play an important role in innovation. The Bolton Committee had found in its survey of important innovations between 1945 and 1970 that small firms accounted for only some 10% of these innovations, but that this was twice as high as their share of total R & D. It has been argued, therefore, that small firms use skilled manpower and research equipment more efficiently than larger firms. Similarly, in a nationwide study of 800 firms covering 1,200 innovations, Oakey et al. (1980) had found that 23% of these innovations came from single-site independent companies. In the fast-growing instrument engineering and electronic sectors, the small firms’ share of innovations was even higher. The fact that small firms had been prominent in the most dynamic, high-technology sectors suggested that they still had an important role to play as innovators. The role of small firms as innovators continued into the 1990s, as illustrated in an important report by the Cambridge University Centre for Business Research which compared the innovative nature of SMEs over the 1990-95 period. The report showed that over 20% of SMEs in their sample produced ‘original’ product innovation, i.e. innovations which were not only new to the specific firm but also new to the industry in which the firm operated (Cosh and Hughes 1996). A similar conclusion as to the ‘efficiency’ of both UK and US firms employing between 10 and 99 employees in converting innovation inputs into commercially successful outputs was also reached in recent work by the Cambridge-MIT Institute (Cosh et al. 2006).
Third, Prais (1976) produced evidence that the growth in size of firms (business units) was not, in the main, due to the growth in size of plants (production units). According to his calculations, the share of the 100 largest manufacturing plants remained at about 11% between 1930 and 1968, whilst the share of the 100 largest firms rose from about 22% to 41% in the same period. Concentration had increased because firms had built or acquired more plants, not because they had built larger ones. Put another way, Prais showed that increasing concentration was not explained by increased technical economies of scale at plant level. The small firm may therefore be able to compete with the large firm even though it produced in relatively small plants.
Fourth, evidence began to accumulate that acquisitions do not always have particularly beneficial effects on financial performance. A number of studies (Singh 1971; Meeks 1977) showed that the profitability of the combined enterprise usually fell after merger. In fact Newbold (1970) found that only 18% of all the mergers investigated could be linked in any way to technical or financial economies of scale. Again, such evidence gave grounds for optimism that the small firm may be at less of a disadvantage in terms of profitability than had earlier been thought.
Fifth, there was evidence that small firms had contributed a major part of the recorded gains in employment whilst larger firms had been shedding labour. Birch (1979), in his study of changes in employment in the USA, concluded that small firms (those with 20 or fewer employees) generated 66% of all new jobs in the US in the period 1969-76. More recent studies have tended to confirm these earlier findings. For example, the European network for research on SMEs found that small and medium-sized companies accounted for no less than 94% of the UK net employment growth over the 1987-91 period. Keeble (1997) found that between 1990 and 1995 the number of people employed by small firms in the UK rose by 19%. However, it is also important to note that net employment creation in the UK’s SME sector has been mostly generated by new, innovative, technologybased companies (TUC 2000).
Sixth, the role of small firms in foreign trade had been shown to be more significant than had previously been thought. Hannah and Kay (1977) quoted unpublished figures from a survey undertaken in 1973 by the Department of Trade. These showed that firms with a turnover of less than £10m exported 14.5% of turnover, whilst firms with a turnover of over £250m exported only 10%. By the mid-1990s, figures for exports show that the small-firm sector as a whole exported an average of 12% of their turnover, whilst small firms in manufacturing exported as much as 14% of their turnover (Keeble 1997). Such an export performance may also have been underestimated because small firms also provide ‘indirect exports’ since they supply intermediate goods for large export firms (EC 2002).
In recent years, SMEs have become more international not only for the traditional reasons of exporting and importing but also to access knowhow and/or technology and/or labour. The Internet and other new facilities for fast and easy communication and collaboration have provided opportunities for more complex international partnerships and alliances for SMEs. As a result many new SMEs in the UK and elsewhere are often ‘born global’, i.e. orientated towards internationalization from an early stage, with such developments helping small firms play new and dynamic roles in the internationalization process (EC 2003).
For all these reasons there has been a renewed interest in the small firm, which has been reflected in recent government policy.
I Measures to help small firms
Small firms: finance and allowances
An array of government financial help has been available for UK SMEs over the last 20 years, many of which have now been superseded. By early 2010 the UK government had introduced Solutions for Business which contained a streamlined portfolio of business products available for companies including SMEs. Here we look briefly at some of the more important loans available to such firms under this portfolio and then at other sources of funding, especially that of equity capital and the role of the Alternative Investment Market (AIM). Some points about other allowances and benefits will also be mentioned.
Loan capital
Enterprise Finance Guarantee (EFG)
The Enterprise Finance Guarantee (EFG) helps businesses such as SMEs who would not normally qualify to get a loan. It helps to overcome financial problems by providing lenders such as banks and other financial institutions with a government guarantee for 75% of the lender’s exposure on individual loans. The EFG supports lending to businesses with a turnover of up to £25m and enables bank facilities of between £1,000 and £1m to be available for up to 10 years. The guarantee can be used to support new loans or to refinance existing loans, or it can be used to convert an existing overdraft into a loan to meet working capital requirements. Some £1.3bn is available under this scheme.
Small Loans for Business (SLB)
Small Loans for Business (SLB) provides loans to individuals to support good business ideas that could be difficult to fund through other means. Loans can be used to secure services, purchase equipment and meet a shortfall in funding. It provides small loans of between £3,000 and £50,000 to new and growing businesses, charities and social enterprises. The main criteria is that the business can show that it has tried to obtain funding from traditional sources - bank or Building Society, for example - and been rejected for specified reasons such as a lack of security, poor credit score or insufficient track record. The scheme is funded by the government and private sector partners, and a typical lending rate would be 12.5%.
Finance for Business (FFB)
Finance for Business (FFB) provides flexible finance solutions such as loans and equity finance for businesses with viable business plans that are unable to get support from banks and other investors. It aims to increase start-ups and stimulate business growth through increased access to the right funding at the right time for businesses.
Grant for Business Investment (GBI)
Grant for Business Investment (GBI) replaced the old Selective Finance for Investment (SFI) and provides capital support for businesses wishing to create jobs and to help firms grow, modernise and branch out into new areas, especially in the Assisted Areas of England. The minimum grant is £10,000 and there is no maximum since the final amount will depend on the location and quality of the project. The maximum rate of grant for small companies located in the more deprived or assisted areas of England varies with size. For those companies with less than 50 employees, the maximum support is 35% of total eligible investment, while for medium-sized firms employing between 50 and 250 employees, the maximum grant is 25%.
European Investment Bank (EIB)
Most of the main UK high street banks have secured finance from the EIB to provide lower-cost funding to SMEs. The funding is in the form of a reduced loan cost or via a cash-back. The scheme is designed for businesses employing 250 employees or less and the loan must be for a minimum of two years and cannot be for short-term working capital needs. The key benefit of the EIB-funded loan is cheaper credit from the participating banks. For example, in 2010 Barclays indicated that cash-back payments of from £150 to £51,000 were available on capital projects ranging from £50,000 to £17m with a maximum cash-back of 2.5% on qualifying businesses.
Grant for Research and Development (GRD)
Grant for Research and Development (GRD) is designed to provide finance to individuals and SMEs to research and develop innovative technology products and processes. There are five different types of projects qualifying for funding - examples of three types will be given here. For example, a grant of up to £20,000 is available for businesses with fewer than ten employees for micro projects which involve simple low-cost development lasting no more than 12 months. Another type of grant for research projects is available to investigate the technical and commercial feasibility of innovative technology and lasts for 18 months. This grant is for up to £100,000 and is available to businesses with fewer than 50 employees. Finally, an exceptional development projects grant is available for those companies who involve themselves in significant technological advance and are strategically important for the industry as whole. For those companies who qualify, the grant is for up to £500,000 and lasts for 36 months.
Equity capital
Business Angels (BA)
These are wealthy individuals who invest in high- growth businesses in return for an equity share, i.e. an ownership share in the company. They generally invest between £10,000 and £750,000 and are not averse to high risk. The benefits of BAs are that the investment decision can be made quickly and they can bring valuable first-hand experience of working in a small business. However, they do not make investments very regularly and may not be actively looking for an opportunity, so it may be difficult for an SME seeking funding to find them, though this has become easier with the foundation of the British Business Angels Association (BBAA) in 2004. Other venture capital companies (see below) also have links with Business Angels.
Venture capitalists
These companies tend to invest larger sums of money in products or services with a unique selling point or competitive advantage - and therefore with a potential of high returns. They usually look for SMEs with talented management teams and often give active support by providing advice, guidance and opportunities. For example, in 2010 Midven, a venture capital company, was prepared to invest up to £500,000 worth of equity initially and then, depending on the success of that company, to involve itself in a further round of equity investment. The company was happy to consider different types of SME activity, e.g. start-ups, early stage growth and management buy-outs, and was particularly interested in Medical/Biotech, ICT and Software sectors, managing five funds which had invested £360m in more than 100 companies. Venture capital firms vary in size from smaller providers such as Braveheart and the YFM group, to larger entities such as Amadeus Capital Partners and the 3i Group.
Alternative Investment Market (AIM)
The Unlisted Securities Market (USM) was introduced in November 1981 to enable small and medium-sized firms to acquire venture capital on the London Stock Exchange. Its attractiveness declined in the early 1990s partly because the Stock Exchange rules regarding a full listing had been relaxed in response to changes in European Union directives. This meant that the advantages to companies of being on the USM rather than on the Official Stock Exchange List had been eroded. The USM ceased trading in December 1996.
The demand for a replacement market to the USM was evident in the early 1990s with the growth of trading under Rule 4.2 of the London Stock Exchange. This rule permitted member firms to deal in specific securities which were neither listed nor quoted on the USM. It had been formulated to provide an occasional
Table 4.4 Comparison between main stock exchange listing and AIM.
| Listing criteria | Main market | AIM |
| Minimum public float | 25% of shares in public hands | No minimum |
| Trading record | Normally three years trading record required | No trading record requirement |
| Admission documents | Pre-vetting of admission documents by the Financial Services Authority (FSA) | No pre-vetting of documents made by LSE or FSA unless a public offer of securities is made |
| Capitalization | Minimum market capitalization of £700,000 | No minimum market capitalization |
| Shareholder approval | Prior shareholder approval needed for substantial acquisitions or disposals | No prior shareholder approval for transactions (unless they are reverse takeovers or 75% disposals) |
dealing facility in unquoted companies for members of the Stock Exchange. The main benefit of trading under Rule 4.2 was that trading rules were less stringent than under the full listing or the USM.
In June 1995 the AIM was opened to meet the demand for low-cost and accessible investment funds for small and growing companies who do not need as much capital as large companies. Its trading rules are less demanding than those for a full listing on the London Stock Exchange (LSE). Some of these differences are indicated in Table 4.4.
The above differences between the main market and AIM show how the latter would be more accessible to those companies requiring small amounts of capital and relative flexibility. In 2010 the fee payable by all companies seeking initial admission to AIM varied from £6,085 to £68,750, depending on the market capitalization, while the equivalent on the main market varied from £6,085 to £352,085. The annual fees payable per company on AIM was £4,925 while for the main market the annual fee varied between £4,005 and £39,000 depending on the capitalization of the company.
By September 2010 there were 1,204 companies trading on the AIM with a market value of £65bn. The total money raised between 1995 and 2010 was £69bn and some of the companies listed on the AIM in 2010 included Majestic Wine (drinks), Carluccio’s (cafe/food), Young and Co Brewery (drinks), Straight plc (food waste disposal), Falkland Oil and Gas (gas exploration) and Millwall Holdings (football). Investors in AIM company shares vary from wealthy individuals to institutional investors such as venture capitalists. For example, in June 2010 Bridges Ventures, a venture capital company, invested £5.5m thus owning 23% of the shares in TEG Group, an AIM listed organic waste specialist. Bridges Ventures itself benefits from lower capital gains and inheritance tax rates on such investments.
The economic impact of the AIM on SMEs and smaller businesses in general was investigated by Grant Thornton, the chartered accountants, in 2010 who concluded that the market had supported some 3,100 companies since its inception. In addition, they concluded that the companies which AIM had helped to grow, having employed over 250,000 employees, contributed £12bn to GDP, and supplied £1.8bn of tax revenues to the Exchequer (Grant Thornton 2010). The ability of AIM to allow smaller companies to raise external funds at different stages of their life-cycle was identified in the report as having helped to create these impacts.
Taxation and allowances
In order to help small firms, some taxation benefits and allowances are also available. For example, in the emergency budget of June 2010 the coalition government promised to bring down taxes on companies, i.e. corporation tax, with the main rate of corporation tax for larger companies whose profits exceed £1.5m due to be reduced from 28% to 24% between 2011 and 2014. In the meantime, the corporation tax rate for small companies whose profits do not exceed £30,000 per year was to fall from 21% to 20% in the year commencing April 2011. Whilst the SME rates of corporation tax are still less than those for large companies, that gap is narrowing. Another example of benefits to SMEs revolves around Research and Development tax credits, with benefits to such companies including a 100% relief for qualifying capital costs in the year of expenditure. Also, under the Enterprise Guarantee Scheme, SMEs can spread their tax payments over longer periods thus giving them more time to pay their tax liabilities. In addition, the ‘Annual Investment Allowance’ allows companies to write off the costs of their capital assets against tax, which helps to alleviate the burden of investment in expensive plant and equipment. All these and many more such tax reliefs and allowances positively impact on the development of SMEs.
Small firms: other sources of advice and training
Up to April 2010, the Learning and Skills Council was responsible for all post-16 education and training in England other than in the universities. However, in April 2010, the Council was dissolved and two separate organizations were formed.
1 The Skills Funding Agency, working under the Department for Business, Innovation and Skills, was set up to fund and regulate adult further education and skills training in England. The agency allocates funding of around £4bn per year to colleges and other skills and training organisations who have discretion over expenditure to meet the needs of local businesses and communities. The agency also houses the National Apprenticeship Service as part of the government’s ambition to increase apprenticeships. State aid for training under a Training Aid Exemption clause allows for 45% of the cost of specific training and 80% of general training to be paid for by the state for small companies, while the figures for medium-sized companies are 45% and 70% respectively and for large firms the figures are lower at 25% and 60%.
2 The Young People’s Learning Agency is the other organization founded in April 2010 whose work includes the following: first, to fund support for some 600,000 young learners through Educational Maintenance Allowances (removed in 2011); second, to provide a stable platform and provide grants for the expansion of the ‘academies programme’ which is designed to encourage educational excellence and enhanced training; third, to fund the education and training of 1.4m young people aged 16-19 and up to the age of 25 subject to a learning difficulty assessment. The budget for these programmes for 2010-11 was £5.5bn.
The two agencies described above are not strictly designed to help only SMEs, but the businesses who take advantage of such education and training of student and apprenticeship facilities are mostly companies in that category.
Chambers of Commerce
Local and Regional Chambers of Commerce can provide SMEs with assistance in the areas of customer service, industry participation, employer/employee participation, employment growth and community support. In addition they can provide knowledge and information which can lead to cost savings and market opportunities not usually open to small companies.
Business Links
Businesslink.gov.uk is the official website and was launched in May 2004 and supplies all businesses, but especially SMEs, with information collected from 170 government websites. From April 2007 the service was delivered by Serco on behalf of HM Revenue and Customs but by 2010 the new UK coalition government was reviewing how it is to deliver business support in the future.
Small Business Service and the Enterprise Directorate
The Small Business Service began in April 2000 and was designed to act as an effective voice for small firms in government and serve as a centre for bringing knowledge about SMEs together, developing innovative approaches to suit the needs of SMEs. It also partnered other organizations within and outside government to help the small firm sector. In July 2001 the organization was renamed the ‘Enterprise Directorate’ and was located in the Department for Business, Innovation and Skills. Its remit has shifted more towards encouraging the growth of existing small businesses and somewhat away from start-up enterprises. The Directorate has a strong research and analytical function while at the same time maintaining international links especially with members in the
| Rank | Obstacle | 2007/08 % | 2006/07 % |
| 1 | The economy | 16 | 10 |
| 2 | Competition in the market | 14 | 15 |
| 3 | Taxation, VAT, PAYE, National Insurance, business rates | 12 | 12 |
| 4 | Regulations | 12 | 14 |
| 5 | Cash flow | 9 | 10 |
| 6 | Recruiting staff | 5 | 6 |
| 7 | Shortage of skills generally | 4 | 4 |
| 8 | Obtaining finance | 3 | 3 |
| 9 | Availability/cost of suitable premises | 3 | 4 |
| 10 | Shortage of managerial skills/expertise | 1 | 1 |
| No obstacles | 2 | 2 | |
| No opinion | 2 | 2 |
Source: Department for Business, Enterprise and Regulatory Reform (2009) Annual Small Business Survey 2007/8.
EU and the US. The continued need for such support was highlighted as early as 2000 in a major study of 1,000 SMEs by the Centre for Business Research of Cambridge University (Cosh and Hughes 2000). They found that less than half the firms investigated had formal structures for their management organization and less than half provided formal training within their companies.
Other useful surveys reflecting the obstacles facing SMEs include the Annual Small Business Surveys published by the government (Department for Business, Enterprise and Regulatory Reform 2009). The 2007/08 survey which interviewed 7,783 SMEs asked companies what they regarded as the greatest obstacles to progress. The results can be seen in Table 4.5 which shows that the greatest concerns were external to the firm, such as the condition of the economy, the intensity of competition, taxation, and the regulatory environment, with concern about the economy becoming more prominent in 2007/08 as the UK’s financial and economic problems deepened.
Small firms and the banks
Policy-makers have complained for many years that small firms have poor access to external finance due to a market failure in credit markets whereby lenders are imperfectly informed about the characteristics of the borrowers. As a result it is difficult for lenders, such as the banks and other financial institutions, to distinguish borrowers likely to default from those who are able to make repayments. However, since the early 1990s the relationships between borrowers and lenders have improved so that finance is not presently regarded as the main problem by SMEs. Firstly, banks have understood more clearly the nature of SME businesses and are able to assess the risk of borrowers more effectively, with the assessments of businesses relying less on judgements by bank managers and more on the quantitative evaluation of business-owner characteristics and business cashflows. Secondly, banks have played an important role in helping SMEs to find more appropriate forms of finance, notably through their leasing and invoice discounting subsidiaries. Thirdly, banks have significantly enhanced their range of small business products with the aim of gaining market share. Finally, criticisms of the banks for not making their charges transparent enough for SMEs and thereby inhibiting SMEs from switching their accounts to other banks, have acted as a catalyst for banks to make their charges more transparent.
In addition, over the past decade, SMEs themselves have also ‘learned’ to access more varied sources of external finance. However, the importance of bank finance to SMEs should not be minimized as different types of finance are required for different purposes at different times. For example, the SME Business Barometer published by the Department for Business, Innovation and Skills noted in February 2010 that the types of finance sought by SMEs in the previous six months were still strongly bank orientated, with 46% seeking bank loans; 33% bank overdrafts; 11% mortgages for property improvement; 10% monies for leasing or hire purchase; 6% loans from family and friends; and 2% each from credit card finance and various grants (Department for Business, Innovation and Skills 2010a).
As a result of the banking crises and recession conditions after 2008, the SME sector has felt the pressure of a tightening in the supply of bank credit. This, together with the deceleration in demand had, by 2010, led SMEs to cut their employment and capital investment spending by more than large companies (Bank of England 2010). The performance of the SMEs sector is therefore very closely connected with the economic and financial conditions of the period in question.
European Union policy for small firms
Within the European Commission, policies relating to small and medium-sized firms are now the responsibility of the Enterprise DG which was created in January 2000 and comprises three previous Directorate-Generals (DGs), namely Industry, SME and Information Society. Help for SMEs in the EU is provided by many agencies and it might be useful here to mention a few initiatives in this area. For example, a framework plan entitled ‘The Multinational Programme for Enterprise and Entrepreneurship 2001-06’ was designed to enhance European business in general but with special reference to SMEs. The objectives of the framework plan are pursued through a series of activities that fall under three headings. The first is to provide adequate advice, information and assistance to SMEs through 259 Euro Info Centres located in most European countries. These centres can also refer SMEs to other specialized networks or organizations when specific assistance is required. The second is to improve the financial environment for SMEs with many schemes managed by the European Investment Fund (EIF). For example, Seed Capital Action is designed to stimulate the supply of capital for the creation of innovative new businesses by partially funding the recruitment of more investment managers, whilst the European Technology Facility (ETF) start-up scheme invests in funds which provide risk capital to smaller businesses, and the SME Guarantee Facility, also managed by the EIF, provides guarantees to those financial institutions which lend to qualifying SMEs. Since 2007 the EIF has managed ‘Jeremie’, an initiative designed to give advice, equity/venture capital and guarantees to SMEs over the period 2007-13. The third objective is to identify best practice amongst SMEs by introducing benchmarking activities across the EU. The information gathered from the most efficient SMEs as a result of benchmarking is then disseminated to other SMEs.
Other funds for SMEs are available through the European Regional Development Fund (ERDF), which spends 10% of its budget on SMEs. The ERDF will have dedicated ˆ23bn to help small businesses by 2013. The European Social Fund (ESF) spends 14% of its funds on promoting a systematic approach to training by SMEs in the poorer regions of the EU. Finally, Enterprise DG has supported the development of European stock markets specifically designed to help SMEs. For example, the Nouveau Marche in Paris and the EASDAQ in Brussels specialize in helping young, relatively small companies gain access to equity funds more easily and cheaply.
Finally, it is also worth mentioning the relevance of the Competitiveness and Innovation Framework (CIP) programme which was adopted in October 2006 and runs from 2007 to 2013. This programme has a budget of over ˆ4bn, of which some ˆ1bn are designated to facilitate access to loans and equity finance for SMEs where market gaps have been identified. It is envisaged that this programme will have helped 400,000 small businesses by 2013.
I Conclusion
Renewed interest in small firms derives from changes in economic thought and has been given impetus by the particular policies pursued by the government, partly for ideological reasons, partly as a means of producing new jobs, and partly as a corollary of ‘supply side’ monetarist policies. However, there is a danger in placing too heavy an emphasis on the role of small firms in rebuilding the UK’s industrial base. Figures from the DTI have shown that 45% of VAT registered businesses failed to survive the first three years. Storey (1982) had already shown that most small firms stay static or die. In his study of all the new manufacturing firms started in Cleveland, County Durham, and Tyne and Wear from 1965 to 1978, he found that only 774 survived out of 1,200. Of the survivors, more than half still had fewer than 10 employees in 1982, and nearly three-quarters had fewer than 25. In fact, the probability of a new business employing more than 100 people after a decade was less than 0.75%. For every new job created by a small firm in these three counties over the 13-year period, four jobs were lost from large companies employing over 1,000 persons. Storey et al. (1987) found that in their survey of single-plant independent manufacturing companies in northern England, one- third of the new jobs were found in less than 4% of the new starters. Further research (Storey 1994) also showed that it is incorrect to assume that countries which have experienced the most rapid increase in new firm formation (measured in terms of increase in self-employment) are those which have experienced the fastest growth of employment creation. The same survey also pointed out that investment in government training schemes for small-company entrepreneurs at the start-up or at later stages is not necessarily related to the future success of small companies. The evidence shows that success is more closely related to the original educational attainment of the business owner. In other words, it may be more important to improve the level of the UK’s general education as a whole, if small firms are to thrive.
For all these reasons, the net advantages of small firms may be less than is commonly supposed. Nevertheless, small firms are able to find market niches, especially where economies of scale are not easily obtained, as in providing specialized items for small markets, and in developing products used as components by large firms. Also the movement towards a higher proportion of employment being in the service sector, where traditionally smaller firms have been dominant, suggests an increasingly important role for smaller firms in the UK economy. For example, a major report has shown that UK-based SMEs performed relatively well over the period 1988-2001 as compared to large companies when measured in terms of growth in real value added, employment and profitability (EC 2002). However, in absolute terms there are still major gaps between small and large firms. For example, in the European context, the value added per occupied person in SMEs was still only 83% of the EU average, compared to 128% for large firms (EC 2010).
Key points
■ Definitions of the small firm vary within and between countries.
■ Across all industrial sectors in the UK, firms with fewer than five employees account for around 91% of the total number of firms. However, such firms account for only around 21% of total employment and 14% of total turnover.
■ The small firm is increasingly seen by governments as a focus of new growth and employment opportunities.
■ Small-firm support has focused on three main areas: easier access to equity and loan capital, increased tax allowances and grants, and less government interference.
■ Banks provide the main source (59%) of external finance for small firms (via overdraft) in the UK, increasingly in the form of medium- to longer-term loans, though high exposure to such overdraft finance remains a problem in the UK.
■ Small firms in the UK see interest rate policy, general macroeconomic policy and taxation policy as the governmental policies with most impact on themselves.
■ External factors such as the condition of the economy, competition in the marketplace, taxation and regulatory control are the dominant obstacles to the business success of SMEs.
■ European policy towards SMEs is becoming increasingly influential with large- scale funds available to support a broad range of initiatives.
Now try the self-check questions for this chapter on the Companion Website. You will also find useful links to relevant websites.
References and further reading
Bank of England (2004) Finance for Small Firms - An Eleventh Report, April, London.
Bank of England (2010) Inflation Report, February, London.
Bannock, G. (1981) The Economics of Small Firms, Oxford, Blackwell.
Bannock, G. and Daly, M. (eds) (1994) Small Business Statistics, London, Paul Chapman.
Barrett, R., Cowan, E. and Mayson, S. (2010) International Handbook of Entrepreneurship and HRM, Cheltenham, Edward Elgar.
Birch, D. L. (1979) The Job Generation Process, Boston, MA, MIT Programme on Neighborhood and Regional Change.
Bosma, M. and Levie, J. (2010) Global Entrepreneurship Monitor 2009 Global Economic Report, London, Global Entrepreneurship Research Association. Competition Commission (2002) The Supply of Banking Services by Clearing Banks to Small and Medium Sized Enterprises, CM 5319, March, London.
Cosh, A. and Hughes, A. (2000) British Enterprise in Transition: Growth, Innovation and Public Policy in the Small and Medium Sized Enterprise Sector 1994-99, Cambridge, ESRC Centre for Business Research, University of Cambridge.
Cosh, A. and Hughes, A. (eds) (1996) The Changing State of British Enterprise: Growth, Innovation and Competitive Advantage in Small and Medium Sized Firms 1986-95, Cambridge, ESRC Centre for Business Research, University of Cambridge.
Cosh, A., Hughes, A. and Lester, R. K. (2006)
UK plc: Just how innovative are we? Findings from the Cambridge-MIT Institute International Innovation Benchmarking project, MIT-
IPC-06-009, Cambridge, Cambridge-MIT Institute.
Curran, J. and Stanworth, J. (1989) Education and training for enterprise: some problems of classification, evaluation, policy and research, International Small Business Journal, 7(2): 11-22. Deakins, D. and Freel, M. (2009)
Entrepreneurship and Small Firms (5th edn), Maidenhead, McGraw Hill Education.
Department for Business, Enterprise and
Regulatory Reform (2009) Annual Small Business Survey 2007/8, London, The Stationery Office.
Department for Business, Innovation and Skills (2010a) Business Barometer, February, London, The Stationery Office.
Department for Business, Innovation and Skills (2010b) Small and Medium Enterprise Statistics for UK and Regions, October, London, The Stationery Office.
Department of Trade and Industry (1999) Small and Medium-sized Enterprises (SME) Statistics for the United Kingdom 1998, Small Firms Statistical Unit, July, London, The Stationery Office.
EC (2002) Observatory of European SMEs 2002/No. 2, Brussels, European Commission.
EC (2003) Internationalisation of SMEs, Observatory of European SMEs 2003, No. 4, Brussels, European Commission.
EC (2010) Annual Report on EU Small and Medium Sized Enterprises 2009, Brussels, European Commission.
Gilbert, C. and Eyring, M. (2010) Beating the odds when you launch a new venture, Harvard Business Review, 88(5): 92-100.
Grant Thornton (2010) Economic impact of AIM and the role of fiscal incentives, September, London.
Hannah, L. and Kay, J. A. (1977) Concentration in Modern Industry, Basingstoke, Macmillan. Keeble, D. (1997) Small firms, innovation and regional development in Britain in the 1990s, Regional Studies, 31(3): 281-93.
Kelley, D. J., Bosma, N. and Amoros, J. E.
(2011) Global Entrepreneurship Monitor 2010 Global Report, London, Global Entrepreneurship Research Association.
Kets de Vries, M. (1977) The entrepreneurial personality: a person at the crossroads, Journal of Management Studies, 14(1): 34-57.
Knight, F. (1940) ‘What is truth’ in economics? On the history and method of economics, Journal of Political Economy, 48: 1-32.
Lenihan, H., Andreosso-O5Callaghan, B. and Hart, M. (2010) SMEs in a Globalised World, Cheltenham, Edward Elgar.
McClelland, D. C. (1961) The Achieving Society, New York, Van Nostrand.
Meeks, G. (1977) Disappointing Marriage: a study of the gains from merger, University of Cambridge, Department of Applied Economics, Occasional Paper 51, Cambridge, Cambridge University Press.
Meredith, G. G., Nelson, R. E. and Neck, P. A. (1982) The Practice of Entrepreneurship, Geneva, International Labour Organization.
Newbold, A. (1970) Management and Merger Activity, Liverpool, Guthstead.
Oakey, R. P., Thwaites, A. T. and Nash, P. A. (1980) The regional distribution of innovative manufacturing establishments in Britain, Regional Studies, 14(3): 235-53.
ONS (2010) Statistical Bulletin: Business Demography 2009 Enterprise Births, Deaths and Survival, London, Office for National Statistics.
Prais, S. J. (1976) The Evolution of Giant Firms in Britain, Cambridge, Cambridge University Press.
Reynolds, P. D., Storey, D. J. and Westhead, P. (2007) Cross-national comparisons of the variation in new firm formation rates, Regional Studies, 41(Supplement No.1): S123-36. Richard, D. (2008) Small Business & Government: The Richard Report, Submission to the Shadow Cabinet, London, Conservative Party.
Schumpeter, J. (1934) The Theory of Economic Development, Cambridge MA, Harvard University Press.
Shackle, G. (1954) Uncertainty in Economics and Other Reflections, Cambridge, Cambridge University Press.
Singh, A. (1971) Takeovers, Cambridge, Cambridge University Press.
Small Business Service (2002) Small and Medium-Sized Enterprises (SME) Statistics for the UK, 2000, London, The Stationery Office.
Small Business Service (2006) Annual Survey of Small Businesses: UK 2004/05, March, London, The Stationery Office.
Storey, D. (1982) Entrepreneurship and the New Firm, London, Croom Helm.
Storey, D. (1994) Understanding the Small Business Sector, London, Routledge.
Storey, D., Keasey, K., Watson, R. and Wynarczyk, P. (1987) The Performance of Small Firms, London, Croom Helm.
Timmons, J. A. (1994) New Venture Creation: Entrepreneurship for the 21st Century (4th edn), Chicago IL, Irwin.
TUC (2000) Small Business - Myths and Reality, March, London, Trades Union Congress.
Ucbasaran, D., Westhead, P. and Wright, M. (2006) Habitual Entrepreneurs, Aldershot, Edward Elgar.
More on the topic Entrepreneurship and small/medium-sized enterprises (SMEs):
- Abdullah A.G., Widiaty I., Abdullah G.U. (eds.). Global Competitiveness: Business Transformation in the Digital Era. Routledge,2019. — 325 p., 2019
- Table of contents