The Macroeconomic Model
The macroeconomic model uses twelve variables. In the choice of variables was also considered which variables have a direct impact in possible banks’ losses. The variables used are19 Real GDP (yMe), Cete interest rate (rc), the consumer price index (π), real exchange rate (e), unemployment rate (u), the Mexican stock exchange index (ipc), loan portfolio (TL), and past due loans (PDL), US GDP (yUS), treasury bill interest rate (rtb), the Dow Jones stock index (DJ), and the Brazilian stock index Bovespa20 (bov).
P 3
The general form of the model is a customary VAR setting: Yt = c∑AYt i + ∑δmDmt + et which
i=1 m=1
basically states that the set of variables in the 12x1 vector Y is jointly determined by p lagged values and dummy variables for each quarter21 (Dn). This model follows the spirit of structural VAR models, hence not all variables enter as explanatory variables (that is, some components of matrices Ai are zero).
However, the structural constraints were tried to be kept at a minimum, hence all domestic variables (GDP, cete rate, exchange rate, unemployment rate, inflation, stock index, loans, and past due loans) interact with each other; additionally, all domestic variables are affected by foreign variables, but foreign variables only are affected by other foreign variables.
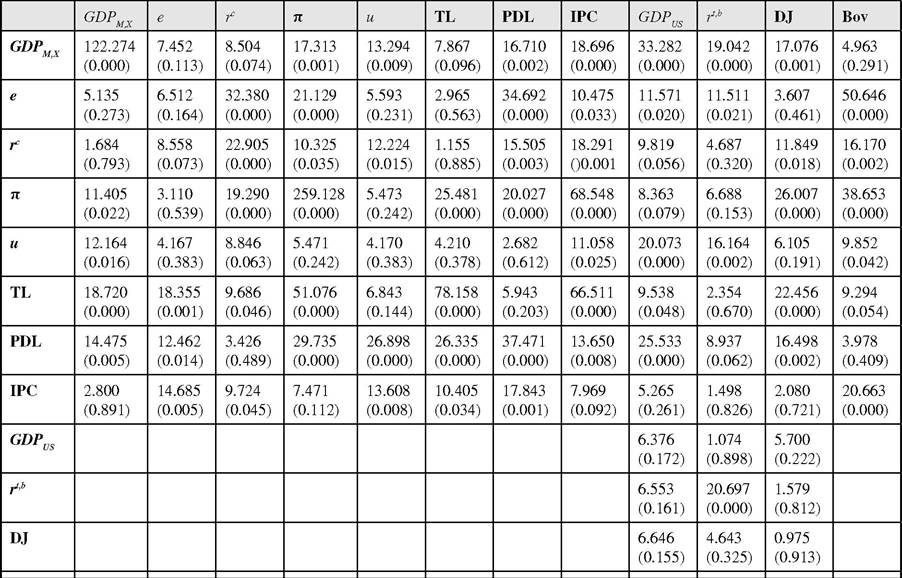
Quarterly data from the second quarter of 1985 up to June of 2011 was used, and p=4, that is, the number of lags used was 4 quarters. For the estimation it was assumed that the errors were normally distributed, e~N(0,Σ), where Σ is the covariance matrix between the shocks. Coefficients were estimated using Maximum Likelihood24. Table 2 shows the joint significance χ2 test statistic for all the lags of a variable.
Table 2. Estimation results: Columns=dependent variables; Rows= independent variables
The impulse response functions were computed when a one standard deviations shock occurs. It was decided to show the responses of only the most relevant variables: Figures 16, 17, 18, 19, 20, 21, show the impulse response functions of such variables. The subtitles within each graph indicate the impulse variable.
2.