THE ROLE OF EBITDA IN CREDIT ANALYSIS
The dialogue between Phil Atlee and his niece shows that similar companies with similar net income can have substantially different total enterprise values.
Much in the same way, companies with similar interest coverage can have substantially different default risk. In credit analysis, as in valuing businesses, EBITDA can discriminate among companies that look similar when judged in terms of EBIT. Consider the fictitious examples of Rock Solid Corporation and Hollowman, Inc. (Exhibit 8.3).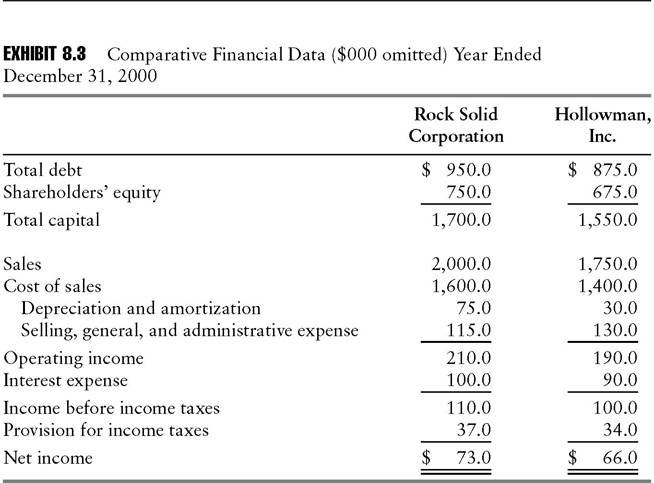
Measured by conventional fixed charge coverage (Chapter 13), the two companies look equally risky, with ratios of 2.10X and 2.11X, respectively:
Fixed Charge Coverage
Net Income + Income Taxes + Interest Expense
Interest Expense
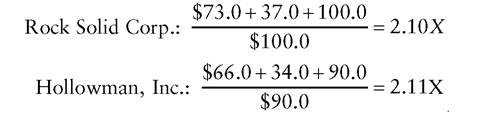
(For convenience of exposition, we shall refer to this standard credit measure as the EBIT-based coverage ratio. Note that for some companies, the sum of net income, income taxes, and interest expense is not equivalent to EBIT, reflecting the presence of such factors as extraordinary items and minority interest below the pretax income line.)
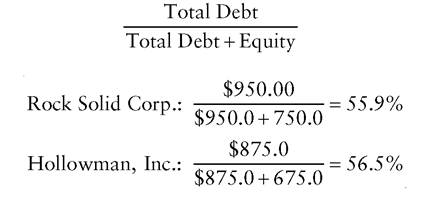
As it happens, Hollowman and Rock Solid are almost perfectly matched on financial leverage, another standard measure of credit risk. (For a discussion of calculating the total-debt-to-total-capital ratio in more complex cases, see Chapter 13.)
Total-Debt-to-Total-Capital Ratio
By these criteria, lending to Hollowman, Inc.
is as safe a proposition as lending to Rock Solid Corp. Bringing EBITDA into the analysis, however, reveals that Rock Solid is better able to keep up its interest payments in the event of a business downturn.In the current year, Rock Solid’s gross profit—sales less cost of goods sold—is $400 million. Suppose that through a combination of reduced
EXHIBIT 8.4 Statements of Income ($000 omitted) Year Ended December 31, 2001
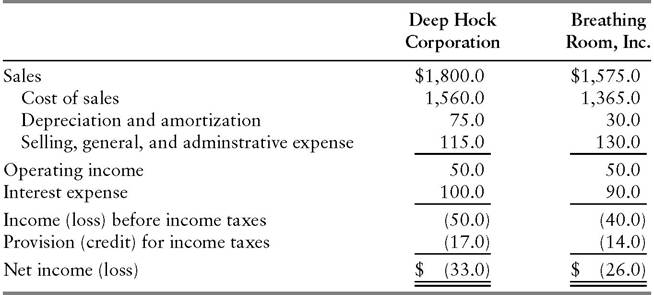
revenue and margin deterioration, the figure drops by 40% to $240 million, while other operating expenses remain constant (Exhibit 8.4). Operating income now totals only $50 million, just half of the $100 million interest expense. Fixed charge coverage falls to 0.50X from the previously calculated 2.10X.
Is Rock Solid truly unable to pay the interest on its debt? No, because the $75.0 million of depreciation and amortization charged against income is an accounting entry, rather than a current-year outlay of cash. Adding back these noncash charges shows that the company keeps its head above water, covering its interest by a margin of 1.25X:
EBITDA Coverage of Interest
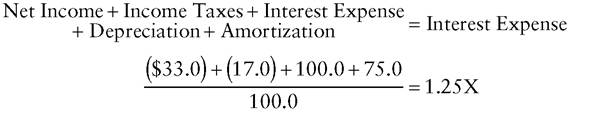
By contrast, if Hollowman’s gross profit falls by 40%, as also shown in Exhibit 8.4, its interest coverage is below 1.0 times, even on an EBITDA basis:
![]()
Rock Solid can sustain a larger decline in gross margin than Hollowman can before it will cease to generate sufficient cash to pay its interest in full.
The reason is that noncash depreciation charges represent a larger portion of Rock Solid’s total operating expenses—4.2% of $1.790 billion, versus 1.9% of $1.560 billion for Hollowman (Exhibit 8.3). This difference, in turn, indicates that Rock Solid’s business is more capital-intensive than Hollowman’s. Further examination of the companies’ financial statements would probably show Rock Solid to have a larger percentage of total assets concentrated in property, plant, and equipment.In summary, conventionally measured fixed charge coverage is nearly identical for the two companies, yet they differ significantly in their probability of defaulting on interest payments. Taking EBITDA into account enables analysts to discriminate between the two similar-looking credit risks. This is a second major reason for the ratio’s popularity, along with its usefulness in ensuring comparability of companies with dissimilar depreciation policies, when estimating the total enterprise values.