Answers to Analyzing Data 14.1 Questions
1. To draw each isocline, we first need to solve for the population sizes of species 1 and 2 when the other is at zero. For species 1, we use Equation 14.2 and find that N1 = 0 when N2 = K1∕α or N2 = 42.5/0.43 = 98.8.
For species 2, we use Equation 14.3 and find that N2 = 0 when N1 = K2∕β or N1 = 53.2/0.72 = 73.9.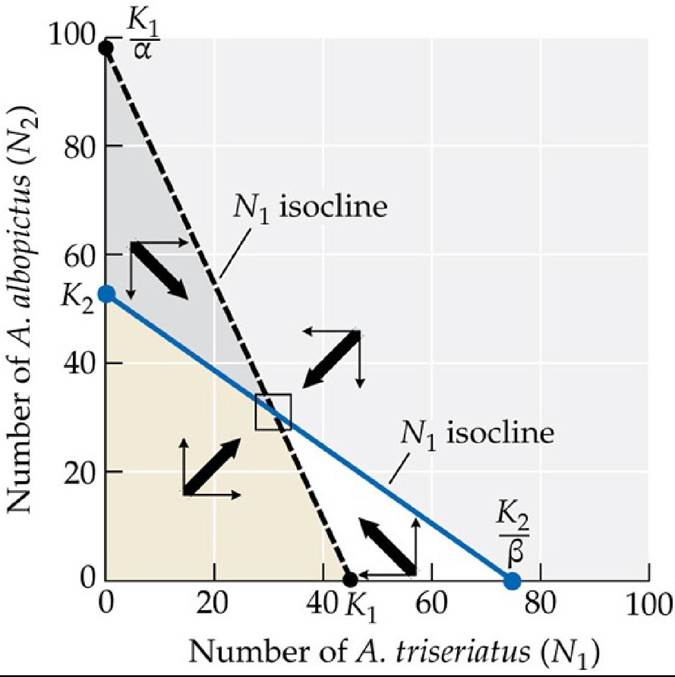
Graphing these two isoclines, we find that in tree holes, the likely outcome of competition is that the two species will coexist. The equilibrium population density for A. triseriatus (species 1) is 28.3, and the equilibrium population density for A. albopictus (species 2) is 32.8; these densities can be estimated from the graph or calculated algebraically by setting the N1 and N2 isoclines equal to one another.
2. To draw each isocline, we first need to solve for the population sizes of species 1 and 2 when the other is at zero. For species 1, we use Equation 14.2 and find that N1 = 0 when N2 = K1∕α or N2 = 33.4/0.84 = 39.8. For species 2, we use Equation 14.3 and find that N2 = 0 when N1 = K2/ β or N1 = 44.7/0.25 = 178.8.
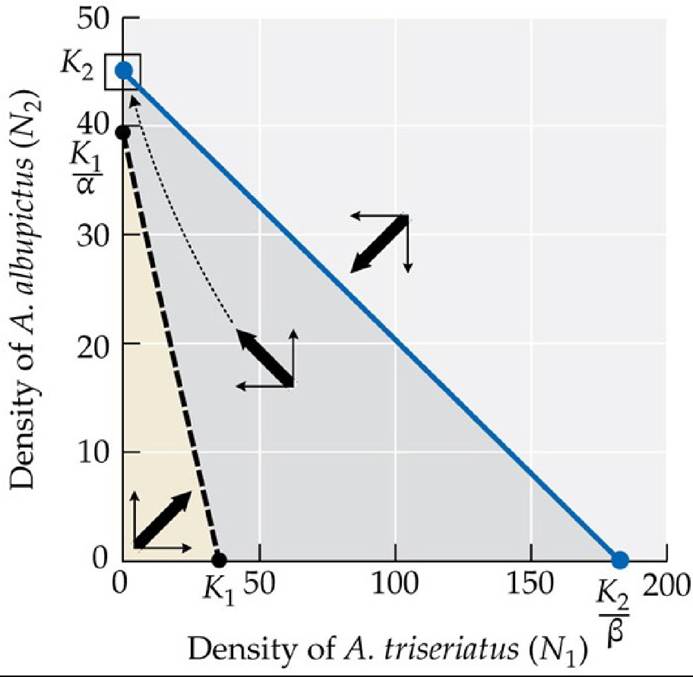
In tires, the likely outcome of competition is that A. albopictus (species 2) will drive the native species A. triseriatus (species 1) to extinction. The equilibrium population density for A. triseriatus (species 1) is zero, and the equilibrium population density for A. albopictus (species 2) equals K2 = 44.7; these densities can be estimated from the graph.
3. In tree hole communities, the two species are predicted to coexist, whereas in tires, the introduced species is predicted to drive the native species to extinction. Hence, it is unlikely that competition with the native species, A. triseriatus, will prevent the spread of the introduced mosquito, A. albopictus.