Answers to Hone Your Problem-Solving Skills Questions
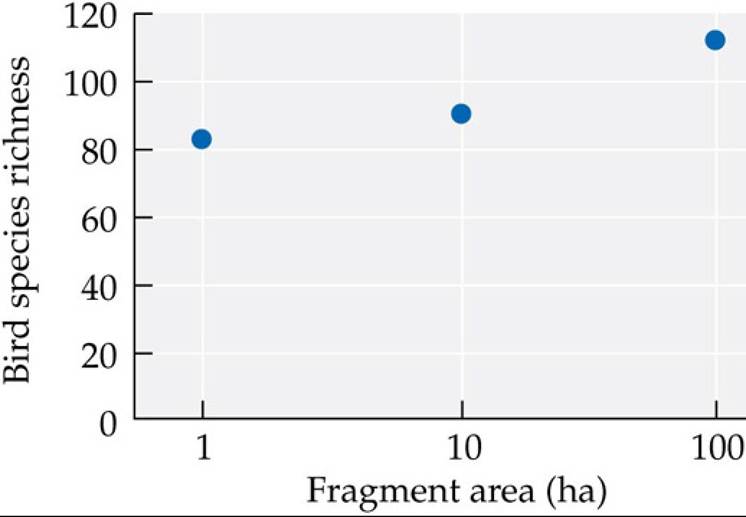
1. Yes, the data follow the species-area relationship.
2. The percentage loss of species per year can be calculated using the t50 scaling factor.
Divide the percentage loss (50%) by the number of years to reach that loss to get the percentage loss of species per year. Thus,1 hectare: 50%∕5 years = 10% species loss per year
10 ha: 50%∕8 years = 6.25% species loss per year
100 ha: 50%∕12 years = 4.17% species loss per year
The 1 ha fragments have the greatest species loss, and the 100 ha fragments have the least.
3. The number of species in the fragments 9 years after the start of the experiment can be calculated using the following equation: initial species number - (initial number of species ? percentage species loss per year ? 9 years). Thus,
1 ha: 83 species - (83 species ? 10% loss per year ? 9 years) = 8 species
10 ha: 92 species - (92 species ? 6.25% loss per year ? 9 years) = 40 species
100 ha: 113 species - (113 species ? 4.17% loss per year ? 9 years) = 71 species
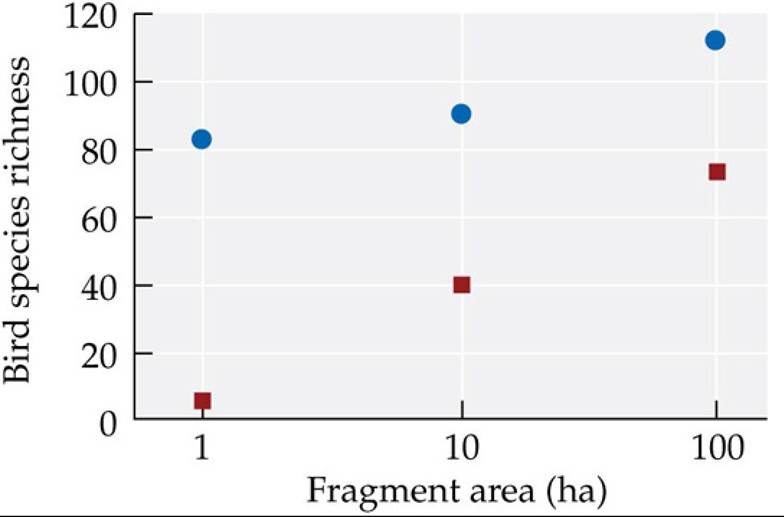
4. The fragments that had 9 years of isolation would have the steepest species-area slope. Once fragmentation occurs, the fragments act more like islands. Thus, the smallest fragments had greater species loss than the largest fragments because they had higher extinction rates and lower immigration rates. In addition, the smaller the fragment, the greater percentage of edge habitat, which is more hazardous for species, and thus extinction risk increases even more.
More on the topic Answers to Hone Your Problem-Solving Skills Questions:
- Reviewers
- Leveraging Lawyers' Strengths and Training Them to Support Team Problem-Solving Under Crisis Conditions
- REPHRASING
- IMPLICATIONS FOR UNDERSTANDING AND MANAGING CONFLICT
- EDUCATION
- REVIEW OF FORENSIC ASSESSMENT INSTRUMENTS
- IMPLICATIONS FOR TRAINING
- When Crisis Comes to the Newsroom
- CONCEPTS OF LANGUAGE, PEACE, AND CONFLICT RESOLUTION