Aggregation: The Adjusted Headcount Ratio
The aggregation step of our methodology builds upon the FGT class of unidimensional poverty measures and likewise generates a parametric class of measures. This section elaborates the Adjusted Headcount Ratio; the other measures in the AF class are presented in section 5.7.
Just as each FGT measure can be viewed as the mean of an appropriate vector built from the original data and censored using the poverty line, the Adjusted Headcount Ratio, denoted as M0 (X; z), is the mean of the censored deprivation score vector: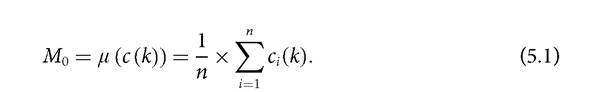
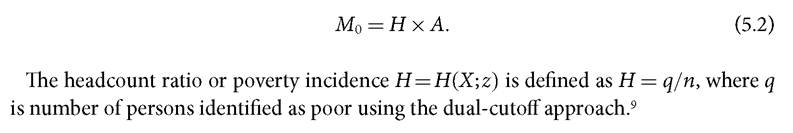
A second way of viewing M0 is in terms of partial indices—measures that provide basic information on a single aspect of poverty. The Adjusted Headcount Ratio, can also be written as the product of two partial indices. The first partial index H is the percentage of the population that is poor or the multidimensional headcount ratio or the incidence of poverty. The second index A is the intensity of poverty, then:
8This example has an identical relative weight across dimensions; the general case admits a wide variety of identification approaches. For example, if one dimension had overriding importance and its relative weight was set above or equal to k, then any person deprived in that dimension would be considered poor.
9While informative, this measure is insufficient as a stand-alone index for two reasons. First, if a poor person becomes deprived in a new dimension, H remains unchanged, violating the property of dimensional monotonicity. Second, H cannot be further broken down to show how much each dimension contributes to poverty.
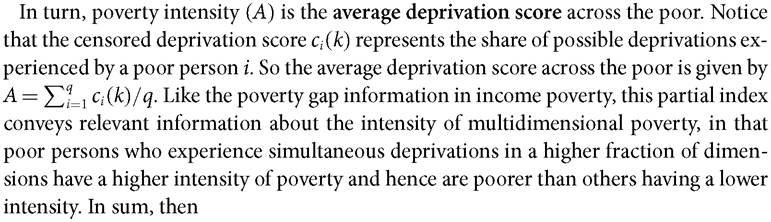
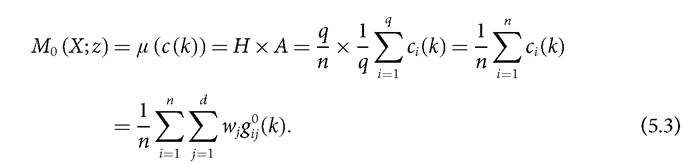
As a simple product of the two partial indices H and A, the measure M0 is sensitive to the incidence and the intensity of multidimensional poverty.
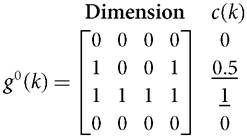
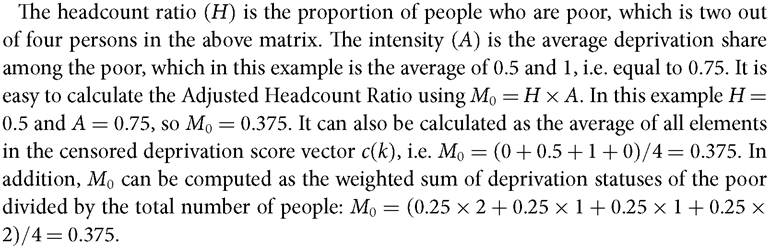
It clearly satisfies dimensional monotonicity, since if a poor person becomes deprived in an additional dimension, then A rises and so does Mo. Another interpretation of M0 is that it provides the share of weighted deprivations experienced by the poor divided by the maximum possible deprivations that could be experienced if all people were poor and were deprived in all dimensions.Let us provide an example using the same censored deprivation matrix and the censored deprivation score vector as in Box 5.2.
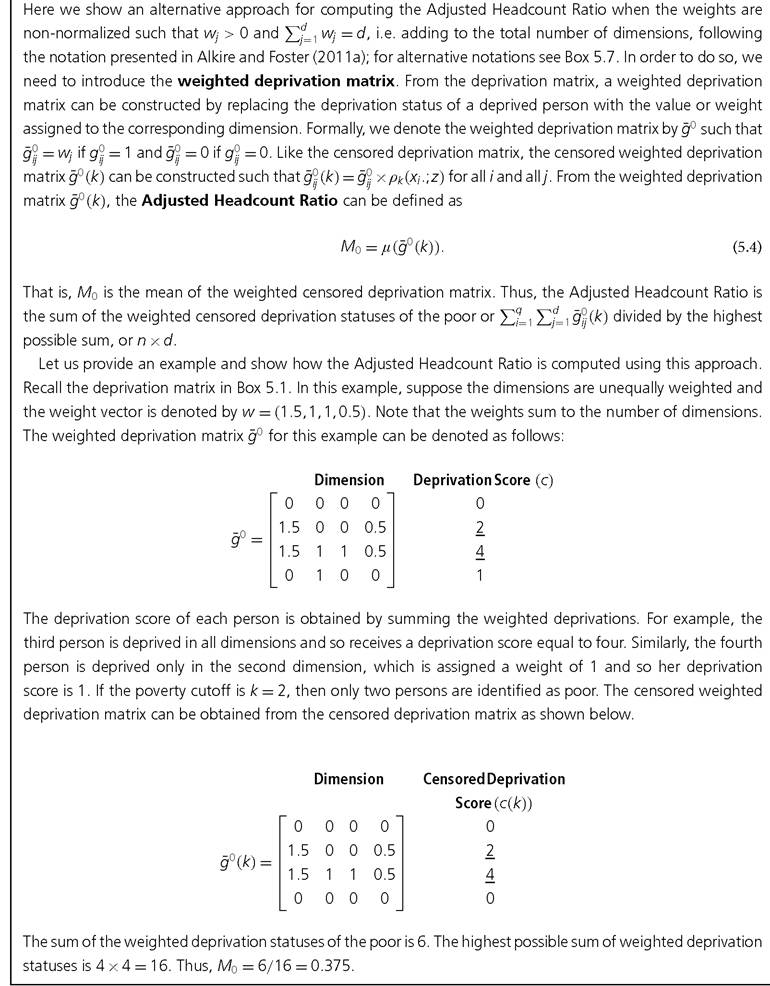
BOX 5.3 AN ALTERNATIVE PRESENTATION OF THE ADJUSTED HEADCOUNT RATIO USING NON-NORMALIZED WEIGHTS
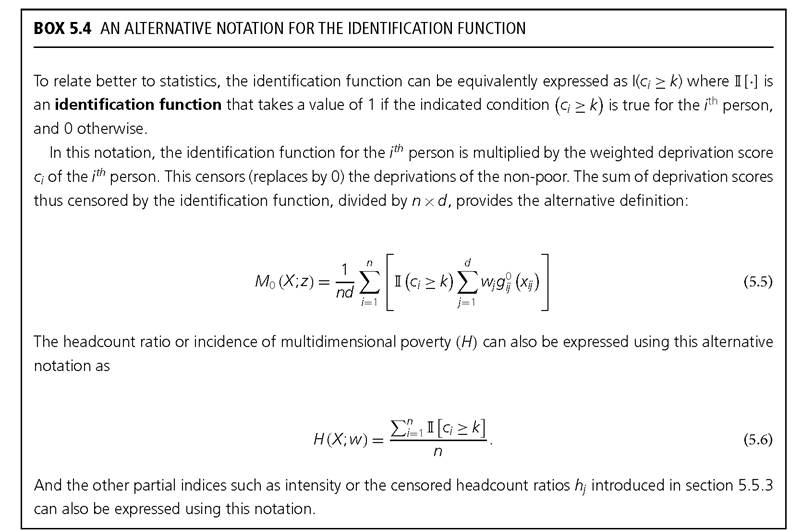
5.4