Chapter 5 Main Results
Considering the aim of this paper and starting from the performance matrices, there are some different “possible” solutions corresponding to the scenarios, the roles ascribed to the key criteria (overeducation and mismatching) and two years corresponding to two post-graduation placement sampling surveys carried out in a pre-crisis period (2006) and during a crisis period (2011).
The weights and thresholds associated with each criterion are shown in Table 5.1. In the Neutral scenario, the alternatives are measured in the same way; in the University scenario, the alternatives linked to the university characteristics weighed more than others; in the Job scenario, a relevant importance is given to Job characteristics. The same weight is always attributed to overeducation and mismatching.
The veto, preference and indifference thresholds are chosen considering the performance matrix in order to obtain a sufficient level of discrimination among the
Table 5.1 Weights, direction, indifference, preference and veto thresholds per scenario
| g1 | bgcolor=white>g2g3 | g4 | g5 | g6 | g7 | g8 | g9 | g10 | ||
| Direction | D | G | D | G | G | G | G | G | D | D |
| Weight Scenario N | 0.1 | 0.1 | 0.1 | 0.1 | 0.1 | 0.1 | 0.1 | 0.1 | 0.1 | 0.1 |
| Weight Scenario U | 0.13 | 0.13 | 0.13 | 0.13 | 0.08 | 0.08 | 0.08 | 0.08 | 0.08 | 0.08 |
| Weight Scenario J | 0.08 | 0.08 | 0.08 | 0.08 | 0.13 | 0.13 | 0.13 | 0.13 | 0.08 | 0.08 |
| Indifference threshold (q) | 5 | 2 | 0.01 | 0.5 | 5 | 100 | 5 | 5 | 5 | 5 |
| Preference threshold (s) | 15 | 4 | 0.02 | 1 | 15 | 200 | 15 | 15 | 15 | 15 |
| Veto threshold (v) | 25 | 6 | 0.04 | 2 | 25 | 300 | 25 | 25 | 25 | 25 |
g1: percentage of graduates who have not received classical or scientific high-school education; g2: mean graduation grade; g3: effective length of the study period in years; g4: parental background; g5: percentage of full-time employed; g6: average monthly net income; g7: percentage of employed having decisional autonomy; gg: percentage of employed reporting Job responsibility over other employees; g9: percentage of overeducated; g10: percentage of mismatched © Springer Nature Switzerland AG 2020
R.
Allegro and O. Giambalvo, University Performance Before and During EconomicCrises, UNIPA Springer Series, https://doi.org/10.1007/978-3-030-36142-6_5
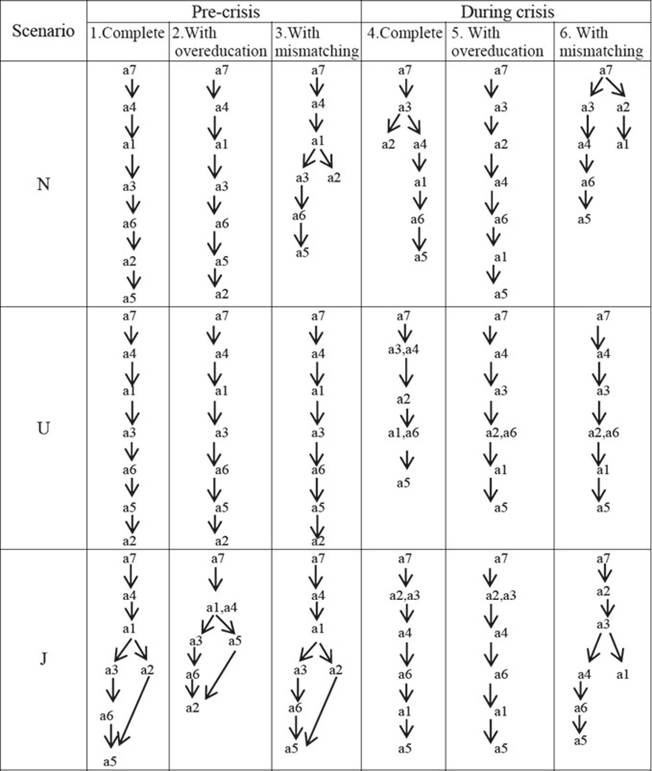
Fig. 5.1 University rankings for different scenarios, configurations and periods. Full data set
alternatives. The aggregated concordance matrix and the outranking indices of credibility, which are useful for final ordering, are presented in Appendices A and B. By establishing a discrimination threshold 1s,(δ) = 0.15, the complete final order results for each scenario analysed for the complete data set; the results are summarized in the following Fig. 5.1.
Scenario N
In this scenario, the final rankings differ, showing that mismatching and overeducation play a crucial role in the rankings in the pre-crisis period and during the crisis period.
Pre-crisis period (N1-N3):
- The positions of universities a7, a4 and a1 universities at the bottom do not change even if overeducation and mismatching are included or excluded;
- Overeducation is negative for a2 (a2 is the university with the highest percentage of overeducation, see Table 4.2a): if it is included in the model, a2 is in the last position and a5 outranks a2 (N2). Otherwise a5 is in the last position (N1 and N3);
- Considering the mismatching criterion (N3), a2 is in the last position but cannot be compared with either a3 (but they are in the same position) or a6 and a5.
During crisis period (N4-N6):
- a5 is always in the last position; on the contrary, a3 rose two positions;
- a1 loses positions. It became the last university, in the same position as a4 but incomparable with the latter if only mismatching is included in the model (N6); if only overeducation is considered (N5), a1 loses positions and it outranks only a5;
- In the N4 model, a4 and a2 are in third position but incomparable.
If mismatching is included (N6), a2 and a1 (outranked by a7 in first position) cannot be compared with other universities;- With mismatching, a2 rises to second position outranked by a7 (N6); with overeducation, it loses some positions (N5). a2 is the university with the lowest percentage of mismatching (see Table 4.2b).
During crisis period versus pre-crisis period:
- a5 is in second-to-last position only in the N2 model. Even if only overeducation is included, during the economic crisis it is in the last position (N5). a5 shows a high percentage of overeducation (see Table 4.2b). These results are consistent with the results of the performance matrix;
- a3 rises two positions. With mismatching only, a3 is not comparable to a2 (in the same position) and to a1 (N6). In the pre-crisis period, a1 outranks a3 (N3);
- In scenario N5 where the model we have only overeducation and no mismatching, during crisis period a6 occupies the same position as in the pre-crisis period but, while in the pre-crisis period a6 outranks a5 and a2, during the crisis period a6 outranks a1 and a5 (N2, N5). During crisis period, a2 shows the lowest percentage of overeducation, while in the pre-crisis period the same percentage for a2 is the highest (Table 4.2a, b). With mismatching, a6 is in second-to-last position, in the pre-crisis period and during the crisis period, but while in the pre-crisis period a6 is incomparable only with a2, during the crisis period it is not comparable with a1 either (N3-N6);
- The economic crisis worsens a1 rankings: a1 loses many positions if overeducation is included (N5 vs. N2, during the crisis period, a1 shows the highest percentage of overeducation, while in the pre-crisis period this percentage is lower; see Table 4.2a, b).
It only gains a number of positions when the mismatching criterion is included; however, during the crisis period, it is comparable only with α7 and α2 that outranked it (N6).Scenario U
Both overeducation and mismatching are important but only during the crisis period.
Pre-crisis period (U1-U3):
- There are no differences between including or excluding key criteria;
- α5 university in this analysis is in second-to-last position, and α2 in the last position;
- The model produces the same graph configuration as in N2 scenario.
During crisis period (U4-U6):
- a2 gains a number of positions to the disadvantage of a1, a6 and of a5, obviously;
- In the U4 model, the ranking shows that a3 and a4 are in the same class (second position). Even a1 and a6 are in the same class, but in the second-to-last position;
- If only one of the key criteria is included, the model produces the same graph configuration: a4 outranks a3, a2 and a6 are in the same class (fourth position) and a1 is in second-to-last position (U5, U6).
During crisis period versus pre-crisis period:
- a1 university loses two positions; during the crisis period, in fact, the percentage of many criteria worsens (see Table 4.2a, b);
- a2 rises a number of positions to third, outranking a1, a6 and a5;
- If the key criteria are included in the model, a3 reaches a4 in the second position (U4 vs. U1); but, if only one criterion is included, a3 outranks a1 while remaining outranked by a7 and a4 (U5, U6);
- The same applies for a1 and a6 (a6 reaches a1, U4 vs. U1), while if only one criterion is included a6 outranks a1 and is in the same class as a2 that loses one position (U5 and U6);
- The effect of the economic crisis is quite evident for University a5 that occupies the last position.
Scenario J
Pre-crisis period (J1-J3):
- The J1 and J3 graphs show the same ranking;
- a5 is second-to-last only if overeducation is included;
- With overeducation, University a5 outranks only a2 and is incomparable with a3 and α6 (J2). Only a2 shows a percentage of overeducation that is higher than that of a5 (see Table 4.2a);
- a1 and a4 are in the same class including only overeducation (J2), while a4 outranks a1 in the J1 or J3 configuration.
During crisis period (J4-J6):
- a1 is in second-to-last position if overeducation is included in the model and outranks a5 (J4-J5); if mismatching is included, it is in the fourth and last position of its path, and incomparable with a4, a6 and a5 (J6);
- The rank order of a6 worsens if only mismatching is included in the model (J6) probably because a6 shows the highest percentage of mismatching (see Table 4.2b);
- With mismatching, a2 outranks a3 (J6) while in the other configurations they appear paired. In this context, the percentage of mismatching of a3 is higher than that of a2 (see Table 4.2b).
During crisis period versus pre-crisis period:
- During the crisis period, a2 rises in ranking occupying the second position, considering both the key criteria (J4, J5, J6);
- On the contrary, the position of a4 worsens (J4, J5, J6); this is also true for a1 (with overeducation, its own rank order changes, becoming second-to-last, (J5));
- a5 is outranked by a2 before the crisis when mismatching is included (J3); during the crisis period, a2 is always in second position and a5 in the last position (J4, J5, J6).
During crisis period, with mismatching or overeducation:
- When only mismatching is included in the model, the graph changes.
In this case, a1 becomes last in its path and is not comparable with a4 a6 and a5 (J6);- When only mismatching is included, a6 loses one position (J6).
The six models for each scenario analysed for the Economics and Statistics graduates data set are summarized in the following Fig. 5.2.
Scenario N
In this scenario, for the Economics and Statistics graduates, the final rankings differ, showing that key criteria play a crucial role in pre-crisis period and during crisis period.
Pre-crisis period (N1-N3):
- a5, always being last in the previous models, improves its position. It becomes second, in the same position as a1, but not comparable with it, and it is outranked only by a4 and a7 that are both in first position;
- The last position is occupied by a6;
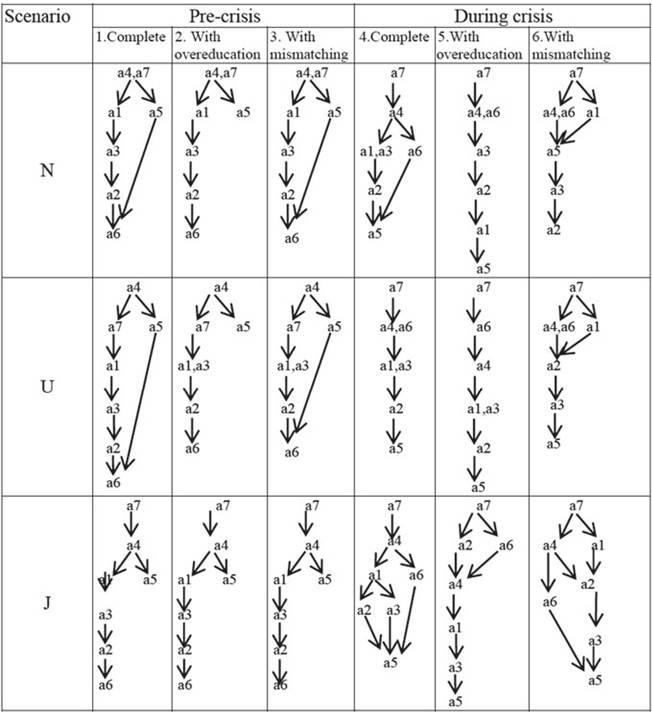
Fig. 5.2 University rankings for different scenarios, configurations and periods. Economics and Statistics graduates data set (ES)
- If only overeducation is included, α5 becomes incomparable with others but remains second (N2). In the model where only mismatching is included, α5 outranks α6 (N3).
During crisis period (N4-N6):
- α7 returns to first position, alone;
- α5 returns to last position, at least when overeducation is included (N4-N5);
- α2 suffers mismatching (becoming last when this key criterion is included alone, N6);
- a1, when overeducation is alone, outranks only α5 (N5);
- a6, in third position in the complete configuration, becomes second in the same class and comparable with α4, if overeducation and mismatching are alternatively included in model.
During crisis period versus pre-crisis period:
- α4 loses one position;
- a1 does not always outrank α3. On the contrary, when overeducation is considered alone in the model, α3 outranks a1 (N5). In the pre-crisis period, the percentage of overeducation is higher in α3 with respect to a1, with a gap of 3% points while, during the crisis period, the same percentage is higher in a1 and the gap is 20% higher (Table 4.3a, b);
- α6, in the last position during the pre-crisis period, becomes second during the economic crisis, if overeducation and mismatching are alternatively included in the model (N5-N6) and third in the complete model (N4);
- α2 is stable in the pre- or during the crisis period even if, when mismatching is included alone, it occupies the last position.
Scenario U
The six models produce different configurations.
Pre-crisis period (U1-U3):
- The difference between including or excluding overeducation or mismatching criteria is that α5, in the first case, is second after α4, in the same position as α7 but incomparable with it and the others; in the second case, when only mismatching is considered, α5 is comparable and outranks α6;
- a6 in this configuration is the last university;
- a1 outranks α3 in the complete configuration. When overeducation or mismatching is included alone, they are in the same class.
During crisis period (U4-U6):
- α7 returns to first position;
- a6 gains many positions, becoming second, alone, when only overeducation is included in the model. Otherwise, it is in the same class as α4;
- a2 suffers from overeducation. In fact, in U5 it is second-to-last. For the same reason, α3 suffers from mismatching (in U6 it is second-to-last).
During crisis period versus pre-crisis period:
- α4 and α7 exchange the first position;
- α6 and α5 do the same but in the last positions of the ranking;
- during the economic crisis, α4 loses a position if overeducation is considered (U5);
- a1 also suffers from the overeducation phenomenon, becoming forth if it is considered alone (U5, in a1, the percentage of overeducation during the crisis period is higher) and second if only mismatching is included.
During crisis period, with mismatching or overeducation:
- If key criteria are alternatively included in the model (U5, U6), α6 is always second;
- Mismatching is important for α1 If it is included in the model without overeducation (the percentage of overeducation in a1 is higher with respect to other universities, Table 4.3b), a1 becomes second (U6);
- α2 suffers from overeducation (U5), while in the model with only mismatching it is third (U6).
Scenario J
Pre-crisis period (J1-J3): all three models produce the same results.
- University a7 is first and a4 is second;
- a5 is in third position, but it doesn’t outrank any other university;
- a6 is the last university.
During crisis period (J4-J6): The paths produce different results:
- a5 returns to last position, substituting a6;
- a4, with overeducation, loses the second position (the percentage of overeducation during the crisis period is higher with respect to the same percentage observed in the pre-crisis period, Table 4.3a, b);
- a1 and a6 are in the same position in the complete model but are incomparable. If mismatching is considered alone, a1 is second, incomparable with a4 and a6 (J6). If only overeducation is included, a6 is second and outranks a4, a1, a3 and a5 (J5);
- In the model with overeducation, a2 is incomparable with a6 and outranks a4 (J5); in the model including mismatching, the contrary appears, a4 outranks a2 (J6).
During crisis period versus pre-crisis period:
- a6 and a5 exchange the last position;
- During the crisis period and irrespective of whether mismatching or overeducation is considered, a2 gains many positions.
During crisis period, with mismatching or overeducation:
- In the model, when only overeducation is considered, a2 improves its place becoming second (the percentage of mismatching for this university is high, Table 4.3b, with respect to the same percentage observed for almost all other universities; thus, the exclusion of mismatching improves the model); on the contrary, aι worsens its position (J5).
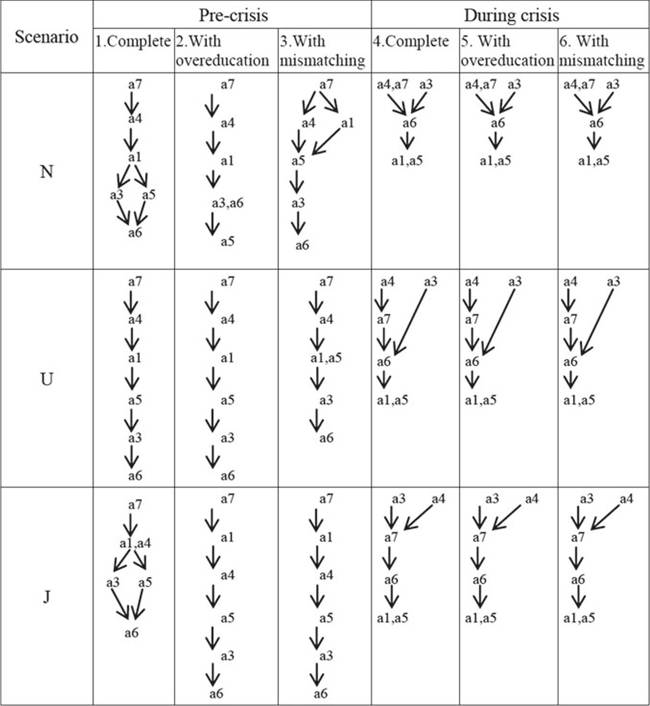
Fig. 5.3 University rankings for different scenarios, configurations and periods. Political and Social Science graduates data set (PSS)
University a2 is not included in the analysis of Political and Social Science graduates because of lack of graduates.
The six models for each scenario analysed for the Political and Social Science graduates data set are summarized in the following Fig. 5.3.
Rankings change between the pre-crisis and during crisis period, but are stable during the crisis period mainly, if overeducation and mismatching are included alone in the model.
Scenario N
Pre-crisis period (N1-N3):
- a7 is first, alone;
- α5, is in the last positions if only overeducation is considered; the percentage of overeducation for this university is high (Table 4.4a) with respect to the same percentage observed for almost all other universities;
- a3 and α5 in the complete model are in the same position, but not comparable; in the model stressing the overeducation indicator, a3 outranks α5; in the model stressing the mismatching indicator, α5 outranks a3.
During crisis period (N4-N6):
- All three models produce the same results:
- a7 is first but sharing the position with a4 (also in the same class) and with a3 but they are incomparable;
- The last position is shared by a5 and a1.
During crisis period versus pre-crisis period:
- a4 gains one position, and a3 gains more than one position (the percentage observed in relation to many criteria is better during the crisis period than precrisis period; see Table 4.4a, b);
- a5 returns to last position;
- a6 that was last in the pre-crisis period (N1-N3) or second-to-last (N2) during crisis period occupied a central position;
- a3 and a5 that were linked in an outranking relationship (N2, N3) or in the same position in the pre-crisis period (N1) are not directly linked during the crisis period.
Scenario U
The six models produce three different configurations. Two in the pre-crisis period and one during the crisis period;
Pre-crisis period (U1-U3):
- a7 is first while a6 is last;
- The model with overeducation only produces the same results than the complete model;
- If only mismatching is included, a5 is in the same class and comparable with a1 .
During crisis period (U4-U6):
- a7 loses the first position, becoming second. At the top of the ranking, we observe that a3 and a4 share the position but are incomparable;
- a5 returns to the last position in the same class with a1;
- The models are stable if key criteria are included alone in the model.
During crisis period versus pre-crisis period:
- a1 and a5 worsen their positions [the percentage observed in relation to many criteria is better during the pre-crisis period compared to the during crisis period (Table 4.4a, b)];
- α3 improves its position, passing from second to last to first;
- Even a6 slightly improves its position.
Scenario J
Pre-crisisperiod (J1-J3): The three models produce two different results according to the key criteria.
- α7 is first while a6 is last;
- a5 outranks a3 and a6 when the model stresses the presence, alternatively, of overeducation or mismatching (J2, J3);
- a3 and a5 in the complete model are incomparable but in the same position (J1).
During crisis period (J4-J6): The paths are equal if overeducation or mismatching is included.
- a5 returns to last position, in the same class with a1 [the percentage observed in relation to many criteria is better during the pre-crisis compared to the during crisis period (Table 4.4a, b)];
- a7 loses its first position, becoming second;
- a3 and a4 become first but are incomparable.
During crisis period versus pre-crisis period:
- During the crisis period, irrespective of whether mismatching or overeducation is considered, a3 gains many positions.