Chronic Multidimensional Poverty
Panel datasets provide information on precisely the same individual or household at different periods of time. Good-quality panel datasets are particularly rich and useful for analysing multidimensional poverty because their analysis provides policy-relevant insights that extend what time series data provide.
For example, using panel data we can distinguish the deprivations experienced by the chronically poor from those experienced by the transitory poor and thus identify the combination of deprivations that trap people in long-term multidimensional poverty. Also, we can analyse the duration over which a person was deprived in each indicator—and the sequences by which their deprivation profile evolved. As section 9.3.1 showed, we can identify precisely the contributions to poverty reduction that were generated by changes in entries and exits from poverty and by the ongoing poor.The following section very briefly presents a counting-based class of chronic multidimensional poverty measures that use a triple-cutoff method of identifying who is poor. We give prominence here to the measure that can be estimated using ordinal data. The consistent sub-indices associated with the chronic multidimensional poverty methodology include the headcount ratio and intensity, as well as new indices related to the duration of poverty and dimensional deprivation. We also present a linked measure of transient poverty. As in other sections, we presume that interested readers will master standard empirical and statistical techniques that are appropriate for studies using panel data, and apply these in the analyses of poverty transitions and chronic poverty here described.
The closing section on poverty transitions informally sketches revealing analyses that can be undertaken without generating a chronic poverty measure. People are identified as multidimensionally poor or non-poor in each period, then population subgroups are identified that have differing sequences of multidimensional poverty.
For example, one group might include non-poor people who ‘fell’ into multidimensional poverty, a second might include multidimensionally poor people who ‘rose’ out of poverty, a third might contain those who were poor in all periods, and a fourth might contain those who ‘churned’ in and out of poverty across periods. Naturally the number of ‘dynamic subgroups’ depends upon the sample design, the number of waves of data, and the precise definition of each group.9.4.1 CHRONIC POVERTY MEASUREMENT USING PANEL DATA
Multiple approaches to measuring chronic poverty in one dimension exist, many of which have implications for the measurement of chronic multidimensional poverty.[239] Alongside important qualitative work, multiple methodologies for measuring chronic multidimensional poverty have also been proposed.[240] This section combines the AF methodology with the counting-based approach to chronic poverty measurement proposed in Foster (2009), which has a dual-cutoff identification structure and aggregation method that are very similar to the AF method. Foster (2009) provides a methodology for measuring unidimensional chronic poverty in which each time period t is equally weighted for all at t = 1,..., T. An n ? T matrix is constructed in which each entry takes a value of one if person i is identified as poor in period t and a value of 0 otherwise. A n-dimensional ‘count' vector is constructed in which each entry shows the number of periods in which person i was poor. A second time cutoff τ is applied such that each person is identified as chronically poor if he or she has been poor in τ or more periods. Associated FGT indices and partial indices are then constructed from the relevant censored matrices.
9.4.1.1 OrderofAggregation
This combined chronic multidimensional poverty measure applies three sets of cutoffs: deprivation cutoffs zj, a multidimensional poverty cutoff k, and a duration cutoff τ. It is possible to analyse multidimensional poverty using panel data by combining the AF methodology and the Foster (2009) chronic poverty methods using either one of two different orders of aggregation, which we call chronic deprivation and chronic poverty.
These alternatives effectively interchange the order in which the poverty and duration cutoffs are applied. In both cases, we first apply a fixed set of deprivation cutoffs to the achievement matrix in each period.In the chronic deprivation option (τ before k), we first consider the duration of deprivation in each indicator for each person and then compute a multidimensional poverty measure which summarizes only those deprivations that have been experienced by the same person across τ or, more periods. This approach aggregates all ‘chronic' deprivations into a multidimensional poverty index, regardless of the period in which those deprivations were experienced. This approach would provide complementary information that could enrich analyses of multidimensional poverty, but cannot be broken down by time period, nor does it show whether the deprivations were experienced simultaneously (Alkire, Apablaza, Chakravarty, and Yalonetzky 2014).
In the chronic multidimensional poverty option (k before τ), we first identify each person as multidimensionally poor or non-poor in each period using the poverty cutoff k. We then count the periods in which each person experienced multidimensional poverty. We identify as chronically multidimensionally poor those persons who have experienced multidimensional poverty in τ or more periods.
9.4.1.2 Deprivation matrices
We observe achievements across d dimensions for a set of n individuals at T different time points. Let xj stand for the achievement in attribute j of person i in period t, where xj ≥ 0 ∀i,j, t. Let Xt denote an n ? d matrix whose elements reflect the dimensional achievements of the population in period t. The deprivation cutoff vector zj is fixed across
periods. As before, a person is deprived with respect to deprivation j in periods t if xtij< Zj and non-deprived otherwise. By applying the deprivation cutoffs to the achievement matrix for each period, we can construct the period-specific deprivation matrices gj.
For simplicity, this section uses the non-normalized or numbered weights notation across dimensions, such that 1 Wj = d. Time periods are equally weighted. Whenachievement data are cardinal we can also construct normalized gap matrices gj and squared gap matrices gj or, more generally, powered matrices of normalized deprivation gaps gα't where α ≥ 0. In a similar manner as previously, we generate the n-dimensional ct column vector, which reflects the weighted sum of deprivations person i experiences in periods t.
9.4.1.3 Identification
To identify who is chronically multidimensionally poor we first construct an identification matrix. The same matrix can be used to identify the transient poor in each period and to create subgroups of those who exhibit distinct patterns of multidimensional poverty (for analysis of poverty transitions).
Identification Matrix Let Q (k) be an n ? T identification matrix whose typical element Qit(k) is 1 if person i is identified as multidimensionally poor in period t using the AF methodology, that is, using a poverty cutoff k, which is fixed across periods, and 0 otherwise.
The typical column Qt(k) reflects the identification status ρti (k) for the ith person in period t, whereas the typical row Qi. (k) displays the periods in which person i has been identified as multidimensionally poor (signified by an entry of 1) or non-poor (0). Thus we might equivalently consider each column of Q(k) to be an identification column vector for period t such that ρti (k) = 1, if and only if person i is multidimensionally poor in period t according to the deprivation cutoffs Zj, weights Wj, and poverty cutoff k; and ρti (k) = 0 otherwise.
Episodes of Poverty Count Vector ei From the Q(k) matrix we construct the n-dimensional column vector e(k) whose ith element ei (k) = ∑jL 1 Qit(k) sums the elements of the corresponding row vector of Q(k) and provides the total number of periods in which person i is poor, or the total episodes of poverty, as identified by poverty cutoff k.
Naturally, 0 ≤ ei (k) ≤ T, that is, each person may have from 0 episodes of poverty to T episodes, the latter indicating that a person was poor in each of the t periods.Chronic Multidimensional Poverty: Identification and Censoring We apply the duration cutoff τ where 0 < τ ≤ T to the ei (k) vector in order identify the status of each person as chronically multidimensionally poor or not. We identify a person to be chronically multidimensionally poor if ei (k) ≥ τ, that is, if they have experienced τ
9.4.1.4 Aggregation
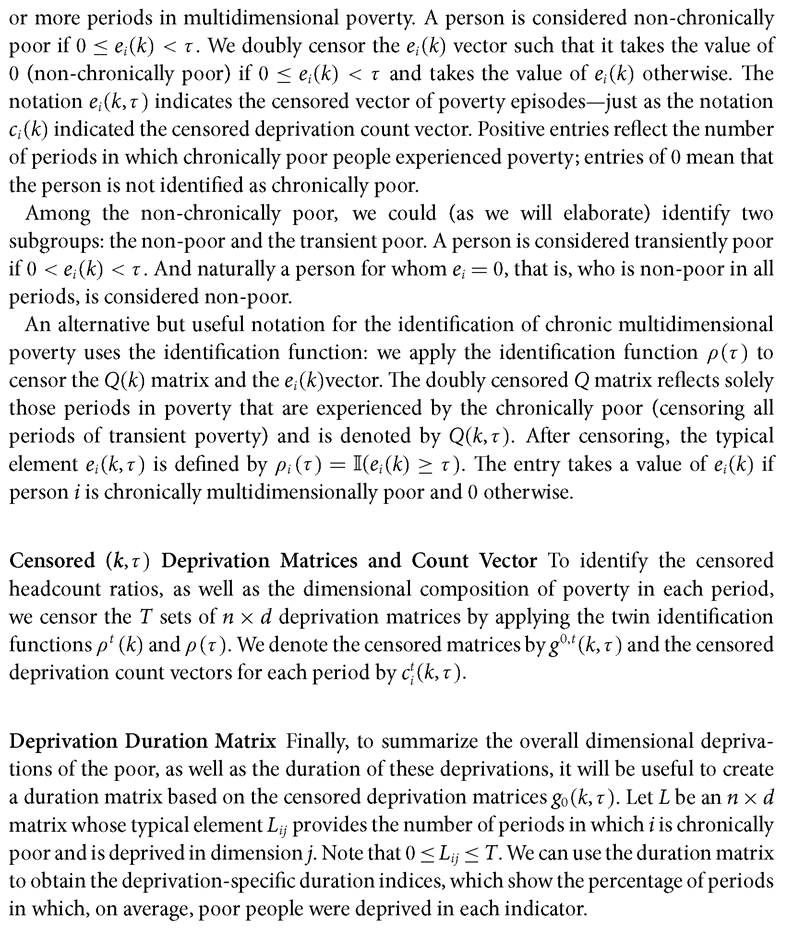
The measure of chronic multidimensional poverty when some data are ordinal may be written as follows: 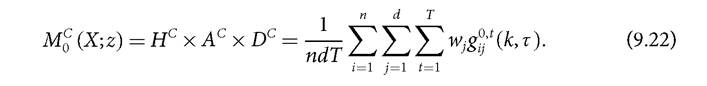
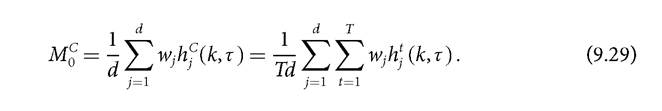
Thus the Adjusted Headcount Ratio of chronic multidimensional poverty is the mean of the set of T deprivation matrices (g0't(k,τ)) that have been censored of all deprivations of persons who are not chronically multidimensionally poor. Alternative notation for this measure can be found in Alkire, Apablaza, Chakravarty, and Yalonetzky (2014).
When data are cardinal, the M'C class of measures are, like the AF class, the means of the respective powered matrices of normalized gaps.
9.4.2 PROPERTIES
For chronic multidimensional poverty, as for multidimensional poverty, the specification of axioms is, in some cases, a joint restriction on the (triple-cutoff) identification and aggregation strategies and, hence, on the overall poverty methodology. The properties are now defined with respect to the chronically multidimensionally poor population. The class of measures present respects the key properties that were highlighted as providing policy relevance and practicality to the AF measures, such as subgroup consistency and decomposability, dimensional monotonicity, dimensional breakdown, and ordinality.
In addition, this class of measures satisfies a form of time monotonicity as highlighted in Foster (2009) in the unidimensional case. The intuition is that if a person who is chronically poor becomes poor in an additional period, poverty rises.A full definition of the properties that this chronic multidimensional poverty measure fulfils is provided in Alkire, Apablaza, Chakravarty, and Yalonetzky (2014). The methodology of multidimensional chronic poverty measurement fulfils the appropriately stated properties of anonymity, time anonymity, population replication invariance, chronic poverty focus, time focus, chronic normalization, chronic dimensional monotonicity, chronic weak monotonicity, time monotonicity, chronic monotonicity in thresholds, monotonicity in multidimensional poverty identifier, chronic duration monotonicity, chronic weak transfer, non-increasing chronic poverty under association-decreasing switch, and additive subgroup decomposability for all α ≥ 0. The class of measures also satisfies chronic strong monotonicity for α > 0 and chronic strong transfer when α ≥ 1.
9.4.3 CONSISTENT SUB-INDICES
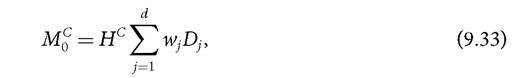
Like M0, the chronic multidimensional poverty measure (M^) is the product of intuitive partial indices that convey meaningful information on different features of a society's experience of chronic multidimensional poverty. In particular, M% (X; z) = Hc ? Ac ? Dc where:
• Hc is the headcount ratio of chronic multidimensional poverty—the percentage of the population who are chronically multidimensionally poor according to k and τ.
• Ac is the average intensity of poverty among the chronically multidimensionally poor—the average share of weighted deprivations that chronically poor people experience in those periods in which they are multidimensionally poor.
• Dc reflects the average duration of poverty among the chronically poor—the average share of T periods in which they experience multidimensional poverty.
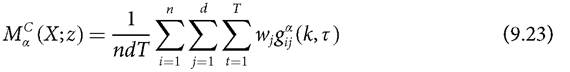
These partial indices can also be calculated directly. In particular,
That is, the headcount ratio of chronic multidimensional poverty is the number of people who have been identified as chronically multidimensionally poor divided by the total population. We denote the number of chronically multidimensionally poor people by qc.
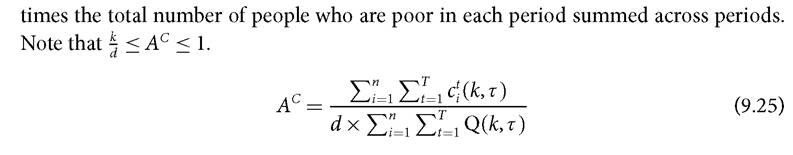
The intensity of chronic multidimensional poverty is the sum of the weighted deprivation scores of all poor people over all time periods, divided by the number of dimensions
The average duration of chronic multidimensional poverty—the percentage of periods on average in which the chronically poor person was poor—can be easily assessed using the e(k. τ) vector.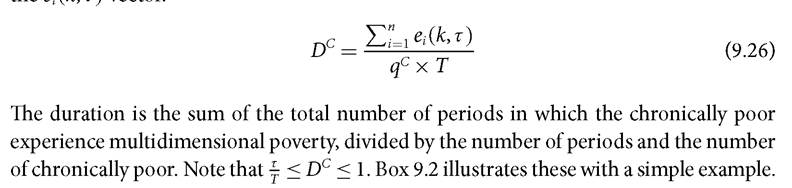
BOX 9.2 COMPUTING THE INCIDENCE AND DURATION OF CHRONIC POVERTY
Consider three people and four periods, with τ = 2.
Person 1 is multidimensionally poor in period 1
Person 2 is multidimensionally poor in periods 2, 3, and 4
Person 3 is multidimensionally poor in periods 1,2,3, and 4 Two people are chronically poor because they experience multidimensional poverty in τ = 2 or more periods. So the percentage of people identified as chronically poor Hc is 67%.
In this case, the vector e =(0,3,4), qc = 2, and our duration index is (3+4) = 7 = 87.5%. That is, on average,
2 ?4 8
chronically poor persons are poor during 87.5% of the time periods.
9.4.3.1 Dimensional Indices
For chronic multidimensional poverty, it is possible and useful to generate the standard dimensional indicators for each period: the censored headcount ratio and percentage contribution. It is also possible and useful to generate the period-specific Adjusted Headcount Ratio (M0), headcount ratio (H), and intensity (A) figures, which are different from, but can be consistently related to, the chronic poverty headcount and intensity values presented in section 9.4.3. Finally, and of tremendous use, it is possible to present the average duration of deprivation in each dimension and to relate this directly to the overall duration of chronic poverty. Box 9.3 presents the intuition of this set of consistent indices; for their precise definition see Alkire, Apablaza, Chakravarty, and Yalonetzky (2014).
BOX 9.3 SINGLE- AND CROSS-PERIOD INDICES OF CHRONIC POVERTY
Cross-period indices reflecting chronic poverty:
M0C: Adjusted Headcount Ratio of chronic multidimensional poverty
Hc : Headcount ratio, showing the percentage of the population who are chronically poor
Ac : Intensity, showing the average percentage of deprivations experienced by the chronically multidi- mensionally poor in those periods in which they are poor
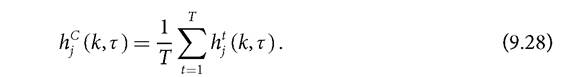
Dc : Average duration of chronic poverty, expressed as a percentage of time periods hj(k, τ): Average censored headcount of dimension j among the chronically poor in all periods in which they are poor and are deprived in dimension j
Dj: Average duration of deprivation in dimension j among the chronically poor, expressed as a percentage of time periods
φC (k, A): Percentage contribution of dimension j to the deprivations of the chronically poor.
Single-period indices reflecting the profiles of the chronic poor in that particular period of poverty:
Ht: Headcount ratio, showing the percentage of the population who are chronically poor in period t
At: Intensity, showing the average percentage of deprivations experienced by the chronically multidi- mensionally poor in period t
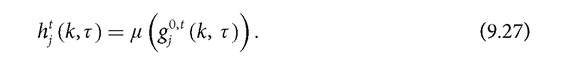
hj(k, τ): Censored headcount of dimension j among the chronically poor in period t
φjt (k, τ): Percentage contribution of dimension j to the deprivations of the chronically poor in period t.
Cross-period averages of the unidimensional indices can also be constructed, such as H,A and hj(k, τ), and analysed in conjunction with the relevant duration measure.
9.4.3.2 Censored Headcount Ratios
The censored headcount ratios for each period t are constructed as the mean of the dimensional column vector for each period and represent the proportion of people who are chronically poor in time period t and are deprived in dimension j:
We can also describe the average censored headcount ratios of chronic multidimensional poverty across T periods in each dimension as simply the mean of the censored headcount ratios in each period:
The Adjusted Headcount Ratio of chronic multidimensional poverty across all periods is simply the mean of the average weighted censored headcount ratios:
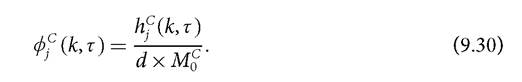
9.4.3.3 Percentage Contributions of Dimension
The percentage contributions show the (weighted) composition of chronic multidimensional poverty in each period and across periods.
We may seek an overview of the dimensional composition of poverty across all periods. The total percentage contribution of each dimension to chronic poverty across all periods is given by
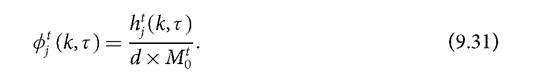
We may also be interested in analysing the percentage contributions of each dimension across various periods and thus in comparing the percentage contributions of dimensions across periods. The total percentage contribution in period t is
9.4.3.4 Censored Dimensional Duration
We are also able to construct a new set of statistics that provide more detail regarding the duration of dimensional deprivations among the chronically poor. We use the n ? d deprivation duration matrix L, constructed in section 9.4.1.3, in which each entry reflects the number of periods in which person i was chronically poor (by k and τ) and was deprived in dimension j. Recall that for the chronically poor, 0 ≤ Lij ≤ T in each dimension. The value of Lij is, naturally, 0 for non-poor persons in all dimensions. Thus the matrix will have a positive entry for qc persons and an entry of 0 for all persons who were never chronically poor.
For each dimension we can then define a dimensional duration index for dimension j as follows: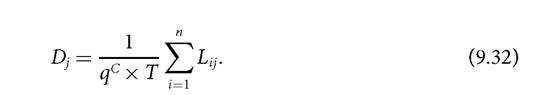
The value of Dj provides the percentage of periods in which the chronically poor were deprived in dimension j on average.
The relationship between the mean across all Dj and the chronic multidimensional poverty figure provided earlier is also elementary:
and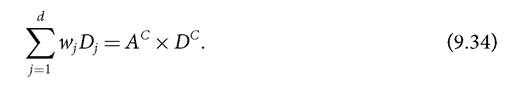
9.4.3.5 Period-Specific Partial and Consistent Sub-Indices
From the n ? T censored identification matrix Q(k, τ), we can also compute the period-specific headcounts of chronic multidimensional poverty. The headcount Ht for period t is the mean of the column vector of Q(k, τ) for period t. The average headcount across all periods is Hl = (1∕T^2T= 1 Ht. The average headcount across all periods and the chronic multidimensional poverty headcount are related by the average duration of
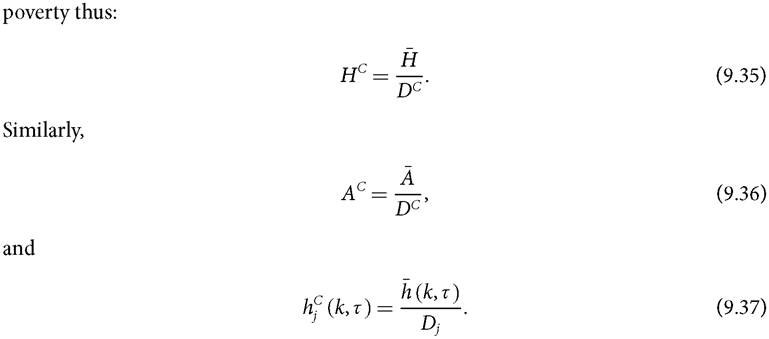
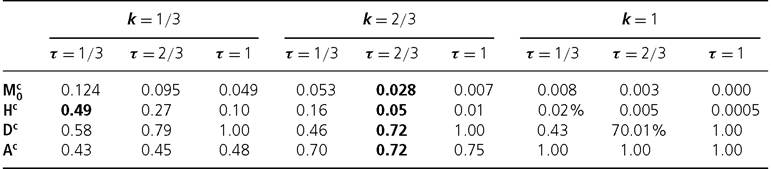
Table 9.7 Cardinal illustration with relevant values of K and τ
9.4.3.6 Illustration using Chilean CASEN
We present an example in Table 9.7 using three variables: schooling, overcrowding, and income in Chile's CASEN (Encuesta de Caracterizacion Socioeconomica Nacional) dataset for three periods: 1996, 2001, and 2006. The table reports the Adjusted Headcount Ratio of chronic multidimensional poverty (M^) and its three partial indices: the headcount ratio (Hc), the average chronic intensity (Ac), and the average duration (Dc) for three poverty cutoffs k = 1/3,2/3,1, and three different duration cutoffs t = 1/3,2/3,1. All dimensions and periods are equally weighted for both identification and aggregation. When k = 1/3 and τ = 1/3, the identification follows a double union approach. In this case, 49% of people are identified as chronically multidimensionally poor. However, a double-union approach does not appear to capture people who are either chronically or multidimensionally poor in any meaningful sense.
We thus consider the cutoffs where k = τ = 2/3. In this situation, 5% of people are chronically multidimensionally poor. The average chronic intensity is 72%, meaning that people experience deprivations in 72% of dimensions in the periods in which they are poor. The average chronic duration is 72% also, meaning that the average poor person is deprived in 72% of the three periods. The overall chronic Adjusted Headcount Ratio of 0.028 shows that Chile's population experiences only 2.8% of the deprivations it could possibly experience. All possible deprivations occur if all people are multidimensionally poor in all dimensions and in all periods.
9.4.4 POVERTY TRANSITIONS USING PANEL DATA
Using the identification matrix and the associated doubly censored deprivation matrices that have been constructed in section 9.4.1.3, it is also possible to analyse poverty transitions. Comparisons can be undertaken—for example, between subgroups experiencing different dynamic patterns of multidimensional poverty—to ascertain different policy sequences or entry points that might have greater efficacy in eradicating multidimensional poverty. This section very briefly describes the construction of dynamic subgroups and some of the descriptive analyses that can be undertaken.
9.4.4.1 Constructing Dynamic Subgroups
The chronic multidimensional poverty measures constructed previously respect the property of subgroup consistency and subgroup decomposability; thus, they can be decomposed by any population subgroup for which the data are arguably representative. In addition, it can be particularly useful to describe multidimensional poverty for what we earlier called ‘dynamic subgroups'—the definition of which can be extended when panel data cover more than two periods.
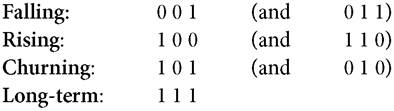
By dynamic subgroups, we mean population subgroups that experience different patterns of multidimensional poverty over time. These include the groups mentioned in section 9.3.1 who exited poverty (1,0), entered poverty (0,1), or were in ongoing poverty (1,1). The possible patterns will vary according to the number of waves in the sample as well as the observed patterns in the dataset. With three waves, there are four basic groups: falling—people who were non-poor and became multidimensionally poor; rising—people who were multidimensionally poor and exited poverty; churning—people who both enter and exit multidimensional poverty in different periods; and long-term—people who remain multidimensionally poor continuously.[241]
The dynamic subgroups are formed by considering the n ? T identification matrix Q(k). Note that we use the matrix that is censored by the poverty cutoff k but we do not, in this section on poverty transitions, apply the duration cutoff. Consider a matrix of four persons and three periods in which each person experiences one of the four categories mentioned above. Recall that an entry of 1 indicates that person i is multidimensionally poor in period t and a 0 indicates they are non-poor.
For more than three periods, additional categories can be formed. Note that the categories can and must be mutually exhaustive. Each person who is multidimensionally poor in any period (whether chronically or transiently poor) can be categorized into one of these four groups.
9.4.4.2 Descriptive Analyses
Having decomposed the population into the non-poor and these (or additional) dynamic subgroups of the population, it can be useful to provide the standard partial indices for each subgroup, both per period and across all three periods:
• M0, H, and A (and standard errors);
• percentage composition of poverty by dimension and censored headcount ratios;
• intensity profiles across the poor (or inequality among the poor—see section 9.1).
It can also be useful to provide details regarding the sequences of evolution. For example, from the Q(k) matrix, isolate the subgroup of the poor who ‘fell into' poverty between period 1 and period 2 (that is, whose entries are 0,1 for the respective periods t1 and t2). Compare their evolution with those who stayed poor (1,1) and those who stayed non-poor (0,0), in the following ways:
• at the individual level, compare the uncensored headcount ratio in period 1 with that in period 2.
• identify the dimensions in which deprivations were (a) experienced in both periods, (b) only experienced in period 1, and (c) only experienced in period 2.
• summarize the results, if relevant and legitimate, further decomposing the population into relevant subgroups whose compositional changes follow different patterns.
• repeat for each adjacent pair of periods. Analyse whether the patterns are stable or differ across different adjacent periods.
10