GLOBAL POVERTY
11.8.1 Methodology
Like absolute global inequality, global poverty is a measure based on absolute living standards. To measure global poverty, an absolute poverty line is applied to the global distribution of income and the number of individuals below it calculated.
This procedure is employed to monitor global poverty over time—including for the first Millennium Development Goal. Chapter 9 of this volume discusses poverty in developing countries and regions using different poverty lines. The most widely quoted estimates of global poverty for an absolute poverty line are those produced by Chen and Ravallion (2008,2012) at the World Bank. The Millennium Development Goal refers to consumption poverty, but the limited availability of surveys around the world and over time necessitates that Chen and Ravallion use a mixture of (consumption) expenditure and income surveys.Chen and Ravallion’s (2008, 2012) estimates for the World Bank use the 2005 ICP PPPs, which, as discussed earlier, are preferable to PPPs based on the earlier ICP rounds. Theirs are the only estimates of global poverty based on unit record data from surveys, which are not publicly released, and which are clearly preferable to the grouped data that are available to other researchers. The World Bank’s methodology has been criticized for not scaling the survey data to national accounts (NA) means.[689]
In Section 11.4 on data we discussed the question of whether to use NA means or survey means in the context of estimating global inequality. The methodology used by the World Bank to measure global poverty, like that used by us to estimate global inequality, uses survey data directly to estimate income (or consumption) levels—converted into international dollars using consumption PPPs. As in the case of global inequality, some authors have calculated global poverty by using survey data for within-country relative distributions and NA data for country mean incomes.[690] In the context of global inequality we argued that using means directly from surveys is preferable to scaling them to NA levels, and those arguments apply even more for measuring global poverty.
There is a further consideration that makes scaling to NA categories even less appropriate for estimating global poverty. We know that surveys tend to exclude very rich households and/or underreport their incomes, and for this reason they are likely to underestimate mean income or consumption. But this implies that scaling up the income (consumption) of every household to ensure that the survey mean is made equal to the NA mean will imply overestimating the income (consumption) of all but the richest households. Put another way, the “missing” income of the rich will be inappropriately divided among the entire population. Poverty will therefore be underestimated (for further discussion, see Anand et al., 2010, pp. 13-14).
Turning to the choice of poverty line, the World Bank uses what is commonly known as the “$1-a-day” line. This was originally defined in World Bank (1990) as PPP$1-per-day at 1985 PPP. This poverty line was chosen informally as being representative of the poverty lines of the poorest countries, converted into 1985 PPP$.
The difficulty arises over how to update a 1985-based PPP$ value.[691] Within a single country, one would usually update a poverty line by using a price index based on measured inflation. Because the international PPP dollar is indexed to the US dollar in the ICP benchmark year, one might think that all we need to do is to deflate by the US inflation rate. But updating a poverty line that is denominated in PPP$ is not so simple. As discussed earlier, calculating a set of PPP exchange rates involves the prices of all countries, so that changes in a country’s PPP exchange rate will depend on price changes in all countries. Bangladesh’s 1985 poverty line in 1985 PPP$, adjusted for US inflation during 1985-1993, would not be expected to be equal to Bangladesh’s 1993 poverty line in 1993 PPP$.[692]
TheWorldBankupdatedthe 1985 global poverty line to PPP$1.08 a day at 1993 PPP and now uses PPP$1.25-a-day at 2005 PPP.
This represents a lower rate of inflation than in the US, but as Chen and Ravallion (2001, p. 288) pointed out: “the fact that $1.08 in 1993 has a US purchasing power less than $1 in 1985 does not mean that the real value of the poverty line has fallen. Indeed, if we had simply adjusted the $1 per day line for inflation in the US between 1985 and 1993 we would have obtained a poverty line which is well above the median of the ten lowest poverty lines at 1993 PPP.” The WorldBank has chosen consistency with those domestic poverty lines as the most important criterion in setting a global poverty line. This can be justified by arguing that domestic poverty lines will have maintained their real value within their respective countries better than a PPP inflation-adjusted measure. Therefore each time they updated the poverty line, it was derived as the median of the lowest 10 poverty lines in their data set converted into PPP$ from the most recent ICP (Chen and Ravallion, 2001, 2008). Although this has an obvious logic to it, Deaton (2010) pointed out that the fact that the composition of the bottom 10 countries will change over time can lead to inconsistency: India exited the bottom 10 countries in their data set in the 2005 update owing to its relatively high growth rate, and because its poverty line was relatively low for its income level, this exit led to a rise in the poverty line relative to where it would be with India in the bottom 10 countries. This has the paradoxical implication that a rise in India’s income can lead to a rise in estimated global poverty.A more fundamental challenge to the PPP$1-a-day poverty line has been made by Reddy and Pogge (2010). They objected to the money metric approach to global poverty measurement, noting that the PPP$1-a-day poverty line does not correspond to any “achievement concept” or set of capabilities that are common across countries. That is, there is no reason to think that PPP$1-a-day in one country will enable the same set of achievements—for example, in terms of nutrition or shelter—as PPP$1-a-day in another country.
Although domestic poverty lines are often set according to some achievement concept, this interpretation is lost when a global poverty line is constructed using standard PPP exchange rates. Reddy and Pogge argued that an explicit achievement-based threshold should be used to define a global poverty line. This would require costing a minimal basic set of capabilities in each country to yield a money-metric poverty line denominated in local currency. Thus the global capability-based poverty threshold would be represented in income space by the set of these national poverty lines, one for each country.[693] Although this has theoretical attractions, it has not been implemented in practice.11.8.2 PovertyEstimates
The question of updating the global poverty line remains contentious, and the World Bank reports poverty headcounts for several different poverty lines. Its poverty measurement website Povcalnet[694] also allows the user to choose a poverty line for which it then provides estimates. The latest official publication of global poverty numbers (Chen and Ravallion, 2012) presents poverty headcounts using the following poverty lines all at 2005 PPP$: PPP$1-a-day, which they describe as “close to India’s (old) national poverty line” and “an exceptionally frugal line even by the standards of the world’s poorest countries” (Chen and Ravallion, 2012, p. 1); PPP$1.25-a-day, the line derived from domestic poverty lines in poor countries as described earlier; and PPP$2-a-day. We report the World Bank estimates in Tables 11.8 and 11.9.
Table 11.8 indicates that the first Millennium Development Goal, which was to halve the percentage of people living below “PPP$1-a-day” (i.e., PPP$1.25 at 2005 PPP) from its 1990 level by 2015, was almost achieved by 2008: this percentage declined from 43.1% of the developing world to 22.4%. Chen and Ravallion (2012) reported that the goal was in fact achieved in 2010, though the data for 2010 are not fully representative.
If the poverty line of PPP$1-a-day at 2005 prices is used, then the goal was fully achieved in 2008, with the percentage of the poor in developing countries falling from 30.8% in 1990 to 14.0% in 2008 (Table 11.8).It is clear from Table 11.9 that the distribution of this decline in poverty was highly uneven. The poverty rate in sub-Saharan Africa at the PPP$1.25 line was only slightly lower in 2008 than in 1981, at 47.5% rather than 51.5%. It is little comfort that the 2008 figure for this region is a larger drop from the 1993 peak of 59.4%. As is well known, a large share of the decline in global poverty is due to China, which managed to cut poverty from 84% in 1981 to 60.2% in 1990 and to 13.1% in 2008. The world excluding China
Table 11.8 World bank global poverty estimates, 1981-2008
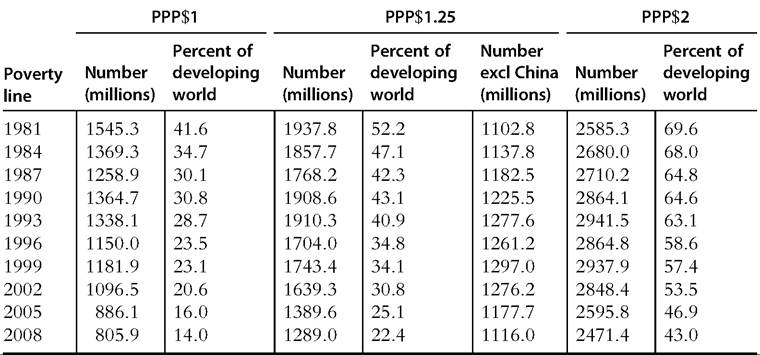
Note: All three poverty lines of PPP$1, PPP$1.25, and PPP$2 are at 2005 PPP. Source: Chen and Ravallion (2012).
Table 11.9 Headcount index of poverty (%) by region, 1981-2008, for poverty line of PPP$1.25 at 2005 PPP
| Region | 1981 | 1984 | 1987 | 1990 | 1993 | 1996 | 1999 | 2002 | 2005 | 2008 |
| East Asia and the Pacific | 77.2 | 65.0 | 54.1 | 56.2 | 50.7 | 35.9 | 35.6 | 27.6 | 17.1 | 14.3 |
| China | 84.0 | 69.4 | 54.0 | 60.2 | 53.7 | 36.4 | 35.6 | 28.4 | 16.3 | 13.1 |
| Eastern Europe and Central Asia | 1.9 | 1.6 | 1.5 | 1.9 | 2.9 | 3.9 | 3.8 | 2.3 | 1.3 | 0.5 |
| Latin America | 11.9 | 13.6 | 12.0 | 12.2 | 11.4 | 11.1 | 11.9 | 11.9 | 8.7 | 6.5 |
| Middle East and North Africa | 9.6 | 8.0 | 7.1 | 5.8 | 4.8 | 4.8 | 5.0 | 4.2 | 3.5 | 2.7 |
| South Asia | 61.1 | 57.4 | 55.3 | 53.8 | 51.7 | 48.6 | 45.1 | 44.3 | 39.4 | 36.0 |
| Sub-Saharan Africa | 51.5 | 55.2 | 54.4 | 56.5 | 59.4 | 58.1 | 58.0 | 55.7 | 52.3 | 47.5 |
| Total developing world | 52.2 | 47.1 | 42.3 | 43.1 | 40.9 | 34.8 | 34.1 | 30.8 | 25.1 | 22.4 |
| Total developing world excluding China | 40.5 | 39.1 | 38.1 | 37.2 | 36.6 | 34.3 | 33.6 | 31.5 | 27.8 | 25.2 |
Source: Chen and Ravallion (2012).
also succeeded in reducing poverty, but at a much slower rate. Excluding China, global poverty declined by less than a third since 1990, from 37.2% to 25.2%.
One notable feature of the global distribution of poverty is that much of it is found outside the poorest countries. For instance, in 2008 India was a lower-middle-income country,[695] yet it contained approximately 380 million people below the PPP$1.25 poverty line,[696] or 30% of the global total and about the same number as in all of sub-Saharan Africa.[697] Indeed, Sumner (2012) points out that a majority of people below the World Bank poverty line live in middle-income countries.
In Section 11.6 we noted that within-country inequality has risen over the past two decades, suggesting that the decline in global poverty has been driven by aggregate growth in low- and middle-income countries. It does not follow, however, that continued aggregate growth is the only way to continue to reduce poverty. Redistribution within countries could also play a significant role in poverty reduction in poor countries, just as it does in rich countries.[698]
The average annual income of those living below the PPP$1.25-a-day poverty line was PPP$421 in 20 05.[699] Using our estimated global income distribution presented earlier, the individuals in the richest percentile of the world, whose annual incomes averaged PPP$90,000, were therefore 214 times richer than individuals in the poorest 21% of the world. Put another way, the richest 1% of the world, or 65 million people, had a total income a little more than 10 times that of the poorest 21%, or 1390 million people.
11.8.