HEALTH AND INCOME: A FIRST PASS
To whet the appetite, we illustrate the strength of the relationship between health and income in the USA, the NL, and China.[57] Our purpose is simply to show that there is a substantial and ubiquitous relationship that deserves attention and to assess its potential relevance to the explanation of inequalities in the distributions of income and health.
The three countries are chosen primarily because of their differences. One is large, rich, and unequal, and it does not (yet) have universal health insurance coverage. Another is small, rich, and egalitarian, and it provides universal health coverage and extensive social protection, including DI, typical of northern continental Europe. The third is very large, much poorer (but rapidly becoming less poor), and less healthy than the other two, with increasing economic inequality and limited health and DI coverage. Differences in the wealth and economic structures of these countries, as well as their health and welfare institutions, might be expected to be reflected in the distributions of income and health, as well as the association between them.Figure 17.1 illustrates the income gradient in self-assessed health (SAH) (Smith, 2004)—the most common survey measure of general health that invites a respondent to select one of four (China) or five (NL and USA) labels as the best description of his or her health. We focus on the percentage of individuals reporting less than good health, which always corresponds to the bottom two categories of SAH, by age-specific quartile groups of household per capita income.[58] In the USA, this percentage rises monotonically as income falls at all ages except among the oldest (70+). Even the poorest elderly, whose income should not depend on their current health, are more than twice as likely as their richest contemporaries to report less than good health.
The pattern is similar in the Netherlands but for the absence of a gradient among young adults and a weaker gradient among the elderly. In both countries, the gradient increases until middle age and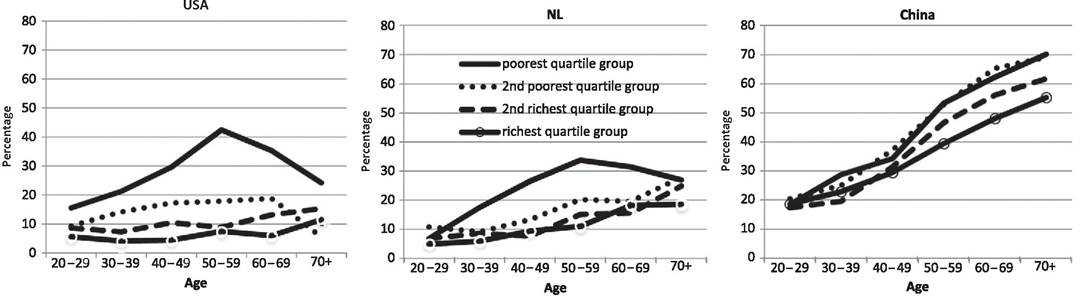
Figure 17.1 Percentage of individuals reporting less than good health by age-specific quartile groups of household per capita income in United States (USA), the Netherlands (NL), and China. Notes: Authors'calculations from 2006 CHNS (China), 2011 LISS (NL), and 2008 ALP (USA). ALP and LISS respondents report health as being excellent, very good, good, fair (ALP)/moderate (LISS), or poor. CHNS respondents report health relative to others of their own age as very good, good, fair, or poor. Household income is before payment of taxes and Social Security contributions and after receipt of transfers. Income is annual for ALP and monthly for LISS and CHNS, with all incomes in local currencies. Per capita income assigned to each household member.
narrows beyond that when retirement becomes more prevalent. This is consistent with employment being an important characteristic linking health to income. At the peak of the gradient between the ages of 50 and 59, more than 40% of the poorest Americans report their health to be less than good, compared with less than 10% of their richest compatriots. The inequality is narrower in the Netherlands, but the poor middle aged are still around three-and-a-half times more likely to report less than good health than are those in the top quartile group of the income distribution.
In China, the main health disparity is not between the poorest quartile group and the rest, as it is in the USA and the Netherlands, but, if anything, it is between the richest quartile group and those less privileged. There is no narrowing of the gradient in old age in China. In fact, health differences are greatest in the oldest age group, which is consistent with sizable inequalities in pension entitlements and health insurance coverage among the Chinese elderly but may also reflect the fact that the Chinese survey asks respondents to report health relative to others of the same age (see note to Figure 17.1).
Figure 17.2 shows the flip side of the relationship between individual health and income, with individual income measured by household per capita income. In all three countries, those in (at least) very good health have substantially higher incomes than those in poor health. In the USA at all ages, mean household per capita income falls as health drops from one category to the next. The health gradient in income peaks in the prime years of working life (40—49), when the mean income of those reporting excellent or very good health is around three-and-a-half times greater than the income of those in poor health. Even in old age, those with the best health have almost twice the incomes of those with the worst health. The health-related income gaps are narrower in the Netherlands. Even at the ages (50-59 years) where the disparity is greatest, those in the best health do not receive twice the income of those in the worst. The relative income differences by health in China are similar in magnitude to those in the Netherlands, except in old age when the gap widens, rather than narrows.
The individual health-income relationship remains strong after controlling for some potential correlates ofboth. Table 17.1 shows estimates from least squares regressions of the logarithm of household equivalent income of each individual for SAH, gender, age, ethnicity, education, and region (USA and China).[59] Conditional on these characteristics, in the US sample, the mean income of those reporting very good or excellent health is approximately 66-69% greater than that of someone reporting poor health (left panel, first column). This is larger than the relative income difference between those with the middle (post-high school vocational) and lowest (high school graduate or less) level of education, although it is not quite as large as the difference between university graduates and those with no more than high school education. Controlling for employment status has a very large impact on income differences by health.
In the USA, the mean income of those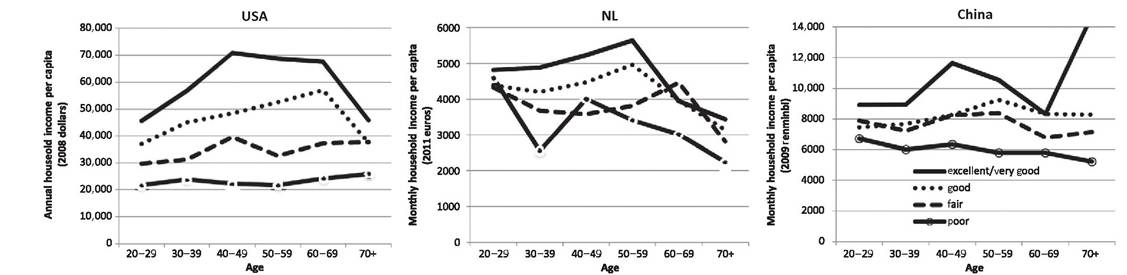
Figure 17.2 Mean household per capita income by self-assessed health and age in the United States (USA), the Netherlands (NL), and China. Notes: As in Figure 17.1, the unit of analysis is the individual.
Table 17.1 Least squares regressions of log household equivalent income and decompositions of income inequality (relative Gini) in the United States, the Netherlands, and China
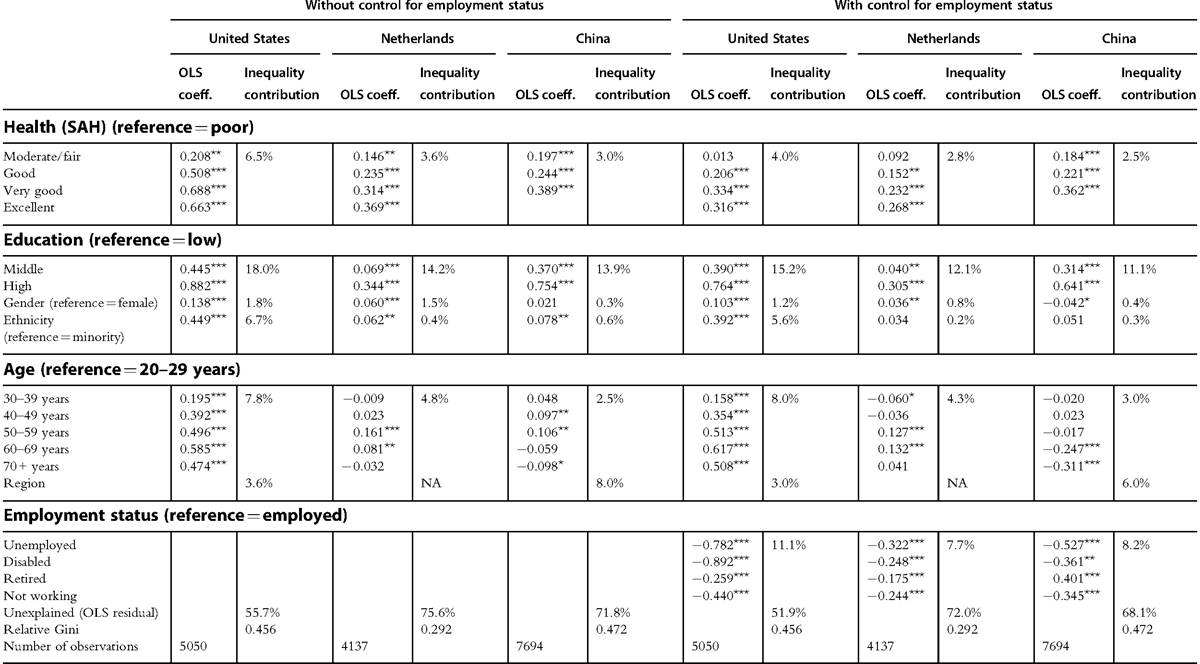
Notes: Unit ofanalysis is the individual. Household equivalent income allocated to each individual in the household aged >19. Column headed “OLS coeff.” gives coefficients from least squares regression of log household equivalent income on individual characteristics. “Inequality contribution” is the estimated contribution of the factor to inequality across individuals in household equivalent income computed from the Shapley value decomposition of the relative Gini index. SAH = self-assessed health. Definitions and means of the dependent variables and covariates are provided in Table A1. Reference category for ethnicity is not belonging to the main ethnic group (white (USA), Dutch (NL), and Han (China). Coefficients of regions (USA) and provinces (China) are not shown to save space. Region identifiers are not made available with the Dutch data. *, **, *** indicate significance at 10%, 5%, and 1% levels.
with at least very good health relative to those in poor health is reduced by half to 32-33% (right panel, first column). A large part of the strong relationship between income and health appears to be mediated through employment.
Multivariate analysis confirms what is suggested by Figure 17.2—that income gaps by levels of health are narrower in the Netherlands and China than in the USA. Without being conditional on employment, the Dutch reporting at least very good health have incomes approximately 31-37% higher than their compatriots in poor health.
This is much lower than the respective relative disparity in the US sample. But being conditional on employment has a much smaller impact than it does in the USA, reducing the difference by around a quarter to 23-27%, which is only slightly less than the relative income difference of 30% between those with the highest and lowest levels of education. The more modest effect of being conditional on employment may be a reflection of the more generous DI in the Netherlands, which is evident in the coefficients on DI status. Being conditional on employment has little or no impact in the Chinese sample. Those reporting very good health have incomes approximately 36% higher than those in poor health. This is because employment differs less by health in China (see Figure 17.4).Large differences in income by health do not necessarily imply that health statistically explains, let alone causally determines, a substantial part of income inequality. Whether it does depends on the degree of health variation that exists in the population, in addition to its partial correlation with income. The percentage of respondents reporting poor health is only 1.5% in the Dutch sample, rising to 3% in the USA and to 7% in the Chinese
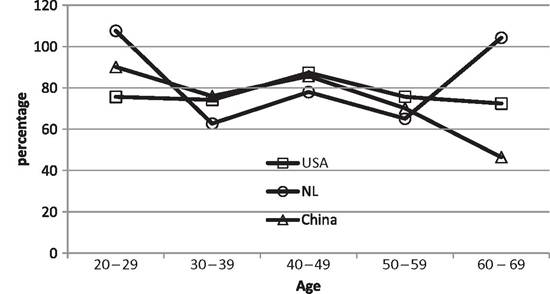
Figure 17.3 Mean earnings in bottom two categories of self-assessed health as a percentage of mean earnings in the top two categories, for China, the Netherlands, and the USA. Notes: Authors'calculations from CHNS 2006 (China), LISS 2011 (Netherlands), ALP 2008 (USA). Samples restricted to those in work. Earnings include gross earnings/salary income from employment and profits from self-employment in the past year in the Netherlands and the USA, and gross wages, including bonuses and subsidies, in the last month in China. Self-assessed health is reported from five categories in NL and USA and from four in China. See notes to Figure 17.1.
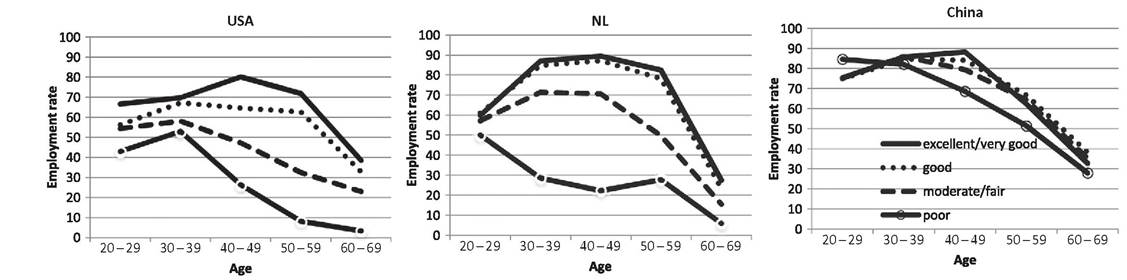
Figure 17.4 Employment rates by self-assessed health and age in China, the Netherlands, and the USA.
Notes:Authors'calculations from 2006 CHNS (China), 2011 LISS (NL), and 2008 ALP (USA). Employment includes full- and part-time work. For details of SAH by country, see notes to Figure 17.1.(Table A1). Differences in income between those with poor and higher levels of health may therefore make only modest contributions to the explanation of income inequality.
To give an impression of the contribution that health can make to the explanation of income inequality, we apply a simple version of a Shapley value approach (Sastre and Trannoy, 2002; Shorrocks, 2013) to decompose the relative Gini index estimated from the three datasets. This involves writing the income of each individual as the predicted value from the regression, plus the residual, and calculating the marginal impact on the Gini of neutralizing a variable by fixing its value across all individuals. This impact will vary depending on the covariates that have previously been held constant. The contribution of a variable to inequality is given by its average marginal impact across all possible sequences of neutralizing the set of all covariates.4
As would be expected, the estimated Gini indices reveal inequality to be lowest in the Netherlands (0.29) and of similar magnitude in the USA (0.46) and China (0.47). The percentage contributions of the factors to income inequality are reported adjacent to the respective column of regression coefficients in Table 17.1. Without conditioning on employment status, SAH explains 6.5% of income inequality in the US sample (left panel, second column). This is similar in magnitude to the contribution of race, a little less than that of age, and about one-third of that of education. The decomposition obviously depends on the specification of the regression model. Once employment status is added to the controls, health only explains 4% of income inequality, which is half of the contribution of age and a little more than one quarter of that of education.
Without conditioning on employment, health explains 3.6% and 3.0% of income inequality in the Netherlands and China, respectively. In each country, this is substantially more than the contribution of both gender and ethnicity. The health contribution is around 20% higher than that of age in China but less than the age contribution in the Netherlands. In both countries, as in the USA, the contribution of variation in SAH to the explanation of income inequality is substantially less than that of education. As predicted by the estimates of the regression models, controlling for employment status has less impact on the extent to which health explains income inequality in the Netherlands and China than it does in the USA.
Without conditioning on employment, which is the most obvious route through which health influences income, variation in SAH accounts for 6.5%, 3.6%, and 3.0%

sion of log income and ei is the residual. Inequality in this measure is computed and compared for different combinations of the regressors (xki) and residuals fixed at particular values. We compute the aggregate contribution of a factor, such as SAH, that consists of several categories represented by dummy variables, and we do not attempt to establish the contribution of each separate category. Use of the relative Gini and a regression model of log income ensures that the decomposition is insensitive to the values at which the regressors are fixed and to the estimate of the constant (γ0).
of income inequality in the USA, the Netherlands, and China respectively. Although these contributions appear modest, one must bear in mind that most inequality remains unexplained by an admittedly rather restricted set of factors in all three countries. SAH accounts for almost 15% of the explained income inequality in the USA and the Netherlands and just over 10% in China. In addition, SAH is only one measure of health and varies only over four or five categories. It is inevitable that such a variable will not be able to account for a substantial proportion of the variation in continuous incomes. Differential reporting of health may also result in SAH understating the correlation between income and health (Bago d’Uva et al., 2008). While it is established that SAH is an informative summary measure of health, the addition of more health measures, particularly continuous ones and those capturing disabilities, to the decomposition analysis would inevitably increase the proportion of income inequality that is explained by health variation.
Based on the regression and decomposition analysis presented, nothing can be inferred about causality—its direction or even existence. One can just as well look at health differences that are explained by income variation. Table 17.2 presents estimates from interval regressions of transformations of SAH on household equivalent income and the same covariates used in the income regressions (Doorslaer and Jones, 2003).[60] This health measure lies between 0 (minimum health) and 1 (maximum health). In the USA, the difference in predicted health between the richest and poorest quartile groups of household equivalent income is about 1.8 times greater than the difference between the youngest and oldest age group and between the highest and lowest education categories (left panel, first column). As could be anticipated from the narrower income gaps by health in the Netherlands, observed in Table 17.1, the health differences by income are also smaller than those in the USA (Table 17.2, middle panel). Still, the health disparity between the richest and poorest income groups is more than twice the difference between the top and bottom education groups. In China, the health differences by income are also substantially larger than the differences by education.[61]
Table 17.2 also presents results from Shapley value decompositions of inequality in transformed SAH. There are two notable differences from the decomposition of income
Table 17.2 Interval regressions of self-assessed health (SAH) and decompositions of inequality (absolute Gini) in predicted SAH for the United States, the Netherlands, and China
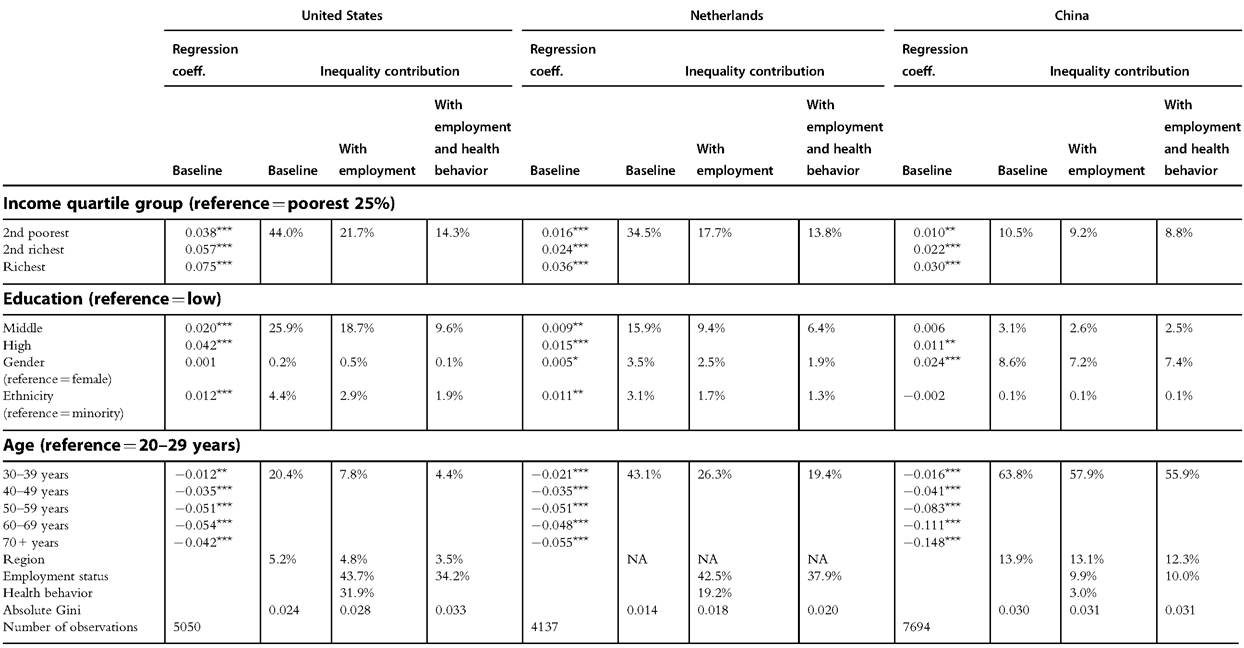
Notes: Unit ofanalysis is the individual. Column headed “Regression coeff.” gives the coefficient from the interval regression ofSAH with thresholds ofcategories as definedin footnote 5. “Inequality contribution” is the estimatedpercentage contribution ofthe factor to inequality inpredictedhealth (obtained from the respective interval regression) computed from the Shapley value decomposition of the absolute Gini index. The latter takes values between 0 and 0.25, with those bounds indicating minimum and maximum health inequality, respectively. Definitions and means ofthe dependent variables and covariates are provided in Table A1. Reference category for ethnicity as in notes to Table 17.1. Region/province coefficients not shown. Regression coefficients are shown only for the baseline specification. Extended specifications sequentially add employment status (as Table 17.1) and proxies for health behaviors—smoking and weight. Smoking is measured by an indicator of ever having smoked in the USA and NL and currently being a smoker in China. Weight is summarized by a dummy for normal or overweight (18.5 < BMI < 27.5 for China and 18.5 < BMI < 30 for the USA and the Netherlands) and another for obesity (BMI > 30 for the USA and the Netherlands, andBMI > 27.5 for China). For underweight, BMI < 18.5 is the reference. *, ** and *** indicate significance at the 10%, 5% and 1% levels respectively.
inequality. First, the categorical nature of SAH, modeled by interval regression, means that unexplained variation in health cannot be captured by the decomposition. All contributions refer to the percentage of the explained variation that is accounted for by a factor. Second, the absolute, rather than relative, Gini index (Yitzhaki, 1983) is a more appropriate measure of inequality in a bounded variable such as transformed SAH (Erreygers, 2009; Lambert and Zheng, 2011).7
Income quartile groups account for 45% of the explained inequality in SAH in the USA (left panel, second column). This is roughly equal to the contributions of age and education combined. Further evidence that employment is central to the association between health and income in the USA is provided by the fall in the income contribution by more than half, such that it becomes only slightly more important than education in explaining health inequality when employment status is added to the interval regression of SAH and so the decomposition (left panel, third column). Adding proxies for health behavior, in the form of indicators of weight and smoking, reduces the income contribution by about one-third more, which is suggestive of differences in lifestyle being an important reason why health differs by income.
In the Netherlands, income variation accounts for 35% of the explained inequality in SAH, which is more than twice the contribution of education. Adding employment status reduces the contribution of income by half, but it remains roughly twice that of education. Entering health behavior into the decomposition has a more modest impact. In China, income differences account for much less of the explained variation in health— around 9% irrespective of whether employment or health behavior is controlled for. As is also evident in Figure 17.1, health inequality in China appears to be driven mainly by age, which is perhaps surprising given that only the Chinese survey asks respondents to report their health relative to that of someone of the same age. On the other hand, a very steep decline in health with age in China would be anticipated from the lack of health insurance coverage, particularly for the elderly in rural locations, at the time of the survey, as well as from events experienced in the twentieth century.
Our empirical illustration demonstrates that there is a strong relationship between income and health. Income differences by health are large. Correspondingly, health disparities by income are wide. The relationship is stronger in the USA than in the Netherlands and China. The dissimilarities of the latter two countries imply that the strength of the relationship is not explained by a simple factor, such as the informality of the economy, universality of health insurance coverage, or generosity of welfare, but is likely a product of many such factors. Employment status, particularly in the USA among the three countries examined, is key to the relationship between income
7 Given that the interval regression model has an additive specification and we use an inequality index that is invariant to equal additions, neither the constant nor the values to which factors are set when neutralized will affect the decomposition results.
and health. But it is unlikely to be the only mechanism. Even after controlling for employment, income differs greatly by health, and thus, health varies substantially with income.
A single health variable, self-assessed health, accounts for 6.5% of total income inequality and 14.6% of explained inequality in the USA. These estimates suggest the distribution of health in the population has a potentially important, although not central, role in explaining income inequality. But one could equally claim that variation in economic circumstances is key to the explanation of the health distribution. Indeed, income differences explain almost half of the inequality in predicted (self-assessed) health in the USA.[62]
While descriptive multivariate analysis and decompositions are useful in determining the strength of relationships, they tell us nothing about causality. Nevertheless, we hope to have convinced the reader that the association between income and health is sufficiently strong and pervasive such that it deserves to be probed by those seeking a better understanding of the distribution of income, as well as others aiming to account for disparities in health. In the next two sections, in turn, we consider the impact that health has on the distribution of income and the effect that income has on the distribution of health.
17.3.