Managing the global economy: post ‘credit crunch'
In this chapter the objectives of macroeconomic policy are discussed, along with the instruments for achieving them! Adjusting the instruments of policy to ‘best’ meet a set of target values for various objectives seems to fit the actual conduct of policy in various countries, including the UK, at various periods of time.
Whilst, on occasions, the UK is used by way of illustration, the principles of macroeconomic management are generally applicable. The emphasis has, however, subsequently tended to shift away from such ‘fine-tuning’ and towards the adoption of medium- and long-term rules. Various approaches to managing the economy are reviewed, including the Cambridge Economic Policy Group (CEPG), the Keynesian and the monetarist/supply-side approaches. The problems in the global economy associated with the collapse of the sub-prime market and the subsequent ‘credit crunch’ are reviewed, together with some of the techniques proposed for resolving these problems and for managing the global economy in a more sustainable way.The chapter builds on the earlier chapters involving both fiscal policy (Chapters 18 and 19) and monetary policy (Chapters 20 and 21).
I The objectives of policy
The desire of most individuals is to live and work within an economic framework which gives them the prospect of steady employment, relatively stable prices and a rising standard of living. It is usually recognized that to achieve such a situation the economy must trade and ‘pay its way’ with other economies. Politicians realize that to attract votes and gain political power they must promise that these aspirations will be met, if only in the long run. Economic objectives at the macroeconomic level are therefore set in terms of full employment, price stability and rapid economic growth, together with long-term equilibrium in the balance of payments.
All these objectives have attracted attention in the post-war period. Since they are unlikely to be achieved in their totality, they have usually been expressed in terms of target values. Whilst these target values have not always been explicitly stated, they seem to be influenced by achieved values within the recent past.Full employment
For instance, it is recognized that full employment can never mean zero registered unemployment if only because of dynamic change within society. Following the Beveridge Report of 1944, a 3% rate of unemployment (about half a million) was used in the 1950s and 1960s in the UK as the ‘acceptable’ upper limit. In more recent times, UK governments have been reluctant to commit themselves to any specific unemployment target.
Stable prices
Stable prices have always been regarded as unrealistic, but the attainment of an annual inflation rate of around 2.5% seems to have been the approximate target for the UK government in the first two postwar decades. More recently, the reduction of the annual inflation rate to below 4%, or to a rate equivalent to that of our industrial rivals, would appear to have been the target set during much of the 1980s and 1990s. With the advent of the new Labour government in 1997 and the establishment of an independent Monetary Policy Committee (MPC), a specific target of 2.5% for annual inflation was given to the MPC between 1997 and 2003 to guide it in setting interest rate policy. This target was decreased to 2% in December 2003 and remains in place in 2011.
Economic growth
Economic growth (see also Chapter 29) has received relatively little specific emphasis in the UK, although most governments have expressed some enthusiasm for it! We have, generally speaking, enjoyed rising living standards and have compared ourselves (favourably) with our parents and grandparents rather than with our contemporaries in Europe, the US or Japan. A well-known statement concerning economic growth as an objective was made by the late R.
A. Butler in 1954, when he suggested a doubling of living standards every 25 years as an explicit target. This was greeted as being over-ambitious, yet it entailed an annual growth rate of GDP of less than 3%. The Economic Plan of 1965 sought a UK growth rate of 3.8% per annum, but this was quickly seen to be unattainable and this attempt at long-term planning was soon abandoned. Between 1997 and 2003 there was a criticism that the Monetary Policy Committee had not been given a growth target to set alongside the 2.5% inflation target when deciding the level of interest rates.The balance of payments
The balance of payments is often described as an objective of economic policy, the target being either equilibrium or a surplus over a period of time in order that accumulated international debts might be repaid. This can hardly be related to the aspirations of individuals and is thought by many to be more properly described as a constraint upon the achievement of other objectives. Nevertheless, target figures have been set in the past, e.g. the 1953 Economic Survey in the UK called for a surplus of £450m per annum as the target surplus on current account in the 1950s to finance the long-term capital outflow. It was not achieved, and since then the use of target figures has become less important. However, a relatively ‘healthy’ external account is still an important consideration of policy.
This list of objectives could be extended to include others, such as the redistribution of income and wealth, but target values for employment, inflation and underlying economic growth have received most attention.
I The instruments of policy
Governments would have no macroeconomic problems if market forces in the economy automatically led to ‘full employment’ equilibrium, with stable prices and a rapid economic growth. The bulk of the evidence seems to indicate that market forces alone have failed to achieve these objectives, either in full or even at ‘satisfactory’ values.
Such ‘market failure’ essentially constitutes the case for intervention by governments. If governments are to intervene in the economy, there still remains the problem of selecting the appropriate instruments for achieving the targets they set themselves.In general terms the policy instruments available to the UK government are fiscal policy, monetary policy, prices and incomes policy and policy instruments aimed at the balance of payments, such as the exchange rate or import controls. These policy instruments are sometimes called ‘instrumental variables’, i.e. variables over which the government has some control, and the values of which affect the behaviour of the economy itself in some reasonably systematic way.
Fiscal policy
Fiscal policy involves using both government spending and taxation to influence the composition and level of aggregate demand in the economy. Elementary circular flow analysis suggests that by raising the level of government expenditure and/or by reducing taxation, the level of aggregate demand can be raised (by a multiplied amount) with favourable consequences for economic activity and employment. Such an expansionary course of action might result in a larger budget deficit, or a reduced budget surplus, in this way affecting the Public Sector Borrowing Requirement (PSBR), now known as the Public Sector Net Cash Requirement (PSNCR). This somewhat simplistic approach is the basis for fiscal interventionism as advocated by ‘Keynesians’, and carried out with some success in the UK for over 25 years after the Second World War. The Budget was viewed not as an accounting procedure, with expenditure and revenue to be balanced as a matter of good housekeeping, but as an instrument of policy to be manipulated as a means to an end. Deficits were financed by borrowing, short or long term, from home and abroad, with the increased National Debt seen as a means of spreading the costs of current policy over future generations.
Practical problems abound.
Although tax rates can be set, the revenues they will yield are difficult to predict as income levels can vary. Also government expenditure and tax receipts are subject to time-lags, which can have destabilizing effects. For instance, the government may aim to raise spending to stimulate the economy during recession, but the effects may not be felt for several time periods, when the economy may be in a different situation. In other words, fiscal policy may move the economy away from desired values rather than towards them. There is even a problem in identifying the government’s fiscal stance. A contractionary fiscal policy will, if successful, reduce incomes and tax yield, and might also have the effect of raising some government expenditures such as unemployment benefit. If we look, therefore, at the Budget out-turn for evidence of the government’s fiscal stance, we may come to the wrong conclusion - the reduced tax yield and increased government expenditure may be the result of a contractionary fiscal policy, not evidence of an expansionary one! Problems such as these account in part for the relegation of fiscal policy in favour of monetary policy by Conservative governments during the 1980s. Even after the post-1997 Labour government brought some measure of stability into fiscal affairs by introducing its ‘fiscal rules’ (see Chapter 18), problems still arose in identifying accurate trends for government expenditure and revenue which has remained the case for the Coalition government in the UK which came into power in 2010 and moved away from such fiscal rules.Monetary policy
Monetary policy aims to influence monetary variables such as the rate of interest and the money supply, in order to achieve the targets set for the four major objectives. Although the rate of interest and the money supply are interrelated (see Chapter 20), for convenience we examine these separately.
The rate of interest - in practice there are many - is thought to be important because it is a cost of borrowing, influencing not only long-term investment decisions by firms but also their short-term borrowing to overcome cash-flow problems.
Interest rates may influence consumer spending on durable goods by affecting the cost of hire-purchase finance. Interest rates also influence household decisions as to the composition of the assets they hold. For example, low interest rates offer little reward for those acquiring financial assets, thus encouraging consumer expenditure on goods and services. The balance of payments is also affected by interest rate policy, as capital inflow and outflow depend on UK interest rates relative to those in other countries.The money supply, as we saw in Chapter 20, ‘matters’ to both monetarists and Keynesians. To monetarists, money supply mainly affects prices, at least in the long run, whereas to Keynesians, the major impact is on output and employment. The measurement and control of money supply have therefore been widely regarded as an important policy instrument, and we return to this below.
Prices and incomes policy
Prices and incomes policy is used in an attempt to control inflation by directly influencing the rate at which prices, wages and salaries rise. Depending on political and economic belief, such a policy can be viewed as an irrelevance by the monetarists, or as a necessary means of influencing the institutional determinants of inflation by the Keynesians, particularly when expansionary fiscal measures are being used to overcome unemployment.
Since 1960 there have been few occasions on which this instrument of policy was not in use in the UK, either on a voluntary basis or in the form of statutory control. Prices have been directly controlled as well as wages, and wages themselves have been subject to various forms of restraint, such as ‘freezes’, or ‘norms’ for wage increases. The impact of the policy has, predictably, fallen most heavily on the public sector. Although during the operation of incomes policy the rate of wage inflation has usually been reduced below the previously prevailing figure, it has often been higher than the ‘norm’ set, and has always been followed, when controls have been relaxed, by a rapid and sharp increase in the rate of wage inflation. It is difficult to test the overall effects of the use of this instrument of policy, but it is generally regarded as having been less useful in the long term. Prices and incomes policy was last used formally in 1979, but an incomes policy has been used informally since then, with the introduction of cash limits for the public sector acting as a constraint on wage increases. For example, public sector pay has been frozen over the period 2009-11.
The exchange rate
The exchange rate is one of the instruments which can be used to influence the balance of payments. With the exception of the devaluations of 1949 (30%), and 1967 (14%), the sterling exchange rate was essentially fixed under the International Monetary Fund (IMF) system. In 1971 the convertibility of the dollar into gold at a fixed price was abandoned and the IMF fixed exchange rate system broke down. Since mid-1972 the UK exchange rate has fluctuated, in theory according to market forces (a ‘clean’ float), but in practice often ‘managed’ by the authorities (a ‘dirty’ float). Although the pound fell to record low levels against the dollar in early 1983, it would have fallen even lower had the Bank of England not intervened on the foreign exchange market to buy the pound with its foreign currency reserves.
A change in the exchange rate will affect the relative prices of domestic- and foreign-produced goods and services. For example, a lower exchange rate makes UK goods cheaper in the foreign markets, and foreign goods more expensive in the UK market (see Chapter 25). Given appropriate elasticities for exports and imports,1 a lower exchange rate will improve the balance of payments.
One major difficulty in a lower exchange rate policy is that this will have an adverse effect on domestic costs, both directly and indirectly. The rise in price of imported foodstuffs and finished manufactures will have an immediate and direct effect on the price level, because these items are included in the Retail Price Index (RPI). The rise in price of imported raw materials and semi-finished manufactures will also have an indirect effect on the price level, by raising domestic costs of production. Higher prices could also stimulate higher wage demands to protect real incomes, further fuelling inflation. In these ways, the competitive advantage of devaluation may well be eroded, and the objective of price stability (or reduced inflation) adversely affected. Between 1987 and 1992, the government sought to target the exchange rate at particular levels against various currencies. This was in order to prevent sterling depreciating too rapidly, thereby endangering the control of inflation. The entry of sterling into the Exchange Rate Mechanism (ERM) at a relatively high rate of 2.95 Deutsche marks (DM) to the pound in October 1990 was also to help contain inflationary pressure in the UK. One of the concerns facing the government when the UK left the ERM in September 1992 was the fear that the 14% fall in sterling’s value against the DM (and 20% against the US dollar) by late 1992 would rekindle inflationary pressures. As it turned out, such fears proved largely unfounded. Since 1992 there has been no explicit targeting of the exchange rate, despite frequent complaints by UK manufacturers and industrialists of a ‘high pound’.
Import controls
Import controls are another policy instrument for affecting the balance of payments, but have been little used in the UK since the Second World War, other than to reduce import tariffs in line with other members of the General Agreement on Tariffs and Trade (GATT). Two examples may serve to illustrate their use. Between 1964 and 1966 there was an import surcharge scheme whereby most imported manufactured goods carried a levy of 15% in an attempt to reduce imports by over £550m per annum. It was a partial success, reducing them by perhaps half the intended sum. In 1968-70 there was an import deposit scheme whereby half the value of imported manufactured goods had to be deposited with the government for six months, with no interest paid. Little effect upon the balance of payments was discerned.
Renewed interest in import tariffs emerged in the early 1980s, stimulated by the Cambridge Economic Policy Group (CEPG) who, initially at least, saw a direct and close relationship between the size of the Budget deficit and the size of the balance of payments deficit. If expansionary domestic fiscal policy is to overcome unemployment and stimulate investment, they advocate imposing tariffs to prevent the extra domestic spending from being satisfied by overseas suppliers. Their aim was not to reduce imports below the initial pre-expansion figure, but to prevent them from rising above that level.
Problems in managing the economy
Before we consider the theory of economic policy, some general points can be made concerning the objectives of policy and the instruments available to the government.
Trade-off between objectives
The most obvious difficulty is that the objectives ‘trade off’ against each other. For example, policy instruments that governments use to achieve the objective of lower inflation often impose a cost of higher unemployment. Curbing the money supply may reduce the value of spending,2 and raise interest rates, resulting in the closure of many firms, with the loss of jobs. Curbing government spending as part of monetary policy can also reduce employment in the public sector. A higher exchange rate during 1981/82, from 1985 to 1988 and again from 1996 to 2002 made UK exports expensive, and imports cheaper, reducing domestic output and employment, especially in the more tradeable manufacturing sector. Lower inflation can therefore be achieved, but at the cost of higher unemployment. High interest rates and low economic activity can also discourage investment, adversely affecting another important policy objective, that of economic growth. This raises the question of ‘weighting’ the objectives against each other, e.g. how much extra unemployment and lower growth will be tolerated in order to reduce the inflation rate by a further x percentage points?
Interdependence of instruments
Policy instruments are not independent of each other. For example, fiscal policy has implications for the money supply and for the rate of interest. In turn, the domestic rate of interest will, by its effect upon short-term capital flows, influence the sterling exchange rate, and will also affect the money supply.
Instruments as objectives
It has to be recognized that policy instruments sometimes become objectives in their own right. This was the case with the exchange rate instrument which was used only twice in the post-war period up to the early 1970s. This was because preserving the value of the pound had itself become an objective of policy, so that it could no longer be used as a flexible instrument of policy. Again in February 1987 the UK agreed to the Louvre Accord in Paris which stated that a period of exchange rate stability was desirable. This made it more difficult to use the exchange rate as a policy instrument and in some respects it then becomes an objective of policy instead! This became even more obvious between 1990 and 1992 when maintaining sterling’s parity in the ERM was seen as a major objective of policy.
Political constraints
The set of policy objectives chosen, and the instruments used, may be constrained by the fact that it is politicians who are the ultimate decision-takers. Each course of action must therefore be evaluated in its political context. The use of some policy instruments may then be inhibited, as with the Conservative government’s reluctance formally to use a prices and incomes policy given its views on the efficacy of a free market system. Similarly, the decision of the government to enter the ERM in October 1990 severely limited its ability to use the exchange rate as an instrument of policy, although its subsequent withdrawal in September 1992 eased this limitation. In 1997 the decision to establish an independent body, the MPC, to set interest rates effectively removed this policy instrument from government control.
I The theory of economic policy
Here we look at the basic theory of economic policy, first reviewing the ‘fixed targets’, the ‘variable targets’ and the ‘satisficing’ approaches to policy formation before briefly considering a number of other approaches.
The fixed targets approach
Perhaps the best-known approach is that of Tinbergen (1952), the so-called fixed targets approach, which establishes the condition for the simultaneous achievement of fixed target values for a number of objectives. Tinbergen’s rule states that if these target values are to be achieved simultaneously, then there must be at least the same number of instruments as there are objectives. The values of these instruments are determined by the desired-target values of the objectives, and they can then be assessed to see whether they are both feasible and acceptable to the decision-makers.
This rule can be illustrated in Fig. 30.1 where, for simplicity, the two-instrument/two-objective case is illustrated. Instruments I1 (monetary policy) and I2 (fiscal policy) are plotted on the axes of the graph. Movements along each axis and away from the origin will be used to indicate ‘expansionary’ policy. On the horizontal axis, for example, close to the origin we have ‘tight’ fiscal policy, with high taxation and low government expenditure. Movement along the
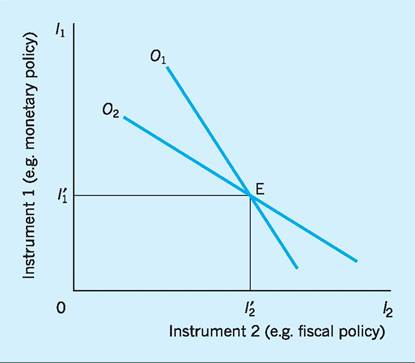
Fig. 30.1 Two-instrument/two-objective case.
Notes:
O1 = Objective 1 (internal balance) at a particular target value. O2 = Objective 2 (external balance) at a particular target value.
11 = Instrumental variable 1, e.g. monetary policy.
12 = Instrumental variable 2, e.g. fiscal policy.
horizontal axis and away from the origin indicates that fiscal policy becomes ‘easier’, with taxation falling and government expenditure rising. The Budget moves from surplus into deficit, with the deficit becoming greater as the movement to the right continues. On the vertical axis, points close to the origin indicate restrictive monetary policy, with high interest rates and static, or slowly growing, money supply. Movement along the vertical axis and away from the origin indicates an expansionary monetary policy, the money supply rising rapidly and interest rates falling.
The line O1 shows the combinations of monetary and fiscal policy required to achieve the objective of internal balance, i.e. full employment (or something very close to it) with price stability (or a low and acceptable rate of inflation). O1 will be negatively sloped, on the assumption that expansionary fiscal policy must be accompanied by contractionary monetary policy, if full employment is to be achieved without price inflation. If contractionary monetary policy did not accompany the expansionary fiscal policy then too high a level of aggregate demand would be generated, and with it price inflation.3
The line O2 shows the combinations of monetary and fiscal policy required to achieve external balance, i.e. balance of payments equilibrium. It, too, is negatively sloped, reflecting the fact that expansionary fiscal policy raises domestic incomes, so increasing imports (and perhaps reducing exports). If balance of payments equilibrium is to be maintained, then these unfavourable effects on the current account must be offset by an improvement elsewhere in the accounts. This could be achieved by a contractionary monetary policy, which raises interest rates, attracting inflows of capital from overseas. Again, if fiscal policy is expansionary, a contractionary monetary policy will be necessary to preserve the external balance.4
Figure 30.1 shows that with two objectives (internal and external balance) and two instruments or instrumental variables (monetary and fiscal policy) then, by setting monetary and fiscal instruments at values I'1 and I'2 respectively, objectives O1 and O2 can be achieved simultaneously.5 Tinbergen’s rule is thereby illustrated.
Suppose now a third objective is added, perhaps a target rate of economic growth (Fig. 30.2). The line O3 shows the combinations of monetary and fiscal policy required to achieve this target rate of economic growth. O3 is positively sloped, on the assumption
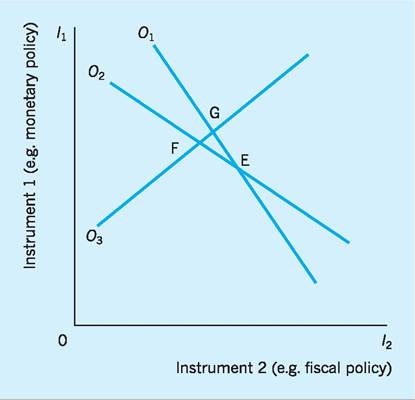
Fig. 30.2 Two-instrument/three-objective case.
that an expansionary fiscal policy, involving extra government spending, will ‘crowd out’ private sector investment. Total investment can then be kept at the level required to achieve growth rate O3 only by encouraging private sector investment through low interest rates, i.e. by expansionary monetary policy. Expansionary fiscal and monetary policy are in this case required to achieve the target rate of economic growth O3.
We can now see that it would be a fortunate and unlikely coincidence if O3 happened to pass through point E, i.e. if all three objectives could be achieved with just two policy instruments. If, as in the figure, it does not, then we can only achieve two of the three objectives with our two policy instruments. For instance, we could be at G (O1 and O3 achieved, but not O2) or at F (O2 and O3 achieved, but not O1) or at E (O1 and O2 achieved, but not O3). To achieve the third objective now requires a third policy instrument, perhaps exchange rate policy!6 If we cannot find extra policy instruments, Tinbergen’s rule will be violated, i.e. there will be fewer instruments (here two) than objectives (here three). Except in the fortuitous case that all three objectives intersect, at G, F or E, then an explicit choice will have to be made between the conflicting objectives. In our example we must choose between G, F or E.
Tinbergen’s approach has the great merit of being fairly simple to understand. It has encouraged governments to be explicit about their macroeconomic objectives and has stimulated the search for new policy instruments, such as flexible exchange rates or prices and incomes policy. Its emphasis on ‘fine-tuning’ the economy by introducing additional policy instruments, and changing their values, reflects the spirit of ‘Keynesian’ interventionism.
The variable targets approach
In Tinbergen’s approach, when we were unable to achieve all three objectives simultaneously because we lacked sufficient policy instruments, the target then became the achievement of any two, i.e. at G, F or E in Fig. 30.2. A choice had to be made between these alternatives. In contrast, Theil (1956) suggested that the target could be more flexible, and that any position could be chosen within the triangle GFE. In this case, no single objective is achieved; instead a compromise between the three is reached, all three being ‘missed’, but by a narrow margin in each case. This might be preferred to achieving two objectives by missing the third by a considerable margin.
Theil’s flexible targets approach therefore presupposes that since all the objectives cannot be met there must be some ‘welfare loss’ whatever choice of objectives is made. This approach also assumes that a social welfare function can be defined for society as a whole, the aim then being to minimize the welfare loss for any choice made. The welfare function will take into account the deviation between the actual value achieved for any objective and its target value, with any such deviation indicating a loss of welfare. The problem then becomes one of minimizing a welfare loss function bearing in mind that the objectives are presumably ‘weighted’ with respect to each other. For example, in the early 1980s a deviation between the actual and target inflation rate would appear to be weighted more heavily than a deviation between the actual and target unemployment rate. Weights W1, W2 and W3 are introduced into the welfare loss function to be minimized below. The deviations between actual and target levels are conventionally squared in order to eliminate the problem of sign.
It follows that if the three objectives have actual values O1, O2 and O3, and target values 0’1, 0’2 and 0’3, then the policy-makers would seek to minimize the social welfare loss function defined in terms of those three objectives, i.e.
Minimize U(O1, O2, O3)
= W1(O1 - O1)2 + W2(O2 - O2)2 + W3(O3 - O3)2
If there had been sufficient instruments to permit the simultaneous achievement of all three objectives, then O1 = O’i, O2 = O’2 and O3 = O’; in other words, the welfare loss function would equal zero. In terms of Fig. 30.2 all three objective functions (O1, O2 and O3) have coincided at a single point. More sophisticated forms of such functions recognize that it is not only the extent to which the target objectives are fulfilled that matters, but also the values of the instrumental variables themselves. For example, high tax rates or higher interest rates may themselves reduce social welfare and might therefore be included in the loss function.
No-one would suggest that political decisionmakers study loss minimization functions of the form indicated above, but the approach is helpful in suggesting that attempts should be made to think seriously about the relative weights given to objectives, and that if fixed target values are unattainable then flexibility might have to be accepted.
The ‘satisficing’ approach
Both the Tinbergen and the Theil approaches suggest that the economy is ‘fine-tuned’ by the policy-makers, i.e. instruments are continuously manipulated in order to achieve target welfare-maximizing (or lossminimizing) values. Mosley (1976) pointed out that in practice policy instruments are periodically manipulated, usually all at once, in response to a crisis. He has proposed a ‘satisficing’ theory of economic policy, which views the policy-maker as a ‘satisficing’ agent, i.e. one whose motive is not to achieve the best possible states at all times, but to achieve ‘satisfactory’ levels of performance. These ‘satisfactory’ levels are influenced, in the case of macroeconomic objectives, by recently achieved performance and are determined by compromise bargaining between such institutions as the Bank of England, the Treasury and the Cabinet. He suggests that a package of instruments will be used in order to respond to a ‘crisis’, which might be an unsatisfactory level of performance with respect even to one objective, with the strength of the response depending upon the amount by which the actual value differs from the ‘satisfactory’ level.
Testing the satisficing approach for the period 1946-71, Mosley found that any balance of payments deficit triggered a response - in other words, only a zero or positive balance was regarded as ‘satisfactory’. However, the unemployment figure considered ‘satisfactory’ varied over the years, following a rising trend. In 1953 it was below 1.6%, in 1965 below 2.5%, and by 1971 below 3.6%. Should a figure of below 5% be considered ‘satisfactory’ in the early years of the new millennium?
The fixed and flexible targets approaches to macroeconomic policy predict that policy-makers will seek to find new and effective instruments of policy in order simultaneously to achieve a growing number of economic objectives. If that search is not successful, then compromises between the target values of the objectives will be sought; more pragmatically, the policy-makers will accept quite broad ranges of values for the objectives and will intervene only when one (or more) of the target values becomes ‘unsatisfactory’. In this last, ‘satisficing’, case the economy is ‘managed by exception’.
Until the mid-1970s this reflected the interventionist ‘Keynesian’ approach which prevailed in the UK after the Second World War. Target values and achieved values for the objectives rarely diverged significantly, and it was generally accepted that policymakers, armed with the predictions of increasingly sophisticated forecasting models of the economy, and using an increasing range of instrumental variables, could and should manage the economy by ‘fine-tuning’ it on to a desired path. However, as the 1970s progressed, the fine tuning and satisficing approaches to policy-making were being replaced by theories which began stressing the inherently stable nature of the economy. These advocated the need to set ‘rules’ which policy-makers should follow in the medium term, instead of concentrating on short-term interventionism.
The Cambridge Economic Policy Group (CEPG) approach
The CEPG differed from traditional Keynesians in seeing fiscal policy as possibly contributing to the balance of payments problem rather than correcting it. They identified a strong link between the balance of payments on current account and the size of the public sector surplus/deficit.
In the conventional manner let:
I = investment expenditure,
G = government expenditure,
X = exports,
S = savings,
T = taxation receipts,
M = imports.
Then, for equilibrium:
I + G + X = S + T + M
Rearranging,
X - M = S - I + T - G
i.e. the surplus on the balance of payments current account is, by definition, equal to the private sector surplus (S - I) plus the public sector surplus (T - G).
The private sector surplus is the sum of household and company net savings and this, it is claimed, is so small that it can be ignored. Household saving in the UK is normally balanced by investment in housing (channelled by building society deposits), and company saving is the major source of company investment. That being so, then:
S - I ≈ 0
and
X - M ≈ T - G
i.e. the balance of payments current account surplus/ deficit is approximately equal to the public sector surplus/deficit, and changes in the latter will lead to approximately equal changes in the former. The explanation is that the effect of expansionary fiscal policy will be to raise incomes and imports faster than exports.
The policy implication of the approach typified by the CEPG was that an expansion of domestic demand to alleviate unemployment must be accompanied by the use of import controls. If the expansion is not accompanied by import controls, then the balance of payments will rapidly move into a considerable deficit, with devaluation or depreciation of the exchange rate unable to correct the deficit. The favourable effects for employment of the expansionary fiscal policy will then be dissipated overseas as increased demand in the UK is met by increased purchases of foreign goods rather than domestically produced goods. Their reply to the argument that the imposition of import controls on the part of the UK would be met with retaliation from other countries is that the aim would not be to reduce the level of imports into the UK but to keep the level from rising. If no other country is harmed there will be no need for retaliation! In fact, any rise in UK exports might subsequently create scope for imports to rise.
We have already seen that economists supporting the CEPG analysis believe that ‘fine-tuning’ the economy by pursuing an interventionist policy is actually counter-productive and destabilizing. They believe that the economy is relatively stable in the medium term and that the most appropriate policy is to apply a ‘fiscal rule’ within the context of a medium-term strategy. This rule takes the form of a composite tax rate - the par tax rate - set at such a level that desired targets for National Income (employment) and the balance of payments can be achieved in the medium term. This rule should be adhered to, and the par tax rate altered, only if the target values are themselves altered, or if there are major disturbances in the world economy, or in the trade-off between the employment and balance of payments objectives.
The monetarists approach
Monetarists similarly eschew the use of an armoury of policy instruments (instrumental variables) to achieve macroeconomic objectives. The monetarist economists believe that if the money stock is increased, real output is not affected in the long run, though prices are, i.e. control of the money supply is the key to the control of inflation.7 They accept that in the short run changes in money supply will affect output as well as prices. However, there will be time-lags between the change in money supply and changes in output, making it inadvisable to use the manipulation of aggregate demand as a policy instrument for achieving target levels of output and employment. Output and employment will instead be determined at their ‘natural’ levels by microeconomic factors affecting aggregate supply. These are more easily influenced by measures designed to improve market efficiency or to increase the supply of factors of production.
Policy-makers are therefore encouraged to follow simple ‘rules’ which will influence the economy in the long run, and will not generally be subject to changes which might cause instability in the short run. The most obvious rule is to control the rate of monetary expansion, and to effect changes in it relatively gradually in order that disruption is not too great. To the monetarist, the target rate for monetary expansion (given flexible exchange rates) becomes the proxy for the target rate of inflation, so that the ‘target’ is now set in terms of the value of the instrumental variable (money supply) rather than in terms of the objective (inflation). Short-run manipulation of the instrument to achieve the target objective was regarded as neither necessary nor even possible. Instead, the authorities are to control inflation through the long-run rate of monetary expansion. A rule for policy is therefore established.
Supply-side strategy
Monetarists and ‘neoclassical’ economists generally have sympathy with the view that output and employment are supply-determined, rather than with the Keynesian view that they are demand-determined.
Figure 30.3(a) represents the familiar Keynesian view, with prices and output (real national income) being determined largely by changes in aggregate demand. Our main interest here is to contrast this familiar diagram with Fig. 30.3(b), which uses the same axes to reflect the monetarist or supply-side view of economics.
Keynesian versus supply-side/ monetarist approaches
In the Keynesian case, an increase in real output from Y1 to Y2 is most readily achieved by an increase in aggregate demand from AD1 to AD2. However, the supply-side view is that an increase in real output from Y1 to Y2 is more effectively achieved by a downward (rightward) shift of the short-run aggregate supply (SRAS) curve from SRAS1 to SRAS2. In the former case, the average price level is likely to rise as real output rises, while the supply-side approach predicts a fall in the average price level alongside a rise in real output.
In favouring the supply-side approach, Conservative governments of the 1980s argued that there were certain features of the UK economy which tended to prevent the supply curve shifting downwards from
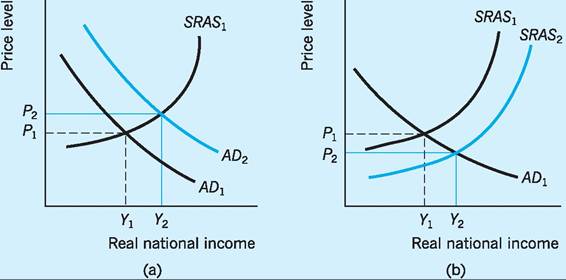
Fig. 30.3 (a) The Keynesian approach; (b) the supply-side approach.
SRAS1 to SRAS2. They felt that the main task of the government was to achieve such a downward shift in SRAS through ‘supply-side’ policies aimed at increasing productive efficiency in the economy. However, before we look at the various policies advocated since the early 1980s in support of this approach, it is useful to consider the factors which allegedly prevent the SRAS curve from shifting downwards.
First, there is the suggestion that unemployment and social security benefits encourage people to spend more time searching for the type of employment they consider appropriate. As a result, they remain on the unemployment register longer, the unemployment figures are swollen and aggregate output is restricted from the supply side. An ancillary argument is that the difference between some low-paid jobs and the rate of unemployment benefit is so marginal that such jobs are not taken up. This problem is aggravated by the UK tax system, which may result in some workers, previously unemployed, paying marginal tax rates in excess of 100% when moving into low- paid jobs - the ‘unemployment trap’ (see Chapter 23). Unemployment and social security benefits may in these ways cause the SRAS curve to remain at SRAS1 in Fig. 30.3(b), thereby preventing output from rising to Y2 and keeping the price level higher than it would otherwise be.
The second suggestion is that, quite apart from the ‘unemployment trap’, high taxation can affect the supply of labour (and so the level of output) through its disincentive effects. The reverse side of this is that a cut in taxes might so stimulate work effort that real output (and even total tax revenue) rises. In terms of Fig. 30.3(b) tax cuts would shift the supply curve to the right, i.e. from SRAS1 to SRAS2, so that output and employment would rise, and prices fall.
The third suggestion is that labour has priced itself out of the market, thereby reducing employment and output, because the trade unions have forced up the real wages of their members. It was estimated by Minford and Peel (1981) that unions had ‘marked up’ members’ wages by between 12% and 25%, so raising permanent unemployment figures by between 400,000 and 800,000, although more recent research has put the average mark-up at 10% or less. Another important study (Layard and Nickell 1985) showed that the unemployment rate in the UK had risen by 11.83 percentage points between 1956 and 1983 and that union ‘push’ on wages accounted for 2.27 of those percentage points. The policy implication is that trade union bargaining power should be curbed. In terms of labour market analysis, the market wage is kept above the equilibrium wage so that unemployment is higher than market conditions warrant. In terms of the goods market in Fig. 30.3(b), the relatively high labour costs tend to keep the SRAS curve artificially high at SRAS1. Output and employment are lower and prices are higher than they would otherwise be.
Finally, there is the suggestion that the very high unemployment and low output figures prevailing in the UK exaggerate the true situation because there is a considerable ‘hidden’ or ‘black’ economy, encouraged by a desire to evade taxation. Some of the ‘black’ economy would be conducted in monetary terms (e.g. payment in cash to a local handyman), some in non-monetary terms by means of barter. The ‘black’ economy has always been with us, and estimates as to its size vary from 2.5% of GDP (the gap between expenditure and declared income) to 7.5% (Inland Revenue estimates of tax evasion) and even to 15%. New estimates have indicated that the ‘black economy’ activity of self-employed people in the UK amounts to 10.6% of GDP.
As explained above, successive governments have implemented a wide range of measures consistent with the approach of supply-side economics (shown in Fig. 30.3 as a shift in the SRAS curve downwards to the right). We will briefly summarize some of the practical changes which have to be implemented in an attempt to increase the efficiency of markets.
Other supply-side approaches
Taxation
Successive governments have believed that the taxation structure has become distorted over the years and should be changed in order to create more incentives and to induce more output (supply) responsiveness. For example, the decrease in tax allowances on mortgages in the late 1980s from £30,000 per person to £30,000 per dwelling was partly designed to curb the amount of investment in housing and to stimulate investment in company shares, i.e. to channel investment into more productive forms which would help stimulate output. Similarly, tax relief on life insurance premiums had been abolished in 1984, in an attempt to encourage people to invest in company equities. Again the rate of Capital Gains Tax (CGT) had long been less than the basic rate of income tax, giving, for example, a better return to a person who bought and sold oil paintings than to a person buying company shares. In 1988 the CGT and the basic rate of income tax were equalized to prevent this bias. As well as bringing down personal taxation in order to stimulate incentives, successive governments have also decreased the standard rate of Corporation Tax for large companies, from 52% in 1983/84 to 30% by 2010; for small firms the rate was reduced from 35% to 19% in the same period. Those cuts in Corporation Tax were an attempt to stimulate reinvestment in capital stock.
Labour supply, efficiency and training
Successive governments have also believed in the need to improve the workings of the UK labour market, in order to make it more ‘efficient’ (i.e. labour should be mobile, well trained and free from institutional - e.g. union - bias). As far as mobility is concerned, the government felt that the UK labour market needed to be ‘flexible’, with workers induced to take up jobs rapidly. It was thought that this process was being inhibited by narrow differentials between the income of those out of work, thereby preventing active job search. Continuous adjustments have therefore been made in National Insurance benefits and income- related benefits over the past years, with the aim of widening the gap in income levels between those in work and those out of work.
To improve the institutional problems surrounding the labour market, successive Conservative governments introduced a series of laws to regulate employment and the trade unions. The Employment Acts of 1980, 1982, 1988, 1989 and 1990, together with the Trade Union Act of 1984, all of which were consolidated into the Trade Union and Labour Relations (Consolidation) Act of 1992, have weakened the control of unions (see Chapter 14).
In the area of training, one of the greatest problems for the UK has been the dearth of vocational skills at the intermediate level. As a result of these deficiencies, the UK government introduced a number of initiatives in the early 1990s. For example, by 1991 some 104 Training and Enterprise Councils (TECs) were in operation in Britain. These were independent business-led companies, funded by government, and charged with meeting the training, enterprise and vocational education requirements of local communities and employers. Similarly, the Technical and Vocational Educational Initiative (TVEI) was introduced in the early 1990s to influence the whole curriculum of schools and colleges to prepare pupils of 14-18 for the demands of working life. This process continued under the post-1997 Labour government. A new revised National Curriculum was introduced in September 2000 designed to make more explicit the links between education, employment and enterprise. Meanwhile, in the first few years of the new millennium, various strategies have been introduced to provide a better quality of work experience for pupils (Education-Business links), to encourage more entrepreneurial attitudes (National Enterprise Campaign), to improve management expertise (Council for Excellence in Management and Leadership), and to increase training initiatives (New Deal). All these policies were designed to focus on increasing the UK’s stock of ‘human capital’.
These types of initiatives continued with the creation of the Learning and Skills Council (LSC) in April 2001 and then to the Skills Funding Agency and the Young People’s Learning Agency in 2009. The Council was designed to raise participation in education and training and to enhance what came to be called Work Force Development (WFD), i.e. a desire to increase the capacity of individuals in the workplace. For example, the ‘Train to Gain’ service was introduced in the autumn of 2006 to help identify what skills businesses need. The LSC trains ‘skill brokers’ who help firms assess what skills are needed.
Arguably all these policies are designed to improve efficiency and help shift the supply curve downwards from S1 to S2 as in Fig. 30.3(b).
Global economic management: post ‘credit crunch’
Here we review some of the key events and policy responses across the global economy in the period since 2006/07.
Sub-prime market and the ‘credit crunch'
The term ‘sub-prime’ is widely used to refer to excessive lending for mortgage purposes in the US to low-income borrowers at high risk. When economic slowdown occurred in the US in 2006/07, many of these high-risk borrowers lost their jobs and/or found themselves unable to pay the higher monthly repayments as US interest rates rose substantially in 2006/07 (by around 4% in a little over one year). Nor did these low-income/high-risk borrowers have assets to help cushion falls in their current income. As a result, many have defaulted on their loans and the bad debt provisions of the lenders have soared, putting huge pressure on themselves and on other financial firms worldwide which have invested in them.
By late-2010, US house prices had fallen by 29%, and share prices by a similar amount, from their 2007 peak. A simulation by economists at the UBS bank suggests that a 10% drop in US house and share prices would reduce US economic growth by as much as 2.6 percentage points. This cut-back in projected economic growth was linked to the expectation of a significant fall in consumer spending in the US, given the reversal of the previous ‘wealth effect’ whereby higher house prices had played a key role in stimulating consumer borrowing and indebtedness. Indeed by late-2010 household wealth in the US had shrunk by $12 trillion, or by 18%, since 2007.
‘Contagion’ is a word much feared by analysts of the sub-prime market. Many innovative financial instruments developed and used (‘securitization’) to stimulate extra lending and borrowing are now viewed with much greater suspicion by the financial markets (see Chapter 21). Lending between financial intermediaries themselves has also diminished, as they have become more unsure of the true creditworthiness of the borrowers, given that there is now serious concern over the value of many of these new financial instruments in their portfolio. This reluctance of financial intermediaries to lend to each other was a key factor in the problems experienced by Northern Rock in the UK, whose business model depended on regular inter-bank loans which were no longer forthcoming. The share price of Northern Rock collapsed in late 2007, forcing the Bank of England to step in as ‘lender of last resort’ and to avoid a systemic banking failure in the UK.
Financial instruments and the ‘credit crunch'
The impacts of the housing market collapse on key financial instruments and markets are reviewed below. Many of these new financial derivatives and instruments had been widely traded across the world, and it has been the collapse in value of these widely held financial instruments which has been a root cause of many of the contemporary issues that have arisen within global finance and international trade. It may be helpful to illustrate these problems by using the market in a wide range of Structured Investment Vehicles (SIVs).
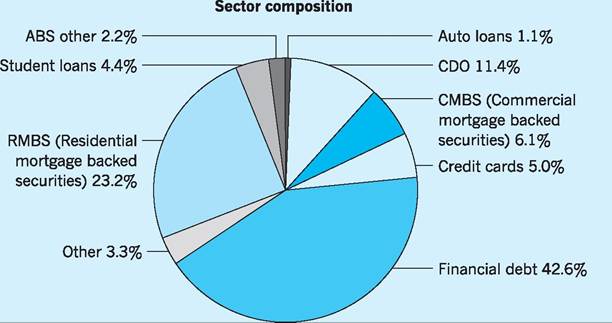
Fig. 30.4 Composition of a Structured Investment Vehicle (SIV).
Source: Wall, Minocha and Rees (2009) International Business (3rd edn), Financial Times/Prentice Hall.
Structured Investment Vehicles (SIV) market
These are the financial instruments that have emerged in recent years and which consist of not one but a variety of securities, some of which involve mortgage debt (see Fig. 30.4). Before reviewing the contribution of SIVs to current international financial developments, it will help to consider the so-called sub-prime market, and the impacts this has had on the value of SIVs, many of which involve a mortgage-backed ‘slice’ of their overall portfolio.
Problems in this market for SIVs and associated financial instruments such as Collateralized Debt Obligations (CDOs) have played a key role in the events unfolding globally over recent years. It has been the inclusion of (collapsing) mortgage backed assets in the composition of these financially engineered instruments, and the uncertainties as to future return to ‘health’ of the housing market, that has led
Structured Investment Vehicle (SIV)
1 A structured investment vehicle (SIV) exists to help those acquiring it make a profit from the difference between the low cost of short-term debt funding and the higher returns, or yields, of longer term debt investments.
2 A SIV consists of a pool of debts of financial companies, such as banks and insurers, including asset-backed securities, or bonds, backed
by mortgages, loans or other debt (see Fig. 30.4).
3 The SIV funds these more profitable longer term investments by issuing debt itself. A small portion of this debt (between 5 and 12 per cent) is longer term and carries the first risk of losses if assets in the pool of investments start to go bad. This debt is also the last to be repaid, but it shares some of the profits made by the vehicle. This is the junior debt, otherwise known as the capital notes.
4 The lion’s share of debt issued by the SIV is very low-cost short-term commercial paper, which has a lifespan of days or weeks, and medium-term notes, which have a lifespan of three to six months. This is the senior debt.
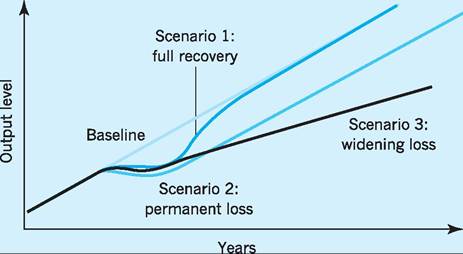
Fig. 30.5 Scenarios for economic recovery.
to the ‘junk bond’ status of many of these instruments, with seriously damaging effects on the balance sheets of major organizations.
Recovery scenarios
Pimco, the largest global bond manager - based in California - held its five-year planning meeting in May 2009 and predicted that financial markets will ‘return to mean’. However, what exactly is meant by ‘mean’ or ‘normal’? Is the ‘new normal’ a global economy with low growth and high unemployment and a different financial system, or are we to return to previous growth paths and ‘business as usual’? Figure 30.5 presents three alternative scenarios.
Milton Friedman used US time-series data to suggest that Scenario 1: full recovery is the most likely. His analogy involved using a string stretched taut/ tightly on a board; the more forcefully the string is plucked, the more rapidly it snaps back! Friedman noted that deep recessions are often followed by strong recoveries and a return to the original growth path. However, others see different recovery scenarios. For example, Scenario 2: permanent loss sees no recovery back to the original growth path, though the growth rate might return to the previous level (parallel to Scenario 1) but on a lower trajectory. Scenario 3: widening loss sees even a return to the previous growth rate as unlikely so there is an ever widening loss of output.
Empirical evidence would seem to suggest that Scenarios 2 and 3 are the most likely outcomes. An IMF survey (World Economic Outlook 2009) identified 88 banking crises over the past 40 years and found that, on average, seven years after the deepest point of the recession, an economy’s level of output was still around 10% below what it would have been without the banking crisis. This is also borne out by the Japanese experience where output in the period 1992-2005 was estimated at being some 25% below trajectory in 2005, i.e. below what the 2005 output would have been had the 1992 recession not occurred!
A suggestion is often made that the current financial crisis is more damaging than many of its predecessors because the overvalued assets of individuals and organizations in 2007 were accompanied by huge debts/liabilities. The result of this is that the value of liabilities is likely to exceed the value of assets for many years, even after recovery has begun! The legacy of such huge past losses can depress future gains on the balance sheet - additional income going forward being used to restore the balance sheets rather than to be used for new lending.
The future recovery scenarios may depend on the response of consumers to the financial crisis. The US saving rate averaged over 8% in the period 1962-67, but had fallen to only 2.7% in the period 2001-07, rising to around 5% in the period 2008-11 (see Fig. 30.6).
We can see from Fig. 30.6 that net worth had risen dramatically from 500% of annual disposable personal income in 2002 to 650% in 2006, i.e. in only four years, before falling again to around 460% in 2009/10. Such increase in wealth is seen by many as a reason for the continued fall in the US savings ratio
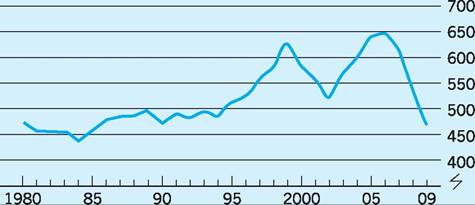
Fig. 30.6 US household net worth as % of disposable personal income. Source: US Federal Reserve (various).
(see also Chapter 16). Between 2007 and 2010 as many as 30% of US mortgage holders owed more than their homes were worth on the market - i.e. negative equity. In fact the US savings ratio is already rising, from 2.7% in 2006 to over 5% in 2010 and is continuing to rise. A key question is whether US consumers will eventually resume the growth in spending of a few years ago or continue to spend progressively less.
China is an obvious possible source of consumption growth for the global economy (see also Chapter 28), given that it has a substantial balance of payments surplus with the rest of the world. However, the savings ratio in China has been estimated at close to 50% of GDP, when household, company and government savings are aggregated.
Global budgetary problems and the ‘credit crunch'
There has been an increasing awareness by governments of the need to reduce government expenditure as a proportion of national income. This concern is common to many countries which have attempted to avoid the recessionary impacts of falling consumer expenditure associated with the ‘credit crunch’ by increasing government expenditures or reducing government revenues via taxation.
The G20 group of major developed economies all face problems of rapidly increasing public sector deficits as they seek to stimulate their economies in response to the ‘credit crunch’. As can be seen in Table 30.1, the National Debt (what the government owes its creditors) of the G20 countries is to rise from 100.6% of G20 GDP in 2009 (it had only been 79% of G20 GDP in 2007) to almost 120% of GDP in 2014.
Table 30.1 Percentage of GDP.
| Country | National Debt 2009 | National Debt 2014 | Budget deficit1 2009 | Budget surplus required2 in 2014 |
| United States | 88.8 | 112.0 | -12.3 | 4.3 |
| Japan | 217.4 | 239.2 | -9.0 | 9.8 |
| Germany | 79.8 | 91.4 | -2.3 | 2.8 |
| France | 77.4 | 95.5 | -5.3 | 3.1 |
| Britain | 68.6 | 99.7 | -10.0 | 3.4 |
| G20 | 100.6 | 119.7 | -8.6 | 4.5 |
1Before interest payments.
2To keep debt under control.
Source: IMF, World Economic Outlook (various).
This increase in National Debt is, of course, the consequence of increased government spending and/or reduced tax revenues from attempts to stimulate national economies. But it is not just fiscal policy but monetary policy too which has contributed to the sharp rise in National Debt. ‘Quantitative easing’ in the UK, for example, refers to increases in the money supply, often involving the purchases of government debt such as Treasury bills, with cheques drawn on the government itself. This has increased cash and liquidity for the financial institutions and for individuals selling their bills and bonds, but also increased the National Debt!
Other increases in the National Debt have involved sharply increased expenditures by government departments on a wide range of projects to stimulate their respective economies.
The table also shows the average budget deficit (G > T) for the G20 countries, recorded at -8.6% of GDP in 2009, a figure significantly higher than the average -1.1% of GDP recorded as recently as 2007 for the G20. This captures both the sharp rise in government spending on ‘bail outs’ and other activities to stimulate domestic economies and also the fall in revenues from tax cuts also aimed at stimulating domestic economies. For example, VAT was temporarily cut from 17.5% to 15% in the UK for a 12-month period in 2009/10.
The table also shows the projected budget surplus required of the G20 countries by 2014 in order ‘to keep public debt under control’, defined here as bringing the respective national debts back to a maximum of 60% of GDP by 2014. The size of this task can be gauged by the fact that an average annual budget surplus of +4.5% will be required by 2014 to achieve this across the G20 countries, as compared to the average annual budget deficit of -8.6% in those countries in 2009. It will be a major challenge for many countries to achieve such a turnaround; for the US it will require the budget deficit of -12.3% in 2009 to be transformed to a budget surplus of + 4.3% by 2014, and for the UK it will require the budget deficit of -10.0% in 2009 to be transformed to a budget surplus of +3.4% by 2014.
Whatever governments are in power in the various G20 countries, such a dramatic transformation in their budgetary situations in less than five years will require sharp reductions in public expenditure and/or increases in taxation.
Stimulus packages
The G20 countries have tried to stimulate their economies by various fiscal and monetary policies. As we noted above, expansionary fiscal policies have led to a ‘debt overhang’ which may create problems for global recovery in the coming years. As well as expansionary fiscal policies used to stimulate the economies during recession, many governments have also adopted expansionary monetary policies. ‘Quantitative easing’ has been reviewed elsewhere (e.g. Chapter 20 and Chapter 21) but is essentially an increase in the money supply, which is usually associated with lower interest rates and a lower exchange rate (see Chapter 25).
Sovereign wealth funds (SWFs) and sovereign debt
A new emphasis in financial risk management is being placed on sovereign debt ratings, linked closely to the growth of sovereign wealth funds (SWFs). These are government owned investment vehicles managed separately from the official reserves of the country. They have usually been accumulated by those governments as the result of high global commodity prices for their exports. High energy (e.g. oil), food and other primary product prices over recent years have meant that an estimated $5,000bn is now available for potential investment by countries such as the United Arab Emirates, Saudi Arabia, Dubai, Kuwait, China, Norway, the Russian Federation and Singapore, amongst others. The SWFs will often be invested in projects with higher risks but higher expected future returns. Professional portfolio management techniques are often adopted with a view to generating a sustainable future income stream via investments in bonds, equities and other assets. In 2009 Barclays Bank raised $7bn of funds from this source rather than accept UK government funding to help it cope with the liquidity crisis of the ‘credit crunch’. In 2010 there were 70 SWFs in 44 countries with assets ranging in value from $20m (Sao Tome and Principe) to more than $500bn in the United Arab Emirates.
Sovereign debt ratings
There has been much criticism of the credit rating agencies as regards their giving high (triple A) ratings to financial institutions found to be anything but credit-worthy as events in the sub-prime market unfolded! Investors who subsequently lost huge amounts of money complained that they had been misled by the AAA ratings that the agencies had handed out on complex packages of mortgage-related debt. The critics further argue that there is a clear conflict of interest when the credit rating agencies are themselves paid by the issuers to assess their bonds and other debt instruments.
Investor attention has now shifted to sovereign debt risk, and the three big agencies (Fitch, Moody’s and Standard & Poor’s) again find themselves at the centre of attention. Sovereign debt upgrades actually exceeded downgrades in every year between 1999 and 2007, but that has changed as a result of the financial crisis and over the period 2008-10 sovereign debt downgrades exceeded upgrades by a ratio of 7:1, the exact reverse of previous experiences.
The workings of the financial system make these ratings even more important; for example, should any EU country be downgraded below A-, then that country’s bonds become ineligible for use as collateral by the European Central Bank (ECB) under the tighter ECB rules from the end of 2010. This concern was a key factor in persuading the Greek government to accept austerity measures as a condition for the huge ˆ110bn support for its currency from the EU and IMF in 2010. Without such support, a downgrade would have been inevitable. Politicians also place great emphasis on such ratings. Tim Geithner, the US Treasury Secretary, claims that America will ‘never’ lose its AAA mark. Political parties in the UK have also promised to defend its AAA rating.
Over the long term, the ratings of most developed nations have been remarkably stable. No country rated AAA, AA or A by S&P has gone on to default within a subsequent 15-year period. Indeed, nearly 98% of countries ranked AAA were either at that rating, or the AA level, 15 years later. That stable record may not persist. Investors have been buying government debt for years in the belief it is ‘risk-free’, almost regardless of the economic fundamentals. But if they lose faith in a government’s policies, the situation can change very quickly. Such concerns are especially true since sovereign debt has increased from 62% of world GDP in 2006 to over 85% in 2010.
Some, however, argue that governments and investors place too much importance on credit rating. Canada lost its AAA rating in the 1990s, but then regained it during the past decade, while Japan managed to keep borrowing at a cheap rate, despite losing its triple AAA rating.
The agencies are well aware that ratings changes are highly sensitive. Decisions are therefore made by committee, rather than by an individual, to reduce the scope for outside pressure. Consensus is generally sought before a downgrade is made. The agencies also seek to protect themselves from criticism by being as transparent as possible.
A number of factors help determine whether a country’s AAA status can be maintained, including economic and institutional strength, the government’s finances and susceptibility to specific shocks. Others argue that the key ratio is not debt-to-GDP but interest payments as a proportion of government revenues. Once that gets beyond 10%, a government may face difficulties.
That does not mean a downgrade is inevitable, however. If the government is implementing a credible plan to cut its deficit, then it may maintain its AAA status. Agencies may also have to make qualitative judgements about a range of other factors, e.g. the willingness of eurozone countries to bail out countries such as Greece when they enter financial difficulties!
Key points
■ Macroeconomic policy seeks to achieve various target values as regards objectives such as employment, prices, economic growth and the balance of payments.
■ To achieve such ‘target values’, governments use various policy instruments, such as fiscal and monetary policy, prices and incomes policy, exchange rate policy and import controls.
■ Governments often find that there are complex linkages between policy objectives and policy instruments.
■ Tinbergen’s fixed target approach emphasizes that there must be at least as many policy instruments as policy objectives if target values for a number of objectives are to be achieved simultaneously.
■ Theil’s flexible target approach suggests that no exact target value can be achieved for any single objective or group of objectives. Instead policy instruments are geared to minimizing the (squared) deviations between the actual and target value for one or more objectives in order to minimize overall welfare loss.
■ The ‘satisficing’ approach of Mosley moves away from the fine-tuning of Tinbergen and Theil, and suggests that ‘satisfactory’ rather than optimum levels of performance should be the aim of macroeconomic policy.
■ Macroeconomic policy in the pre-1974 period largely followed Keynesian principles, i.e. managing demand mainly through fiscal policy, allied occasionally to prices and incomes policies.
■ Macroeconomic policy after 1974 often moved away from such Keynesian ‘fine tuning’ and towards the use of ‘rules’, following a more monetarist standpoint.
■ Macroeconomic policy has also involved improving the responsiveness of the economy by concentrating on the supply side of the economy, for example by adjusting tax rates and improving labour efficiency and training.
■ The global economic crises triggered by the collapse of the sub-prime market, have led to major fiscal and monetary expansion in many countries as governments sought to avoid the worst impacts of the credit crunch on their levels of output and employment.
■ The major budgetary deficits have resulted in sharp increases in National Debt for many countries and to current attempts to restore the ‘health’ of their public finances.
■ The growth of sovereign wealth funds (SWFs) brings a new factor into the equation for managing economies which might be the recipient of major capital inflows or outflows of such funds.
■ Sovereign debt ratings by credit agencies are of increasing importance, when national (as opposed to corporate) downgrades can have major impacts on economies such as Greece and Spain.
Now try the self-check questions for this chapter on the Companion Website. You will also find useful links to relevant websites.
Notes
1 That is, provided the Marshall-Lerner condition is satisfied, with the sum of price elasticity of demand for UK exports and price elasticity of demand for imports into the UK greater than unity.
2 For instance, in Chapter 20 we noted that the money supply, M, times the velocity of circulation of money, V, would give the monetary value of spending.
3 If points on O1 indicate internal balance, then points off it indicate imbalance. Check that above and to the right of the line there will be inflation, whereas below and to the left there will be unemployment.
4 Similarly, if points on O2 indicate external balance, then points off it indicate imbalance. Check that a balance of payments surplus will occur below and to the left of the O2 line, and a deficit above and to the right.
5 Provided that O2 and O1 cross! Economic objective O2 is shown as having a shallower slope than O1. Can you see why? Start at E, and move up the O1, line; expansionary monetary policy reduces interest rates, so that the shortterm capital inflow will diminish, and the balance of payments will deteriorate. To keep it in balance, a lower National Income would be necessary in order to reduce the import flow. This could be achieved by contractionary fiscal policy, i.e. above E, O2 must lie to the left of O1.
6 If the exchange rate is lowered then O2 might shift to the right and so pass through point G (which had previously been a balance of payments deficit position). All three objectives are now achieved.
7 If M.V = P.T, the equation of exchange where M = money supply, V = average velocity of circulation of money, P = average price level and T = volume of transactions, then, if both V and T are fixed (or change at a known rate), money supply M directly affects price level P. So ∆M = ∆P, and the inflation rate is determined by the growth of the money supply.
References and further reading
Allsopp, C. (2002) Macroeconomic policy rules in theory and in practice, Bank of England Quarterly Bulletin, 42(4): 485-504.
Balls, E., Grice, J. and O’Donnell, A. (2004) Microeconomic Reforms in Britain, Basingstoke, Palgrave.
Bank of England (2010) Quantitative Easing Explained, pamphlet, London, 1-14.
Barrell, R. and Gottschalk, S. (2004) The volatility of the output gap in the G7, National Institute Economic Review, 188(1): 100-7.
Beath, J. (2002) UK industrial policy: old tunes on new instruments?, Oxford Review of Economic Policy, 18(2): 221-39.
Benassy-Quere, A. and Coeure, B. (2010) Economic Policy, New York, Oxford University Press.
Bray, J., Kuleshov, A., Uysal, A. and Walker, P. (1993) Balance-achieving policies: a comparative policy-optimization study on four UK models, Oxford Review of Economic Policy, 9(3): 69-82.
Britton, A. (2002) Macroeconomics and history, National Institute Economic Review, 179(January): 104-18.
Cowling, K. and Sugden, R. (1993) Industrial strategy: a missing link in British economic policy, Oxford Review of Economic Policy, 9(3): 83-100.
Dungey M., Fry, R., Gonzales-Hermosillo, B. and Martin, V. (2011) Transmission of Financial Crises and Contagion, Oxford, Oxford University Press.
Giavazzi, F. and Blanchard, O. (2010) Macroeconomics: A European Perspective, Harlow, Financial Times/Prentice Hall.
Gnos, C. (2009) Monetary Policy and Financial Stability, Cheltenham, Edward Elgar.
Griffiths, A. (2001) The government’s fiscal rules: origins, development and problems, British Economy Survey, 31(1): 17-20.
Healey, N. (1990) Mrs Thatcher’s fight against inflation: ten years without cheer, Economics, 26(1): 28-56.
Heibling, T. and Wescott, R. (1995) The global interest rate, Staff Studies for the World Economic Outlook, September, Washington DC, International Monetary Fund.
HM Treasury (2002) Reforming Britain’s Economic and Financial Policy, Basingstoke, Palgrave Macmillan.
Hudson, S. and Fisher, P. (1994) Monetary policy in the United Kingdom, Economics and Business Education, II, part 2, no. 6, Summer, 79-83. IMF (1996) World economic situation and short term prospects, World Economic Outlook, May, Table 2, Washington DC, International Monetary Fund.
IMF (2009) World Economic Outlook 2009: Crisis and Recovery, Washington DC, International Monetary Fund.
Krugman, P. and Obstfeld, M. (2010) International Economics: Theory and Policy, Harlow, Financial Times/Prentice Hall.
Layard, R. L. and Nickell, S. (1985) The causes of British unemployment, National Institute Economic Review, 111, February, 62-85.
Lyssiotou, P., Parshardes, P. and Stengos, T. (2004) Estimates of the Black Economy based on consumer demand approaches, Economic Journal, July, 622-40.
Mercier, P. and Papadia, F. (2011) The Concrete Euro: Implementing Monetary Policy in the Euro Area, Oxford, Oxford University Press.
Minford, P. and Peel, D. (1981) Is the government’s economic strategy on course?, Lloyds Bank Review, 40, April, 1-19.
Mosley, P. (1976) Towards a satisficing theory of economic policy, Economic Journal, 86, March, 59-72.
Newman, S., Rickert, C. and Schaap, R. (2011) Investing in the post-recession world, Harvard Business Review, January-February, 150-5. O’Mahony, M. (1998) Britain’s Relative Productivity Performance 1950-1996: Estimates by Sector, September, London, National Institute of Economic and Social Research.
Oulton, N. (1995) Supply side reform and UK economic growth: what happened to the miracle?, National Institute Economic Review, 154, November, 53-70.
Performance and Innovation Unit (2001) In demand: adult skills in the 21st century, Performance and Innovation Unit Report, November, Fig. 12, London, Cabinet Office. Savage, D. (1982) Fiscal policy, 1974/751980/81: description and measurement, National Institute Economic Review, 99, February, 85-95. Sentance, A. (1998) UK macroeconomic policy and economic performance, in Buxton, T., Chapman,
P. and Temple, P. (eds), Britain’s Economic Performance (2nd edn), London, Routledge.
Steedman, H., McIntosh, S. and Green, A. (2004) International Comparisons of Qualifications: Skills Audit Update, Research Report, RR 548, London, Department for Education and Skills. Theil, H. (1956) On the theory of economic policy, American Economic Review, 46, May, 360-6.
Tinbergen, J. (1952) On the Theory of Economic Policy, Amsterdam, North-Holland Publishing Co. Trade and Industry Committee (1994) Competitiveness of UK Manufacturing Industry, Second Report, House of Commons, April, London, HMSO.
UNCTAD (2010) Trade and Development Report 2010: Employment, Globalization and Development, New York and Geneva, United Nations Conference on Trade and Development. UNCTAD (2010) World Investment Report 2010: Investing in a Low Carbon Economy, New York and Geneva, United Nations Conference on Trade and Development.
UNDP (2010) Human Development Report 2010: The Real Wealth of Nations: Pathways to Human Development, New York, United Nations Development Programme.
Wall, S., Minocha, S. and Rees, B. (2009) International Business (3rd edn), Harlow, Financial Times/Prentice Hall.
World Bank (2010) World Development Report 2010: Development and Climate Change, Washington DC.
World Economic Outlook (2009) Financial crises tend to have long impact on the economy, IMFSurvey Magazine: IMF Research, 22 September.
Wyplosz, C. (2005) Fiscal policy: institutions versus rules, National Institute Economic Review, 191(1): 70-84.