Growth and development
The focus of this chapter is on the issues of economic growth and development, taking further some of the issues already touched on elsewhere (e.g. Chapters 24, 26, 28 and 30). After reviewing the theoretical basis for economic growth and development in all countries, these principles are then applied to the issue of sustainability and to the particular circumstances of the so-called less developed countries (LDCs).
It is now acknowledged that political, social, historical and cultural factors work alongside the economic factors when LDCs go through a process of growth and structural change. Although this chapter will focus on the economic issues, reference will be made on occasions to these broader issues. The nature and causes of poverty amongst the nations are very complex, and the remedies are neither easy nor quick. An analysis of the major features of LDCs will shed some light on the peculiar economic and social conditions of production, consumption and distribution of income and wealth which exist in LDCs. This will help us to understand some development approaches and their policy implications. The causes and consequences of the breakdown in the global trade talks at Doha in 2006 are reviewed, as is the ‘debt crisis' facing many LDCs as well as the policy responses of the IMF and other international institutions.Theories of economic growth
It will be useful at the outset to review the classical, neo-classical and modern theories of growth.
Classical growth theory
The ‘subsistence real wage’ rate plays a key role in classical growth theory, i.e. the minimum real wage rate required to maintain life. Whenever the actual real wage exceeds the subsistence real wage, then population grows and this, combined with diminishing returns to labour, ensures that the actual real wage rate falls back to the subsistence level.
On the other hand, when the actual real wage falls below the subsistence real wage, then lives are lost and the population declines until the actual real wage rises to the subsistence level. The discouraging prediction of the classical growth theory (Fig. 29.1) is that whatever the increase in levels of investment or the improvements in technology, the long-run growth rate is effectively zero, since equilibrium will only occur with living standards at the subsistence real wage.In Fig. 29.1 an increase in capital equipment and/ or technical change increases the labour marginal revenue product of labour (see Chapter 14, p. 286) and therefore the demand for labour increases from LD1 to LD2. The real wage rises from Ws to W2 in the short run, but the increase in population and labour supply to LS2 in the long run reduces the real wage rate, which then falls back to the original subsistence level Ws. This rather dismal prospect was emphasized by analysts of the time such as Thomas Malthus.
Population and natural resources
Thomas Malthus (1766-1834) claimed that the human population would, left unchecked, grow exponentially (in a geometric progression). However, food production would grow only linearly (in an arithmetic progression), restricted by the need to bring new, less productive land into cultivation (an earlier forerunner of the theory of diminishing returns). Population would therefore double every 25 years and food production would be unable to keep pace. Periodic famines and high infant mortality, together with occasional wars, were seen by Malthus as the most likely ‘checks’ to population explosion. Malthus noted that even in nineteenth-century Britain, food production was already falling short of population growth, as evidenced by the high price of bread and increasing public expenditure on relief of the poor.
Malthus failed, however, to perceive that population growth has turned out to have an internal check: as people grow richer and healthier, they have smaller families.
Indeed, the growth rate of the human population reached its peak of more than 2% a year in the early 1960s. The rate of increase has been declining ever since. It is now 1.26% and is expected to fall to 0.46% in 2050. The United Nations has estimated that most of the world’s population growth will be over by 2100, with the population stabilizing at just below 11 billion. Malthus also failed to take account of developments in agricultural technology. These have squeezed more and more food out of each hectare of land. It is this application of technology and human ingenuity that has boosted food production, not merely in line with, but ahead of, population growth.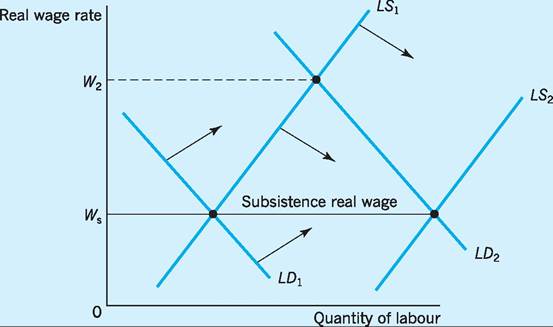
Fig. 29.1 Classical growth theory.
Neoclassical growth theory
Later analysts such as Solow (1957) and Denison (1967) used the production function (relating output to capital and labour inputs respectively) to argue that technical change and additional investment capital could indeed raise national growth rates. However, there is no reason why technical change should be anything other than a chance event under neoclassical growth theory, so that there is no prediction that growth can be sustained over time. The neoclassical growth theory is represented in Fig. 29.2. It assumes that savers have in mind a target real interest rate (Rt) that remains constant over time. This target real interest rate, say 5% per annum, is also called the rate of time preference.
In Fig. 29.2(a) the starting point is an equilibrium where the supply of capital (KS1) intersects the
demand for capital (KD1) at the target real interest rate Rt. The supply of capital and the demand for capital are determined by saving and investment decisions. For example, as real interest rates rise, savings rise and the supply of capital expands. However, as real interest rates rise, fewer investment projects are now profitable and the demand for capital contracts (see Chapter 17, pp.
341-42). We now suppose that technical change occurs which raises the output per unit of capital, so that at any given interest rate there is an increased demand for capital investment, raising the amount of capital per person in production. In the short run, this increase in the demand for capital from KD1 to KD2 raises the real interest rate to R2, which is now above the target rate Rt. In Fig. 29.2(b) this above-target return to savers shifts sentiments in favour of still more saving at any given real interest rate, increasing (shifting to the right) the supply of capital from KS1 to KS2. As progressively more capital is used per person, the marginal productivity of capital diminishes along the new KD2 curve. The extra savings and supply of capital will continue until KS1 has shifted as far as KS2 in Fig. 29.2(b) and the marginal return on capital has fallen to the target real interest rate Rt and no further savings and capital is supplied. We now have the new equilibrium situation with a higher capital/labour ratio (K2∕L2) but with the original real target interest rate of Rt.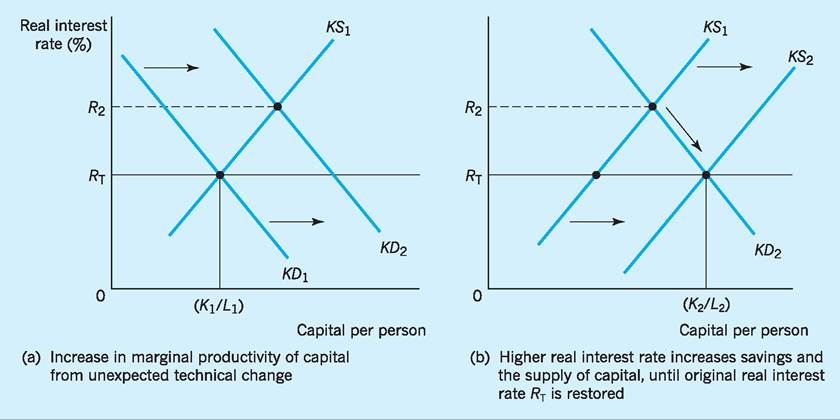
Fig. 29.2 Neoclassical growth theory.
Whilst real GDP per person will have grown during the transition period from one equilibrium to another, it will now cease to grow once the real rate of interest has returned to its target level Rt. The marginal productivity of (a now higher volume of) capital will have fallen back to its original level and real GDP per person, whilst higher, will cease to grow. In the absence of continuous technical change, there can only be short-term and transient growth periods under the neoclassical theory. has important implications for the ‘sustainability’ of growth. If growth is due mainly to factor accumulation (e.g.
increases in labour or capital input), then the diminishing marginal returns to factor input can be expected to apply, and higher growth rates, such as those achieved in recent years in East Asia, will be unsustainable in the future. However, if these recorded high growth rates are due to higher TFP of these factor inputs, then such limits to growth need not necessarily apply.Modern growth theories
The modern approach to growth is sometimes called endogenous growth theory (EGT) and is often associated with the pioneering work of Joseph Schumpeter. The emphasis here is on education and training, research and development and other knowledge-accumulating activities building the potential for continuous technical change, progressively increasing the marginal productivities of both capital and labour, and resulting in prolonged and sustainable periods of economic growth. Unlike neoclassical growth theory, technical change is no longer haphazard and down to chance, but can be fostered and promoted by appropriate policies. Moreover, as the foundations for innovation and entrepreneurship are secured, the probabilities of further technical change and associated economic growth occurring rise significantly. Technical change is no longer regarded as ‘unexplainable’ and due to chance as in neoclassical theory, but in the endogenous growth theories becomes itself a variable which can be influenced by policy decisions and should now be included within production functions, alongside the conventional inputs of labour and capital.
I Productivity and growth
The critical role of productivity in economic growth is emphasized in a wide range of cross-country studies. Bosworth and Collins (2003), in their study of 62 developing countries over the period 1960-2000, found that differences in total factor productivity (TFP) accounted for over half the recorded differences in GDP growth per worker across those countries. This is an extremely important finding since it
Productivity and ‘investment climate'
As noted in Chapter 17, there is substantial empirical evidence to suggest that higher TFP is strongly and positively associated with a favourable ‘investment climate’.
In other words, where the business environment in which the firm operates is characterized by transparency, policy stability, secure property rights and open and competitive markets, then private in vestment and innovation (both product and process) are stimulated and higher rates of productivity growth are recorded. Similar conclusions were reached in a major study by the World Bank (2004b). This study correlated ‘investment profile’, based on measures of contract enforceability, expropriation, profit repatriation and payment delays, with annual percentage growth in private investment. These countries with a more favourable ‘investment profile’ experienced much faster rates of growth of private investment than those countries with a less favourable ‘investment profile’. We consider these issues further later in this chapter.Productivity and competition
Whilst individual firms might prefer an absence of competition, Joseph Schumpeter and other analysts have noted the benefits to the aggregate of firms of competitive pressures. Schumpeter called the dynamic processes that follow such competition ‘creative destruction’, rewarding success, penalizing failure and encouraging firms to experiment and learn. In the advanced industrialized economies of the OECD, between 5% and 20% of firms enter and exit the market each year (Bartelsman et al. 2004). Firms that leave the market were found to be generally less productive than the new firms which entered the market, with the net productivity gain substantial, contributing on average around 25% of the recorded productivity gains in the countries investigated.
Productivity and policy uncertainty
Uncertainty plays a key role in investment decisions, given that these are, by definition, forward looking and involve expected future returns over the lifespan of a project. In the annual World Bank Investment Climate Survey, some 30% of firms in developing countries regularly rate ‘policy uncertainty’ as the major single deterrent to investment. Various studies have suggested that improving policy predictability can increase the probability of making new investments by over 30% (Kraay 2003; World Bank 2005).
I Sustainable development
As we noted in Chapter 10 on the Environment, the term ‘sustainable development’ is now widely used, and its origins can be traced back to the early 1970s, when fears were already growing about globally unsustainable social and economic development with an influential academic report entitled The Limits to Growth published in 1972 (Meadows et al. 1972). The report explored alternative futures as to what might happen as a result of a rapidly growing global human population, including impacts on food production, natural resources and environmental degradation in a finite world. ‘Limits to Growth’ was widely received as a message of impending doom and concluded that sooner or later one or more of these interrelated systems would collapse. The report had a significant impact, partly because it reinforced the growing economic and political uncertainty and fuelled the general pessimism of the time. ‘Limits to Growth’ was followed soon after by the onset of the first oil crisis in late 1973, which compounded fears about finite oil and other energy resources.
Characteristics of sustainable development
The modern understanding of the concept of ‘sustainable development’ was perhaps most clearly articulated in 1987 through the publication of a United Nations report entitled Our Common Future. This was the final report of a process involving the United National World Commission on Environment and Development (WCED). The report is also sometimes known as the Brundtland Report after the Norwegian Prime Minister Gro Harlem Brundtland, the then chair of the WCED. ‘Our Common Future’ is famous for providing the following most widely cited definition of sustainable development. Sustainable development is ‘development which meets the needs of the present without compromising the ability of future generations to meet their own needs’ (WCED 1987).
Two years on from the WCED report, preparations began in 1989 for a major international meeting on environment and development. The ‘Earth Summit’ or, to give it its legal title, the UN Conference on Environment and Development (UNCED), was held in June 1992 in Rio de Janeiro in Brazil. Attended by over 30,000 governmental and nongovernmental organizations from over 170 countries, the Earth Summit laid down key principles for governments to follow to promote sustainability. The Johannesburg ‘sustainability conference’ a decade later in 2002 revisited and reinforced many of these principles.
The Rio Declaration on Environment and Development
The Rio Declaration on Environment and Development aims to establish ‘a new and equitable global partnership through the creation of new levels of cooperation among states, key sectors of societies and people’ by ‘... working towards international agreements which respect the interests of all and protect the integrity of the global environment and development system’ (preamble to the Rio Declaration). The main themes of the Rio Declaration are outlined below. Although the actual text is much longer, this list gives a good idea of the vast range of issues covered (adapted from UNEP 1992).
■ Principle 1: Humans are at the centre of concerns for sustainable development.
■ Principle 2: Countries must not cause damage to the environment of other states.
■ Principle 3: Development must equitably meet developmental and environmental needs of present and future generations.
■ Principle 4: Environmental protection is an integral part of the development process.
■ Principle 5: Eradicating poverty is an indispensable requirement for sustainable development.
■ Principle 6: The special situation and needs of (least) developing countries must be given special priority.
■ Principle 7: States have common but differentiated responsibilities to conserve, protect and restore the health and integrity of the Earth’s ecosystem.
■ Principle 8: States should reduce and eliminate unsustainable patterns of production and consumption and promote appropriate demographic policies.
■ Principle 9: States should co-operate to strengthen endogenous capacity-building for sustainable development.
■ Principle 10: There is a need to improve access to environmental information, public awareness and participation.
The World Summit on Sustainable Development
The Rio Declaration contains many sensible principles and proclamations. However, a major weakness as an international treaty is its lack of any enforcement or compliance system. In legal terms, the Rio Declaration is what is called ‘soft law’. Nevertheless, some of these principles are starting to play important roles in the development of a future detailed legal framework around trade and the environment.
The World Summit on Sustainable Development (WSSD) or, as it was commonly known, the ‘Rio + 10’ conference, was held in Johannesburg in 2002. The communique from this conference acknowledged shortcomings in attempts by developed economies to implement the Rio principles over the past 10 years. It placed still greater emphasis than Rio on interdependencies, acknowledging that economic, developmental, environmental and social dimensions must be addressed simultaneously if sustainability is to be achieved.
Key conditions for sustainable development
It has already been noted that the Brundtland Commission defined ‘sustainable development’ (SD) as development that meets the needs of the present generation without compromising the ability of future generations to meet their own needs. This would seem to imply that at least two key aspects need to be present if social and economic development is to be regarded as ‘sustainable’:
1 Intergenerational equity: namely that the development process seeks to minimize any adverse impacts on future generations. These clearly include avoiding adverse environmental impacts such as excessive resource depletion today reducing the stock available for future use, or levels of pollution emission and waste disposal today being beyond the ability of the environment to absorb them, thereby imposing long-term damage.
2 Intra-generational equity: namely that the development process seeks to minimize tendencies towards excessive income and wealth inequalities within and between nations and groups of nations at any point of time.
Attempts have been made to operationalize these aspects of sustainable development still further. For example, various ‘rules’ have been devised to reflect views as to what might constitute ‘weak’ and ‘strong’ sustainability practices.
Weak sustainability (WS)
Under WS rules practical efforts will be made to fully compensate those adversely affected by development:
■ Future generations: e.g. depletion of scarce resources ‘compensated’ by income transfers to future generations or by technological developments increasing the efficiency of future resource use (less resource requirements per unit of output). Significant attempts will be made under WS to ‘decouple’ adverse environmental effects from economic growth. Support will also be given to the ‘constant capital rule’, namely that this generation must pass on to future generations an aggregate capital stock no smaller in value than the one it inherited. Less environmental capital (e.g. fewer natural resources) can be passed on so long as it is replaced by an equivalent value of physical capital (e.g. buildings and infrastructure) since physical capital is seen under this ‘rule’ as a credible substitute for environmental capital. Attempts will be made to capture environmental impacts within the macroeconomic accounts so that the ‘constant capital’ rule can be monitored.
■ Current generations: e.g. the poor and those disadvantaged by development must be compensated by various support programmes and other policy measures. Higher priority must be given under WS to attempts to tackle poverty both at home and abroad (e.g. debt relief for developing countries).
Strong sustainability (SS)
Under SS rules attempts will also be made to compensate those adversely affected by development. However, under SS that compensation must be explicitly ‘environmental’.
■ Future generations: e.g. the ‘constant capital rule’ no longer applies. Any loss of environmental capital in this generation must be offset by the addition of an equivalent ‘value’ of environmental capital to future generations (e.g. deforestation must be fully offset by an equivalent ‘value’ of tree planting). Physical capital is seen under SS as a highly imperfect substitute for environmental capital. The focus is on the conservation and preservation of ecosystems, landscapes and other ‘natural’ features.
■ Current generations: e.g. although there is still concern under SS for support for individuals disadvantaged by development, the focus shifts from individual valuations and concerns to the collective value ascribed to ecosystems and other environmental assets.
We now review some of the more technical issues underlying the issue of sustainable development.
Sustainable development: a technical approach
Following Pearce (1998), Fig. 29.3 uses wellbeing per capita on the vertical axis and time on the horizontal axis, where time is split into three generations of people. Pearce suggests that an economy that develops along a path like A is pursuing sustainable development, securing increases in wellbeing that last over future generations. Even an economy developing along path B is ‘sustainable’ because later generations are no worse off than the first one: wellbeing is ‘nondeclining’. However, the economy on path C is not sustainable, because per capita wellbeing grows, then declines for succeeding generations. Note that sustainable development is not necessarily ‘optimal’ in
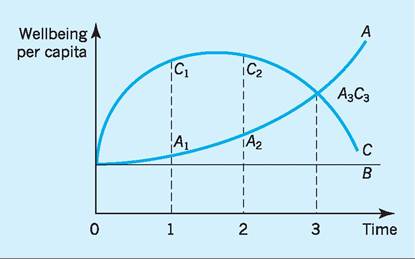
Fig. 29.3 Sustainable and non-sustainable growth paths.
that path C (C1 + C2 + C3) yields a total wellbeing in excess of path A (A1 + A2 + A3).
Sustainability ‘rules'
Whatever concept of ‘wellbeing’ is applied (GDP or ‘quality of life’ indices), the condition for sustainable development is that each generation should leave the next generation a stock of capital assets no less than the stock it ‘inherits’. The next generation will then have the capacity to generate the same (or more) ‘wellbeing’ as the previous generation. At least four types of capital asset are often identified.
1 Man-made capital (Km): factories, machines, roads, computers, etc.
2 Human capital (Kh): knowledge, skills embodied in people.
3 Natural capital (Kn): the stock of environmental assets that provide natural resources to sustain life, to use in production, to help in the assimilation of wastes and provide amenity attractions.
4 Social capital (Ks): values and relationships which give a particular society its sense of identity.
The weak sustainability rule is that:
The total stock of capital (Km + Kh + Kn + Ks) should not fall, though individual elements within it can vary.
The strong sustainability rule is that
Each element within the total stock of capital should not fall.
Sustainable development is a key issue for both developed and developing countries. However, it is clearly the developing countries which will have the greatest problems in conforming to either of these sustainability rules. This is especially true if these capital rules are expressed per capita, given the current and projected rapid population growth for the developing countries. Of course, the ‘weak sustainability rule’ gives more scope for the developing economies. For example, a fall in Kn (per capita) via, say, deforestation in Amazonia, can, at least in principle, be offset by investing the monies received in education and training, giving an offsetting rise in Kh (per capita).
The extent to which such offsets are feasible depends on how easily one form of capital can be substituted for another form in terms of its contribution to ‘wellbeing’. If Km, Kh or Ks (per capita) can more than offset a decline in Kn (per capita) then achieving ‘weak sustainability’ for both developed and developing countries will at least be more plausible. It is in this context that many are placing their hopes for sustainable development on further advances in technological capabilities, thereby raising output per unit input of these various types of capital asset.
Measuring sustainable development
It has often been pointed out that an implication for fulfilling the ‘weak sustainability rule’ is that the total savings of a nation must be greater than the total depreciation of its capital assets (Km + Kh + Kn + Ks). Only then can the nation replenish its capital assets so that they are at least as extensive at the end of the time period as they were at the beginning. The general savings rule is that:
For development to be sustainable (weak form), total savings must at least cover depreciation of the four types of capital.
Estimates (if imperfect) of savings by nations are available from the national accounts as are also estimates of man-made capital depreciation (Km). Environmental economists have also made progress in developing indicators of natural resources (e.g. oil, timber) and of waste-receiving capabilities (e.g. via pollution) and the environmental ‘pluses’ of new discoveries of natural resources and growth of renewable resources (see Chapter 10).
Progress has been made in developing indicators of human capital depreciation (Kh), which tends of course to be substantial and positive in sign in the poorer developing economies, but via increased education, training and improvements in the quality of life to be negative in sign in the developed economies, implying appreciation of Kh. Indicators for social capital depreciation (Ks) remain somewhat elusive.
A dilemma facing the developing economies and particularly the poorer LDC grouping is that, expressed as a percentage of GNP, savings are often insufficient to more than offset any (net) depreciation estimated for the other four capital assets combined. The richer countries would certainly seem to be sustainable in terms of the ‘general savings rule’ and in a context of ‘weak sustainability’. Problems clearly exist elsewhere, as in much of Africa and in the Middle East where assets appear to be depreciating faster than they are being replaced.
Technical change and sustainability
Technical change is not usually included in national savings ratios, although many would argue that it is a factor to be added to general savings. Pearce (1998) suggests that a rich economy such as the US would gain an extra three percentage points on its ‘genuine savings’ measure by adding on technological change. The number is likely to be far less, perhaps zero in many developing economies. However, a major debate is currently under way on the extent to which technological change might become a major factor in supporting sustainable development in the low- income, developing economies.
Figure 29.4 indicates how technological change can play a key role in development, in terms of our earlier analysis enhancing human capital (Kh), manmade capital (Km), social capital (Ks) and arguably even natural capital (Kn). The Human Development Report of the United Nations (UNDP 2001) emphasizes the benefits of technology for developing economies, producing drought-tolerant plant varieties for farming in uncertain climates, more efficient industrial processing vaccines for infectious diseases, and clean energy sources for domestic and industrial uses. In these ways, new technologies support economic growth through productivity gains in agriculture, industry and service activities and by supporting a healthier, more highly educated and skilled workforce.
Technical change is one of the factors associated with increases in TFP, as noted earlier (p. 625).
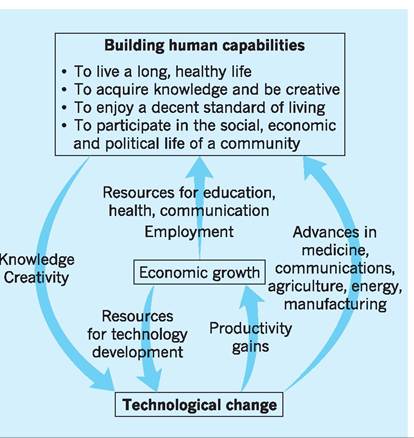
Fig. 29.4 How technological change can influence economic growth.
However, technical change need not be limited to new scientific breakthroughs (innovations) of the type which might involve patents. It can include adaptations of existing scientific and/or technological processes and products, with estimates of the adaptation:innovation ratio as high as 30:1 (World Bank 2005). This ratio emphasizes the great potential for developing countries to catch up with the more developed countries, by creating a business environment that supports the diffusion and adaptation of existing processes and products as well as the creation of new ones. Parente and Prescott (2000) note that while it took the early industrialized countries 40-60 years to double their incomes in real terms, others have achieved the same outcome much more rapidly in recent times, examples being Costa Rica in 19 years (1961-80), Jordan in 15 years (196580) and China and Taiwan in 10 years (1965-75).
GNP data, developed and developing countries
The use of GNP per head as a basis for classifying countries as developed or developing has been much criticized in recent years. Nevertheless, it does give some indication of the huge disparities in standard of living between countries, as can be seen from Fig. 29.5.
GNP per head
Before moving to alternative indicators of ‘economic wellbeing’, let us briefly review the usefulness of the GNP per head figures represented in Fig. 29.5, paying particular attention to the situation of the developing economies. Students of macroeconomics will know that GNP can be measured in the local currency using output, income and expenditure methods. By dividing the figure for GNP (converted into US dollars at the official $/country exchange rate) by the country population, we obtain an average figure for output or income per head. Interesting as this figure undoubtedly is, it has a number of flaws as a measure of comparative living standards in the respective countries.
■ Inappropriate exchange rates. Converting the value of GNP expressed in the local currency into a US dollar equivalent using the official exchange rate may misrepresent the actual purchasing power in the local economy. This is because the official exchange rate is influenced by a range of complex forces in the foreign exchange markets and may not accurately reflect the purchasing power of one country’s currency in another country. A more accurate picture is given if we use purchasing power parities (PPPs) rather than official exchange rates when making this conversion (see Table 29.1 below). Purchasing power parities measure how many units of one country’s currency are needed to buy exactly the same basket of goods as can be bought with a given amount of another country’s currency. On this basis, Ethiopia’s figure rises from $70 to $870 per capita and the Switzerland figure falls from $65,330 to around $46,460 per capita, using purchasing power parities (World Bank 2010).
■ Differing degrees of non-market economic activity. GNP per capita includes only the money value of recorded (market) transactions involving goods and services. Non-market transactions are excluded. For example, the output of subsistence agriculture, whereby farmers grow food for their own consumption, is excluded from GNP figures. In many less developed economies where there is often a
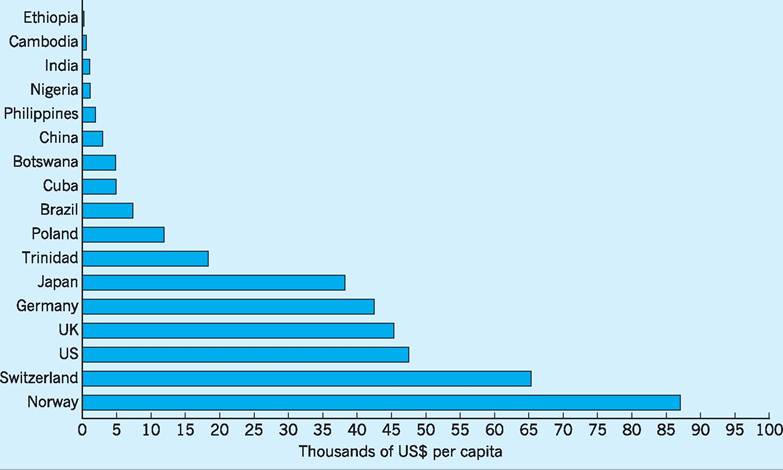
Fig. 29.5 GNP per head in $US, 2008.
Source: Adapted from World Bank (2010) World Development Report.
greater degree of non-market economic activity, this fact may lead to GNP figures that underestimate the true living standards.
■ Varying degrees of inequality. GNP per capita gives an indication of the ‘average’ standard of living in a country. However, this may reflect the experience of only a small number of people in that country because its income distribution may be highly unequal, being skewed in the direction of the wealthier sections of society. For example, instead of using the arithmetic mean for GNP per capita, the median might be a more useful measure of the ‘average’, i.e. that figure for which 50% of the population has a higher GNP per capita, and 50% has a lower GNP per capita.
■ Incidence of externalities. Externalities occur where actions by an individual or group impose costs (or benefits) on others which are not fully ‘priced’. Increased pollution is a by-product of many industrial processes, reducing the quality of life for those affected. However, this negative externality may not be reflected in the GNP calculations. Similarly, the GNP figure makes no allowance for the depletion and degradation of natural resources and for the social costs these may impose, e.g. deforestation as a factor in global warming, etc.
For these and other reasons (differing accounting conventions, economic and social practices), there has been a move towards the use of indicators other than the GNP per capita figure to reflect the ‘true’ standard of living in various countries, using various ‘quality of life’ indicators such as life expectancy, medical provision, educational opportunities, etc.
The United Nations has moved on to publish a Human Development Report since 1990 in which new methods of classification are presented, including a Human Development Index which we consider below.
Human Development Index (HDI) classification
An interesting issue is whether the conventional GNP per capita figure can be merged with ‘quality of life’
Table 29.1 Selected country indicators and rankings (out of 182 countries).
| 1 GNP per head($) | 2 Real GNP per head (PPP$) | 3 Life expectancy at birth (years) | 4 Adult literacy rate (%) | 5 Enrolment ratio* (%) | 6 Human Development Index (HDI) | 7 Rank by real GNP per head (PPP$) | 8 Rank by HDI | |
| Ethiopia | 280 | 779 | 55 | 36 | 49 | 0.414 | 171 | 171 |
| Cambodia | 600 | 1,802 | 61 | 76 | 59 | 0.593 | 143 | 137 |
| Cuba | 4,870 | 6,876 | 79 | 100 | 100 | 0.863 | 95 | 51 |
| Nigeria | 1,160 | 1,969 | 48 | 72 | 53 | 0.511 | 175 | 158 |
| India | 1,070 | 2,753 | 63 | 66 | 61 | 0.612 | 128 | 134 |
| China | 2,940 | 5,383 | 73 | 93 | 69 | 0.772 | 102 | 92 |
| Philippines | 1,890 | 3,406 | 72 | 93 | 80 | 0.751 | 124 | 105 |
| Brazil | 7,350 | 9,567 | 72 | 90 | 87 | 0.813 | 79 | 75 |
| Trinidad | 18,340 | 23,507 | 69 | 99 | 61 | 0.837 | 64 | 90 |
| Poland | 11,880 | 15,887 | 76 | 99 | 88 | 0.888 | 53 | 41 |
| Botswana | 4,781 | 13,604 | 53 | 83 | 71 | 0.699 | 60 | 125 |
| Germany | 42,440 | 34,401 | 80 | 100 | 88 | 0.947 | 24 | 22 |
| Norway | 87,070 | 53,433 | 81 | 100 | 98.6 | 0.971 | 5 | 1 |
| UK | 45,390 | 35,130 | 79 | 100 | 89 | 0.947 | 20 | 21 |
| Japan | 38,210 | 33,632 | 83 | 100 | 87 | 0.96 | 26 | 10 |
| US | 47,580 | 45,592 | 79 | 100 | 93 | 0.956 | 9 | 13 |
| Switzerland | 65,330 | 40,658 | 82 | 100 | 87 | 0.96 | 13 | 9 |
*Percentage of population at Levels 1, 2 and 3 (combined) of OECD Literacy Survey.
Sources: Adapted from UNDP (2010) Human Development Report 2010; World Bank (2010) World Development Report 2010.
indicators to give an overall index of economic wellbeing. A first step in this direction has in fact been made with the publication of the United Nations’ Human Development Index (HDI). In Table 29.1 we present more comprehensive data for 17 countries. We also show the rank of these countries (out of 182 countries) in terms of real GNP per head using PPPs and in terms of the HDI. Before commenting further on these rankings it will help if we explore the background to the HDI a little further.
The Human Development Index (HDI) is based on three indicators.
1 Standard of living, as measured by real GNP per capita (PPP$) - column 2 in Table 29.1.
2 Life expectancy at birth, in years - column 3 in Table 29.1.
3 Educational attainment, as measured by a weighted average of adult literacy (two-thirds weight) and enrolment ratio (one-third weight) - columns 4 and 5 respectively in Table 29.1.
Each of these three indicators is then expressed in index form, with a scale set between a minimum value (index = 0) and a maximum value (index = 1) for each indicator.
■ Standard of living: $100 real GNP per capita (PPP$) is the minimum value (index = 0) and $40,000 is the maximum value (index = 1).
■ Life expectancy at birth: 25 years is the minimum value (index = 0) and 85 years is the maximum value (index = 1).
■ Educational attainment: 0% for both adult literacy and enrolment ratios are the minimum values used for calculating the weighted average (index = 0) and 100% for both adult literacy and enrolment ratios are the maximum values used for calculating the weighted average (index = 1).
An index is then calculated for each of these three indicators, and the average of these three index numbers is then calculated, as shown for each country in column 6 of Table 29.1. This average of the three separate index numbers is the HDI. The closer to 1 is the value of the HDI, the closer the country is to achieving the maximum values defined for each of the three indicators.
From columns 7 and 8 of Table 29.1, we can see that the rankings of the countries (in order from 1 to 182) do vary with the type of indicator used. In other words, using a GNP per head indicator, even adjusted for PPPs, gives a different ranking for countries than using the HDI index which brings quality of life aspects into the equation.
The HDI, by bringing together both economic and quality of life indicators, suggests a smaller degree of under-development for some countries than is indicated by economic data alone. For example, Cuba is 95th out of 182 countries when the GNP per head data is used for ranking (column 7) but rises 44 places to 51st when the HDI is used for ranking (column 8). For Cuba it would seem that the high life expectancy at birth and high adult literacy and enrolment ratios into education have helped raise these indicators and thereby the overall HDI. On the other hand, the HDI suggests a greater degree of under-development for some countries than is indicated by economic data alone. For example, Botswana is 60th out of 182 countries when the GNP per head data is used for ranking (column 7) but falls by 65 places to 125th when the HDI is used for ranking (column 8). For Botswana it would seem that the relatively low life expectancy of a country ravaged by Aids and relatively low adult literacy and enrolment ratios have lowered the overall HDI.
Although only in its infancy, it may be that classification of countries based on indices such as the HDI which bring together both economic and quality of life data may give a more accurate picture of the level of development.
Less developed countries (LDCs)
Clearly the exact definition of which countries are regarded as the LDCs may depend on the types of classification system adopted. In the World Development Report (World Bank 2010) the ‘low income economies’ are defined as those with a Gross National Income (GNI) per capita of $975 or less. Some 43 out of 196 countries are currently in this category. The ‘poverty line’ is now defined as $1.25 a day (or $2 a day using PPPs).
Major features of LDCs
Whatever the precise definition of an LDC, a number of features or characteristics are regarded as fairly typical of any country placed within this category:
Low real income per capita
This is a major indicator of under-development. A comparison with the economically developed countries is striking. For instance, in 2008, an average employed adult in the 43 ‘low income economies’ earned less than 3% of the average employed adult in the US. Most LDCs exhibit very low ratios of total income (however defined) to total population, resulting in a low value for real income per capita. This is usually the result of low productivity, low savings, low investment, few resources and backward technology, often allied to high levels of population, the latter being determined by complex socioeconomic factors.
High population growth rate
Many LDCs have experienced a high population growth rate, although some LDCs in Africa and elsewhere are now experiencing population decline due mainly to a rapidly rising death rate from HIV/AIDS. Despite HIV/AIDS, the 43 ‘low income economies’ have grown at a compound rate of 5.8% per annum over the period 2000-2008, compared to only 2.3% per annum for the ‘high income developed countries’. A major implication of population growth in LDCs has been the growth in the proportion of people who live on the subsistence or ‘poverty’ line, defined as the minimum calorie intake necessary to stay alive. Even where the population growth rate is not very high (e.g. China) or falling (e.g. India), the absolute size of the population may be very high.
Large-scale unemployment and under-employment
This has been a common feature of many LDCs. Contributory factors often include a low level of economic activity, particularly in the industrial sector.
Since labour in LDCs tends to be both more abundant than capital and poorly educated, labour productivity is often quite low. Currently some 1.3 billion people, around one-quarter of the world’s population, live on $1.25 a day or less, with the majority of these people to be found in East and South Asia, subSaharan Africa, Latin America and the Caribbean. Even with low wages, an even lower labour productivity can mean high ‘relative unit labour costs’ in LDCs, which in turn can mean unemployment.
Inequalities in the distribution of income
The pattern of income distribution tends to be less equal in most LDCs in comparison with the developed countries. For example, the ratio of shares of income between the richest 10% and poorest 10% is over 106 to 1 in Namibia, compared to a ratio of only 6 to 1 in Norway. This reflects the fact that in Namibia the richest 10% have 65% of all income, whereas the poorest 10% have only 0.6% (i.e. just over half of 1%) of all income. In Norway, by way of contrast, the richest 10% have 23.4% of all income, whereas the poorest 10% have 3.9% of all income. A significant disparity in this ratio is evident between developed and developing countries.
Large but neglected agricultural sector
In most LDCs, agriculture accounts for 40-85% of the real national income and about 60-90% of total employment. Nevertheless, policy-makers in many LDCs have opted for industrialization, often at the expense of agricultural development, in order to promote rapid economic growth. Such neglect of agriculture has often led to food shortages, poverty and famines.
Volatile export earnings
Foreign trade has tended to contribute relatively little to the national income of many LDCs. The pattern of foreign trade for most LDCs has often been determined by former colonial trade relationships, with today’s LDCs remaining net exporters of primary goods and net importers of finished industrial goods. The export income of LDCs from primary goods (such as food and raw materials) sometimes fluctuates quite sharply, in part because of low price elasticities of demand for primary goods. For example, fluctuations in export earnings of LDCs have, on occasions, been the result of a substantial increase in supply of primary products allied to a relatively price-inelastic demand curve, resulting in a fall in price and a fall in revenue for the exporter of primary goods. The tendency for such products to have relatively low income elasticity of demand has also meant that rising prosperity in the developed countries has resulted in only modest increases in demand for primary products from developing countries. In addition, the LDCs have historically often depended on a few key markets, with such a narrow market base increasing the risk factor as regards the prospects for a sustained growth of export earnings.
Market imperfections
In many LDCs markets are imperfect; sometimes they do not even exist. The money markets are just such an example of market failure. These money markets are often divided into two broad categories: (a) organized; and (b) unorganized. The organized sector generally consists of a central bank, commercial banks, co-operative credit banks and development banks. Division of labour and specialization does not always exist in such money markets, as with the absence of insurance companies. The unorganized sector mainly consists of moneylenders, indigenous banks, pawnbrokers, traders, merchants, landlords and friends. While the organized sector is amenable to financial control, the unorganized sector is not. In many LDCs the unorganized sector still controls a significant section of the money market, chiefly because of its hold over the rural areas. Clearly the existence of such financial dualism has restricted the use of bank cheques and other means of payment. By reducing the volume of monetary transactions this has led to the (less efficient) growth of transactions supported by barter or goods exchange. Further, this lack of an organized money market has deprived the society of an array of financial assets through which savings could have been more effectively mobilized and converted into investment for promoting economic growth. Evidently, a major policy objective in LDCs should be for the organized sector of the money markets to bring the unorganized sector more closely under its control.
Environmental degradation
There is considerable evidence to point to greater environmental degradation in the developing economies. As Robert Dorfman, a well-known environmental economist, noted, ‘... the poorer countries of the world confront tragic choices. They cannot afford drinking water standards as high as those the industrial countries are accustomed to. They cannot afford to close their pristine areas to polluting industries that would introduce technical knowhow and productive capital and that would earn urgently needed foreign exchange. They cannot afford to bar mining companies from their exploited regions. Nor can they afford to impose anti-pollution requirements on these companies that are as strict and expensive as those in richer industrial countries. They should always realize that environmental protection measures are financed out of the stomachs of their own people; the multinationals cannot be made to pay for them’ (Dorfman and Dorfman 1972) The so-called ‘pollution haven hypothesis’ reflects this type of thinking. The suggestion here is that an increasingly important factor in the decisions by multinational firms to locate production facilities in the developing economies is the absence of the strict environmental controls applied in the developed economies. In this sense the developing economies are acting as ‘pollution havens’, proving particularly attractive to firms in the more toxic-intensive industries which release relatively large amounts of toxic chemicals per unit output. With many variables involved in locational decisions by multinationals, testing this hypothesis by establishing the significance of the single explanatory variable (environmental standard avoidance) is clearly difficult. Some studies do, however, claim to have found evidence that the more toxic intensive industries have grown most rapidly in the developing economies.
HIV/AIDS
The low levels of education, income and healthcare services in many developing countries have contributed to the spread of HIV/AIDS, with devastating effects on the countries affected, as indicated by the example of Botswana. Botswana has almost 40% of its adult population infected by HIV/AIDS and an average life expectancy of less than 30 years for newborn children, having been as high as 75 years only a decade ago. Those who are dying early from AIDS include the breadwinners as well as the young, and the missing middle generation will not be there to look after either the young or the old in future years.
Poor governance
Developing countries feature prominently in international studies citing poor governance and widespread corruption. For example, Transparency International (TI) is a non-governmental organization founded in 1993 and based in Berlin. It has developed one of the more comprehensive databases on corruption which it defines as an abuse of public office for private gain. The ‘TI Corruption Perception Index, correlates a number of surveys, polls and country studies involving the number of bribe requests which those conducting business in some 102 separate countries perceive to have been made to them. A score of 10 indicates a perception that bribe requests are never made in that country, while a score of 0 indicates a perception that bribe requests are always made. A score of 5.0 indicates a perception that there is an equal chance of a bribe being made as not being made. Of the 102 countries included in the 2009 index, 69 scored 5.0 or below; in other words, businessmen perceive that in two-thirds of these countries it is more likely than not that a bribe request will be made in any given transaction. In 2009 Finland scored 10, the UK 8.6, the US 7.8, China 3.9, India 2.7, Pakistan 2.2 and Indonesia 1.9.
Benefits of good governance
The World Bank has pointed out that good governance - including independent agencies, mechanisms for citizens to monitor public behaviour, and rules that constrain corruption - is a key ingredient for growth and prosperity. In an early study Barro (1991) had found a positive correlation between economic growth and measures of political stability for 98 countries surveyed between 1960 and 1985. More recent empirical research points in a similar direction, for example confirming that foreign direct investment (FDI) inflows are inversely related to measures of corruption, as with Lipsey (1999) observing a strong negative correlation between corruption and the locational choice of US subsidiaries across Asian countries. Similarly, Claugue et al. (1999) and Zak (2001) found that productivity and economic growth will improve when governments impartially protect and define property rights. Underpinning these findings is the perception by firms that a non-transparent business environment increases the prevalence of information asymmetries, raises the cost of securing additional information, increases transaction costs (e.g. risk premiums) and creates an uncertain business environment which deters trade and investment. For example, Wallsten (2001) found a strong inverse relationship between investment intentions and the threat of asset expropriation, as well as a propensity for firms to charge higher prices to help pay back their initial capital outlays more rapidly when they felt less secure about the intentions of host governments, the higher prices often inhibiting the penetration and growth phase of product life cycles. tional mechanisms for dealing with climate change. Developing countries are especially vulnerable to climate change, with estimates suggesting that some 75-80% of the costs of climate change will be borne by LDCs. A 2 °C warming of the world climate above pre-industrial temperatures could result in a permanent reduction in GDP of 4-5% for Africa and South Asia (World Bank 2010). At the Copenhagen climate change convention in December 2009 (see Chapter 10, p. 204) it was noted that financing for LDCs was crucial, with current financing of LDCs for adaptation and mitigation policies to deal with climate change less than 5% of what is deemed necessary.
International Development Targets (IDTs)
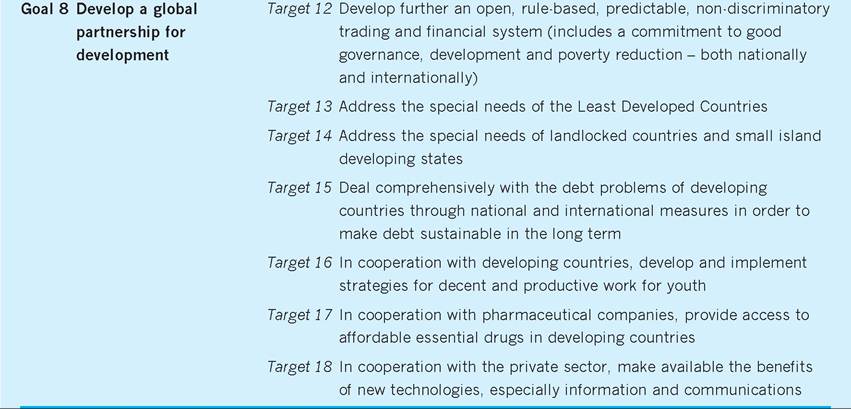
Today’s political orientations towards development are firmly centred on the use of International Development Targets (IDTs). This approach is usefully illustrated by The UN Millennium Declaration which included a commitment to a set of Millennium Development Goals (MDGs) broken down into targets (see Table 29.2).
Despite growing recognition for these targets, international development targets are not new. Many previous summits have included targets. What does seem to be new, however, is the seriousness of tackling the issue of development on a broad front, bringing into play economic, social, political, environmental and technological elements in a comprehensive and integrative approach. Effectively monitoring and implementing these targets on a global scale will ultimately determine whether a more coherent approach in principle can result in more effective development in practice. Optimists should note, however, that despite the ‘make poverty history’ campaign for Africa, some ten years into the new millennium many of the targets in Table 29.2 are already well behind schedule if they are to be met by 2015.
Climate change and economic development
We have already reviewed (Chapter 10) the Kyoto Protocol, Copenhagen Accord and other interna-
Urbanization and developing economies
‘Urban areas’ are usually defined in terms of concentrations of non-agricultural workers and non- agricultural production sectors. Although individual country definitions differ, most countries regard settlements involving 2,500-25,000 people as urban areas. Larger urban areas are often termed ‘metropolitan areas’ as they involve networks of geographically adjacent urban areas, including towns and cities (the latter defined in terms of legal status within countries rather than pure size). Urbanization is sometimes defined as the tendency of populations in LDCs to concentrate in urban areas during the development process which often involves industrialization.
Reasons for urbanization
Why is it that economic activity is so often concentrated in large, urban areas where land prices are often more than 50 times higher and the cost of living four or five times higher than they are in smaller urban or rural areas, less than 50 miles away? From the firm’s point of view, the answer must involve a belief that the perceived benefits more than outweigh the additional costs. Many of these perceived benefits are often grouped under the heading agglomeration economies, which refers to the alleged synergies which benefit firms from increases in urban size.
Table 29.2 The UN Millennium Development Goals (MDGs).
Goals Targets
Goal 1 Eradicate extreme Target 1 poverty and hunger
Target 2
| Goal 2 | Achieve universal primary education | Target 3 |
| Goal 3 | Promote gender equality and empower women | Target 4 |
| Goal 4 | Reduce child mortality | Target 5 |
| Goal 5 | Improve maternal health | Target 6 |
| Goal 6 | Combat HIV/AIDS, malaria and other diseases | Target 7 Target 8 |
| Goal 7 | Ensure environmental sustainability | Target 9 |
Halve, between 1990 and 2015, the proportion of people whose income is less than one dollar a day
Halve, between 1990 and 2015, the proportion of people who suffer from hunger
Ensure that, by 2015, children everywhere, boys and girls alike, will be able to complete a full course of primary schooling
Eliminate gender disparity in primary and secondary education, preferably by 2005, and to all levels of education no later than 2015
Reduce by two-thirds, between 1990 and 2015, the under-five mortality rate
Reduce by three-quarters, between 1990 and 2015, the maternal mortality ratio
Have halted by 2015 and begun to reverse the spread of HIV/AIDS
Have halted by 2015 and begun to reverse the incidence of malaria and other major diseases
Integrate the principles of sustainable development into country policies and programmes and reverse the loss of environmental resources
Target 10 Halve by 2015 the proportion of people without sustainable access to safe drinking water
Target 11 By 2020 to have achieved a significant improvement in the lives of at least 100 million slum dwellers
Source: Adapted from UN sources.
■ Localization economies. Firms benefit from locating close to other firms in the same industry since this expands the pool of specialized workers and inputs. It has been shown that in Brazil and the Republic of Korea, if a plant moves from a location shared by 1,000 workers employed by firms in the same industry to one with 10,000 such workers, output will increase by some 15% on average.
■ Urbanization economies. Firms also benefit from locating close to firms in different industries. The presence of a common pool of labour, materials and services provides benefits for all firms, whatever their sector of economic activity. Geographical proximity to other firms can, for example, help in the more rapid diffusion of knowledge, as in the case of ‘information spillovers’ via firms observing what others are doing, whatever the activities involved. Evidence using patent citations shows that information flows increase with geographical proximity and deteriorate with geographical distance. ‘Transaction costs’ also fall when there is a higher degree of industrial concentration, e.g. the lower search costs now involved in matching workers with employment opportunities.
■ Diversification economies. Large urban areas are less vulnerable to business cycles because of their more diversified economic base.
Impacts of urbanization
Increased urbanization is clearly associated with the transfer of workers from agricultural and rural activities to new industrial and service sector employment in towns and cities. Around 50% of the world’s population currently lives in areas classified as urban, a rapid increase on the 34% recorded in 1975. By 2020 over 4 billion people (around 60% of the world’s population) will live in towns and cities, with the developing countries being the major contributor to this continued growth in urbanization. The rate of urbanization has passed its peak in the middle to high income industrial countries, but is far from its peak in much of Asia and Africa. The more rapid pace and less regulated nature of the urban growth in the developing economies has created a number of environmental problems.
Urban living conditions such as crowding, sewage connections, waste collections and water access tend to be far inferior in cities with lower levels of average household incomes. The case study below pays particular attention to the issue of sanitation in the context of urbanization within developing economies.
Sanitation, health and urbanization
As the low-income developing countries industrialize over the next 25 years, progressively larger discharges of wastewater and solid wastes can be expected in total and per capita. Inadequate investments in waste collection and disposal mean that large quantities of waste enter both groundwater and surface water. Groundwater contamination is less visible but often more serious because it can take decades for polluted aquifers to cleanse themselves and because large numbers of people drink untreated groundwater.
More environmental damage occurs when people try to compensate for inadequate provision. The lack or unreliability of piped water causes households to sink their own wells, which often leads to overpumping and depletion. In cities such as Jakarta, where almost two-thirds of the population relies on groundwater, the water table has declined dramatically since the 1970s. In coastal areas this can cause saline intrusion, sometimes rendering the water permanently unfit for consumption. In, for example, Bangkok excessive pumping has also led to subsidence, cracked pavements, broken water and sewerage pipes, intrusion of seawater and flooding. Inadequate water supply also prompts people to boil water, thus using energy. The practice is especially common in Asia. In Jakarta more than $50m is spent each year by households for this purpose - an amount equal to 1% of the city’s GDP. Investments in water supply can therefore reduce fuelwood consumption and air pollution.
The health benefits from better water and sanitation are substantial: diarrhoeal death rates are typically about 60% lower among children in households with adequate facilities than among those in households without such facilities. Improved environmental sanitation has economic benefits. Consider the case of sewage collection in Santiago, Chile. The principal justification for investments was the need to reduce the extraordinarily high incidence of typhoid fever in the city. A secondary motive was to maintain access to the markets of industrial countries for Chile’s increasingly important exports of fruit and vegetables. To ensure the sanitary quality of these exports, it was essential to stop using raw wastewater in their production. In just the first 10 weeks of the cholera epidemic in Peru in the early 1990s, losses from reduced agricultural exports and tourism were estimated at $1 billion - more than three times the amount that the country had invested in water supply and sanitation services during the 1980s.
Despite such problems there are a number of factors which make urbanization so attractive to firms in both developing and developed economies.
I Aid, trade and development
Here we briefly examine the role of both aid and trade in development.
Foreign aid and development
In theory, foreign aid should raise both consumption and investment in a developing country, since in the absence of foreign aid an LDC will produce less of both consumption and investment goods given its limited resources. However, if the economy has a very high preference for consumption, then most of the foreign aid might be used for consumption purposes with little addition to its future productive capacity. To counter this, the aid programmes often seek to designate aid for particular purposes; for example, food aid is intended to increase consumption rather than investment, but project aid is usually intended to raise investment rather than consumption.
In the traditional economic models, an increase in access to savings from abroad should raise the growth rate of the borrowing country by increasing its rate of investment. If we aggregate aid from abroad with access to the savings from foreign capital markets, this gives us the variable ‘financial resources’ (FR). For some LDCs such as Bangladesh and Nepal in Asia and Mali and Senegal in Africa, foreign aid is a significant proportion of the GDP of these economies and hence the impact of additional aid on FR should help increase their growth rates. However, a rise in the flow of FR may raise consumption at the expense of savings/investment so that the overall growth rate suffers. Further, a rise in domestic consumption due to a rise in FR may increase imports and add to the balance of payment problems of many LDCs. They may then have to deflate aggregate demand to reduce imports, adversely affecting economic growth. In addition, many governments of LDCs have used FR for increasing public expenditure on prestige projects which are relatively unproductive.
On the other hand, foreign aid has the potential to increase domestic economic growth rates by supplementing domestic savings to further increase investment and to allow imports of capital items previously restricted by scarce foreign exchange reserves. In this view, foreign aid could have a positive and significant influence on growth rates for LDCs.
This is not to deny that a corrupt government in a developing country seeking to maximize its own ‘utility function’ may use aid money to expand nonproductive expenditures, e.g. on military capability, corrupt bureaucracy and very inefficient investments. In such cases, the impact of aid on economic growth will indeed tend adversely to affect growth. For aid to be effective may then depend on carefully choosing the countries to support through aid and targeting specific projects to support within those countries. For instance it has been widely acknowledged that, despite the absence of a positive aid-growth correlation in India, aid inflows in the agricultural sector significantly helped to usher in the ‘Green Revolution’ in the late 1960s and early 1970s, thereby helping to overcome India’s acute problems of food insecurity and famines. Such aid was generally well targeted, as in its allocation to specific areas in north-west India where irrigation facilities were available to reap the benefits of new seeds-fertilizer techniques. The inflow of foreign aid to such specific rural areas has helped India to import considerable amounts of new seeds and chemical fertilizers from abroad and to substantially increase the yields of major food crops.
The impact of foreign aid on the economic growth rates of LDCs is clearly likely to vary across different countries. More specially, such impacts will depend on a number of factors:
■ the effective targeting of aid by both donor and recipient;
■ the effective use of aid by the recipient;
■ the current level of economic development and rate of output growth;
■ the rates of return on investment in both organized and unorganized financial markets;
■ the public infrastructure and the availability of physical human capital; and
■ the level and types of economic regulation.
Without a careful analysis of such a complex set of dynamic socioeconomic factors, it is difficult to draw a definite conclusion about the real impact of foreign aid on LDCs.
Trade and development
In recent years the focus has moved to a broader recognition of the key role of trade to economic development. The World Bank (Dollar and Kraay 2000) has argued that increased openness to trade raises average incomes and the incomes of the poor, i.e. that there is no relationship between increased openness to trade and rising inequality, if anything quite the opposite. Sebastian Edwards of the University of California also concludes in a study of 93 countries that there is a close link between openness to trade and rates of productivity growth (Edwards 2000). It has been estimated (World Bank 2004b) that removing trade protection and related distortions in developed countries could provide gains to developing countries of $85bn by 2015.
Some of the ways in which protectionism still pervades much of the trade between developed and developing countries have been considered in Chapter 28. What is clear is that the developing countries have been badly damaged by export subsidies on agricultural and other products by the EU, US and other advanced industrialized countries.
Here we review some of the issues at the heart of the recent Doha round of trade negotiations, between developed and developing nations which failed to reach agreement in July 2006.
Collapse of Doha in 2006
The issue of farm subsidies has been identified by most analysts as the key reason for the breakdown in the global trade talks in Doha in July 2006. Whilst the US had been willing to remove explicit export subsidies on farm products, it had insisted on retaining support for domestic farm production, including domestic subsidies. Critics of the US argue that these domestic subsidies have exactly the same effect as export subsidies, namely encouraging excessive domestic production of farm products, at artificially low prices which can then be ‘dumped’ on export markets.
The World Trade Organization (WTO) classifies farm subsidies into three ‘boxes’.
1 Green box subsidies. These are defined as not distorting trade and can be unlimited under current WTO rules, e.g. payments to farmers to protect the environment.
2 Blue box subsidies. These are defined as only ‘mildly distorting’ and are not affected by current WTO rules: e.g. payments related to fixed output or to the size of the farms aimed at limiting output beyond agreed target levels.
3 Amber box subsidies. These are defined as ‘significantly distorting’ and the current WTO rules place a ceiling on such subsidies: e.g. payments based on current output or prices.
A fourth category of farm subsidy is also permitted for countries whose total farm subsidy payments for a specific product or group of products is less than 5% of the total value of output. These de minimis subsidies can be either ‘product specific’ (PS) or ‘nonproduct specific’ (NPS).
At Doha the US had proposed cutting its ‘amber box’ subsidies by 60% of the 2006 value, capping its ‘blue box’ subsidies at the 2006 value, and halving the 2006 value of the ‘de minimis’ subsidies. However, it had also proposed removing the current ceiling on its ‘counter cyclical payments’ (CCP), by shifting these from the current amber box to the blue box. The CCP allows US farmers to be compensated for low prices, and such compensation would now be unlimited. The EU and others strongly criticized this aspect of the US proposals, with the EU claiming that it encourages farmers to ignore market forces and keep producing. The EU estimated that the net effect of the US proposals would have been to increase total US farm subsidies by a further 10% on current levels, rather than reducing them. Four US commodities - rice, corn, wheat and cotton - have received around three-quarters of US farm aid over the past decade, products vital to many developing countries (e.g. India, China, Brazil) which, with the EU, were equally critical of the US position.
However, the US and many developing nations were also critical of the EU position. The EU had agreed to eliminate its export subsidies by 2013 and to more than halve the existing tariffs on agricultural imports into the EU. However, these offers were criticized as insufficient by the G20 group of middleincome countries as well as the US.
There are concerns that the failure of these global trade talks will herald an era of increased protectionism and the growth of bilateral agreements between individual nations on trade issues, rather than the multilateral approach of the WTO whereby a trade concession offered to one country is available to all countries (‘most favoured nation’ clause).
I Debt and development
An important economic issue in recent times has been the analysis of the impact of external debt on the economies of the LDCs. The main focus of attention has been the cost of servicing foreign debt and the potential benefits from default. It has been argued that if the cost of debt service is higher than the cost of default, then debt repayment by an LDC is not ‘incentive-compatible’. However, a highly indebted developing country (LDCs with the highest ratio of debt to GDP) may still have an incentive to repay because of the fear of losing access to the international capital market.
Reasons for LDC borrowing
The practice of borrowing from foreign countries as a method of promoting economic growth is not new. Historically, most of today’s developed countries, including the US, depended significantly on the imports of foreign capital for achieving a high standard of living. Besides the lessons of history, there are a number of sound reasons to explain the borrowing of LDCs from abroad.
■ Most LDCs have low per capita income and savings. The required rate of economic growth to attain a better standard of living may need a higher level of investment (I) than can be financed by domestic savings (5). Thus, LDCs may wish to borrow foreign capital to eliminate the ‘savings gap’, i.e. I — S > 0.
■ Most LDCs suffer from serious shortages in their foreign exchange earnings as their imports (M) are generally much greater than their exports (X). Such an imbalance, i.e. M — X > 0, is defined as a ‘trade gap’ which could be a serious constraint on achieving a higher rate of economic growth and per capita income. Many LDCs depend substantially on the import of capital and intermediate inputs to increase their production. Sometimes food imports may also play a crucial role in averting the threat of hunger and famine. Imports of foreign technology and skills may help ease the trade gap and accelerate economic growth.
Many LDCs suffer from capital scarcity relative to labour supply which, according to orthodox theory, means that they should enjoy higher returns at the margin on capital flows from the developed countries. In capital-abundant countries, the marginal efficiency of capital (MEC) tends to be lower than in the LDCs. It follows that, as long as capital is fully mobile across nations, capital should flow, on efficiency grounds, from the rich to the poor countries to equalize the global MEC. Of course, such capital movements depend on the funds being invested in sectors where the rate of return is higher than the interest rate charged on the use of foreign capital.
Resolving the debt problem
It has become increasingly clear that past debts are unsustainable for many developing countries. The ratio of total debt to GDP is well over 50% for many developing countries and nearly 100% for the 15 most heavily indebted countries, mainly located in Africa and South America. As a result, payment of interest on such debts is often three or four times the annual export earnings of such countries, making it impossible for such countries to invest in the improvements in education, health and infrastructure so important for development. Many attempts have been made over the years to resolve this debt problem, often involving global institutions such as the World Bank and IMF (see below).
The Jubilee 2000 Campaign mobilized world opinion and led to an easing of the debt burden for many countries. Most recently, the meeting of the eight most advanced industrialized economies (G8) at Gleneagles in Scotland in July 2005 announced a package of measures whereby 18 of the world’s poorest countries will have their debts to the World Bank and IMF wiped out as part of a £30bn package. A further nine countries qualified for similar debt relief by 2007, rising to 37 countries shortly thereafter. Unlike previous deals, the debts of the initial eight countries would be eliminated immediately, and with them the heavy burden of interest payments in servicing the debt.
Role of the IMF and World Bank
As has been mentioned, both institutions have provided support for LDCs in various ways, but only under specified conditions.
IMF ‘stabilization programmes'
IMF stabilization programmes seek to address adverse balance of payments situations whilst retaining price stability and encouraging the resumption of economic growth. As Evers and Nixxon (1997) have indicated, the main components of typical IMF stabilization policies include some or all of the following:
■ fiscal contraction - a reduction in the public sector deficit through cuts in public expenditure and/or rises in taxation;
■ monetary contraction - restrictions on credit to the public sector and increases in interest rates;
■ devaluation of the exchange rate (this is often a precondition for the serious negotiation of a stabilization programme, rather than part of the programme as such);
■ liberalization of the economy via reduction or elimination of controls, and privatization of public sector assets;
■ incomes policy - wage restraint and removal of subsidies and reduction of transfer payments.
Various studies of the impact of IMF stabilization policies from Latin America and elsewhere have suggested that stabilization causes a fall in labour’s share in the distribution of income. A wage freeze has often been involved, reducing the real value of all incomes from labour, especially those employed in the public sector where a wage freeze can be applied most effectively. Stabilization was often found to be associated with declines in public sector employment. Cuts in public expenditure have been an important part of many stabilization programmes, such as health and education, with disproportionate effects on the poor and particularly women. Stabilization has had differing effects on the urban and the rural poor, with the urban poor being hardest hit.
Criticisms of IMF action
Criticisms of the IMF’s activities can be grouped as follows:
■ That IMF programmes are inappropriate. The criticism here is that the IMF’s approach to policy has been preoccupied with the control of demand, and too little concerned with other weaknesses stemming from the productive system of LDCs, e.g. balance of payments problems. By deflating demand the IMF has imposed large adjustment costs on borrowing countries through losses of output and employment, further impoverishing the poor and even destabilizing incumbent governments.
■ That IMF programmes are inflexible. The criticism here is that the IMF has imposed its solutions on LDCs rather than negotiated a more flexible package. This has arguably infringed the sovereignty of states and alienated governments from the measures they are supposed to implement.
■ That IMF support has been too small, expensive and short term. The programmes have been criticized for having been too small in magnitude and too short term in duration for economies whose underlying problems are rooted in structural weaknesses and who often face secular declines in their terms of trade (fall in export prices relative to import prices).
■ That the IMF is dominated by a few major industrial counties. The criticism here is that the industrial countries have sometimes used their control of the IMF to promote their own interests, as for example in using the IMF to shift a disproportionate amount of the debt burden onto the debtor countries rather than forcing lenders (e.g. banks) to accept some of the debt burden. It has been alleged that successive American governments have used their influence to favour (or oppose) friendly (or hostile) LDCs.
World Bank ‘Structural Adjustment Lending' (SAL)
Since 1980 the World Bank has been involved in various types of Structural Adjustment Lending (SAL) which accounts for over 20% of World Bank lending.
These SAL programmes are non-project related; rather they involve lending to support specific programmes of policy which may involve elements of institutional change. These SAL programmes are generally directed towards improving the ‘supply side’ of the borrowing countries, intending to initiate and fund change which will ultimately raise productive efficiency in various sectors of the economies.
Figure 29.6 provides a rather stereotyped but useful overview of the IMF ‘stabilization programmes’ and the World Bank ‘structural adjustment lending’ programmes. It compares the stabilization policies of the IMF (downward and leftward shift in AD) with the structural adjustment policies of the World Bank (downward and rightward shift in AS).
Most of the policies involved in the IMF stabilization programmes have been of a deflationary nature, as can be illustrated using Fig. 29.6. This results in the downward movement, to the left, of the aggregate demand curve (AD) from AD1 to AD2, thus reducing the price level (from P1 to P2) but also reducing output (from Q1 to Q2). The debtor country may be made more competitive in its exports and importsubstitute sectors, benefiting its balance of payments and reducing its debt, but at the cost of lost output and employment.
As was noted earlier, most of the World Bank SAL programmes have sought to improve the supply side of the economy. This results in the downward, to the right, movement of the aggregate supply curve (AS) from AS1 to AS2 in Fig. 29.6, thus reducing the price
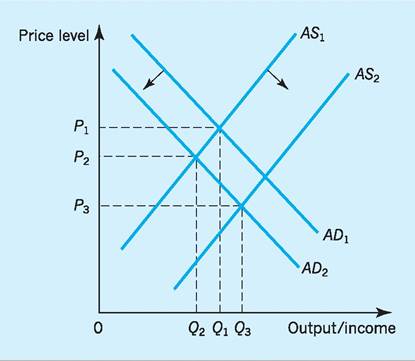
Fig. 29.6 Stabilization versus structural adjustment.
level (from P2 to P1 with AD2) and increasing output (from Q2 to Q3). Clearly the ‘medicine’ via structural adjustment is rather more palatable in that output and employment rise, but only after possibly difficult changes to labour and capital market practices and institutions to improve supply-side conditions. (Note that for diagrammatic purposes we have assumed that the structural adjustment programme of the World Bank occurs at the same time as the IMF stabilization programme. Of course, they may occur independently.)
Key points
■ There are different ways of classifying countries, including those regarded as the less developed countries (LDCs).
■ The conventional measure of real GNP per head has a number of weaknesses as a measure of the standard of living.
■ New measures have been devised which also bring quality of life indicators into the equation, an important example being the Human Development Index (HDI) of the UN.
■ The LDCs have a number of features which create additional problems for policies aimed at increasing growth.
■ In recent times the focus has shifted away from aid and towards trade as a mechanism for supporting economic development.
■ The world debt problem bears down heavily on the LDCs and various initiatives involving the IMF and World Bank have sought to resolve some of these problems.
■ There has been considerable criticism of the nature of the support mechanisms provided to LDCs, especially those from the IMF.
Key terms
■ Human Development Index (HDI) An attempt to broaden the measures of ‘quality of life’ beyond the GNP per head figure, bringing additional indicators such as education, life expectancy and literacy into focus.
■ LDCs Less developed countries, the precise definition varying across bodies such as the World Bank, UN and OECD.
■ Highly indebted countries Those countries with the highest ratio of debt to GDP.
■ Millennium Development Goals (MDGs) Specific targets set by the UN in 2000 for developing economies, to be achieved by 2015.
■ Urbanization The tendency of populations in LDCs to concentrate in urban areas during the development process which often involves industrialization.
■ Offshoring The movement of jobs from developed to developing countries, usually on the basis of lower labour costs.
■ Agglomeration economies Benefits to firms from the growth in size of urban areas.
Now try the self-check questions for this chapter on the Companion Website. You will also find useful links to relevant websites.
References and further reading
Aghion, P. and Howitt, P. (2009). The Economics of Growth, Cambridge MA, MIT Press.
Barro, R. (1991) Economic growth in a cross-section of countries, Quarterly Journal of Economics, 106(20), 407-43.
Bartelsman, E., Haltimanger, J. and Scarpetta, S. (2004) Microeconomic Evidence of Creative Destruction in Industrial and Developing Countries, Policy Research Working Paper No. 3436, Washington DC, World Bank. Benassy-Quere, A. and Coeure, B. (2010) Economic Policy, New York, Oxford University Press.
Bosworth, B. and Collins, S. (2003) The Empirics of Growth: An Update, Washington DC, The Brookings Institution.
Boughton, J. and Lombardi, D. (2009) Finance, Development and the IMF, Oxford, Oxford University Press.
Claugue, C., Keefer, P., Knack, S. and Olson, M. (1999) Contract-intensive money: contract enforcement, property rights and economic performance, Journal of Economic Growth, 4, 185-211.
Denison, E. F. (1967) Why Growth Rates Differ, Washington DC, Brookings Institution.
Dollar, D. and Kraay, A. (2000) Growth is Good for the Poor, Washington DC, World Bank.
Dorfman, R. and Dorfman, N. (1972) Economics of the Environment, New York, Norton.
Durlauf, S. and Blume, L. (2010) Economic Growth. Basingstoke, Palgrave Macmillan. Edwards, S. (2000) Trade Development and Poverty Reduction, Washington DC, World Bank. Evers, B. and Nixxon, R. (1997) International institutions and global poverty, Developments in Economics, Vol. 13, Ormskirk, Causeway Press. Kraay, A. (2003) What Can Cross-country Regressions Tell Us About the Determinants of Poor Growth? Washington DC, World Bank. Krugman, P. and Obstfeld, M. (2010) International Economics: Theory and Policy, Harlow, Financial Times/Prentice Hall.
Lipsey, R. E. (1999) The Location and Characteristics of US Affiliates in Asia, NBER Working Paper 6876, Cambridge MA, National Bureau of Economic Research.
Meadows, D. H., Meadows, D. L., Randers, J. and Behrens, W. W. (1972) The Limits to Growth, Washington DC, Potomac Associates. Parente, S. and Prescott, E. (2000) Barriers to Riches, Cambridge MA, MIT Press.
Pearce, D. W. (1998) Economics and Environment, Cheltenham, Edward Elgar.
Setterfield, M. (2010) Handbook of Alternative Theories of Economic Growth, Cheltenham, Edward Elgar.
Solow, R. M. (1957) Technical change and the aggregate production function,
Review of Economics and Statistics, 39, 312-20.
Todaro, M. and Smith, S. (2009) Economic Development (10th edn), Harlow, Financial Times/Prentice Hall.
UNCTAD (2009) The Least Developed Countries Report 2009: The State and Development Governance, New York and Geneva, United Nations Conference on Trade and Development.
UNCTAD (2010a) Trade and Development Report 2010: Employment, Globalization and Development, New York and Geneva, United Nations Conference on Trade and Development.
UNCTAD (2010b) World Investment Report 2010: Investing in a Low Carbon Economy, New York and Geneva,
United Nations Conference on Trade and Development.
UNDP (2001) Human Development Report 2001: Making New Technologies Work for Human Development, New York, United National Development Programme.
UNDP (2004) Human Development Report 2004: Cultural Liberty in Today’s Diverse World, New York, United National Development Programme.
UNDP (2010) Human Development Report 2010: The Real Wealth of Nations: Pathways to Human Development, New York, United Nations Development Programme.
UNEP (1992) Rio Declaration on Environment and Development, Nairobi, United Nations Environment Programme.
Wallsten, S. (2001) Ringing in the 20th century, Policy Research Working Paper No. 2690, Washington DC, World Bank.
World Commission on Environment and
Development (WCED) (1987) Our Common Future, New York, Oxford University Press.
Weil, D. (2009) Economic Growth (2nd edn), Harlow, Pearson Education.
World Bank (2002) World Development
Report 2002: Building Institutions for
Markets, Washington DC.
World Bank (2004a) Global Economic Prospects 2004: Realising the Development Promise of the Doha Agenda, Washington DC.
World Bank (2004b) World Development Indicators, Washington DC.
World Bank (2005) World Development Report 2005: A Better Investment Climate for Everyone, Washington DC.
World Bank (2010) World Development Report 2010: Development and Climate Change, Washington DC.
Zak, P. (2001) Institutions, property rights and growth, Gruter Institute Working Papers, 2(1), Article 2.