SETTING THE SCENE
23.1.1 Introduction
Seen by some as primarily a manifestation ofinequality in the distribution of income and wealth and by others as a distinctive phenomenon, poverty continues to represent a core challenge for rich countries and their welfare states.
This is reflected in the substantial body of research on poverty in industrialized countries, both country-specific and comparative, which seeks to capture the extent of poverty and how it is changing over time, understand its nature, and assess the effectiveness of policies and strategies aimed at addressing it. Poverty is widely regarded as a key social concern in most rich countries, not only in terms of the quality of life of those affected but also in terms of their wasted potential, as well as the risks to the social fabric and to social cohesion more generally. (Chapter 22 by Martin Ravallion argues that the notion that poverty should and can be eliminated in such countries is a relatively recent development and also discusses in depth the links between poverty and macroeconomic performance.) While the nature of poverty and how best to tackle it remain hotly contested at a political and ideological level, the focus of research has increasingly been on the effectiveness of antipoverty policies and strategies, which the recent economic crisis has served only to reinforce.The aim of this chapter is to highlight some key aspects of recent economic research on the welfare state and antipoverty policy in rich countries and to explore their implications. A core theme will be that the way poverty is conceptualized and measured has fundamental implications for how antipoverty policy is thought about, designed, and implemented. We therefore begin Section 23.1 with a discussion of conceptualization and measurement and key patterns and trends (see also Jantti and Danziger, 2000), before sketching out some core features and approaches to the welfare state and antipoverty policies.
Section 23.2 focuses on the central plank of the modern welfare state’s efforts to address poverty—namely, social protection, discussing the inactive working-age population, child income support, in-work poverty, and retirement and old-age pensions. Section 23.3 looks beyond social protection to discuss social spending on other than cash transfers, the labor market, education, training, and activation. Finally, intergenerational transmission, childhood, and neighborhoods are addressed. Section 23.4 discusses the welfare state and antipoverty policy in the context of the economic crisis that began in 2007—2008 and the implications for strategies aimed at combining economic growth and employment with making serious inroads into poverty. Finally, Section 23.5 highlights directions for future research.23.1.2 Conceptualizing and Measuring Poverty
The definition of poverty underpinning most recent research in Europe relates to exclusion from the ordinary life ofthe society due to lack of resources, as spelled out, for example, in the particularly influential formulation by Townsend (1979). This has also been very influential from a policy-making perspective as evidenced by the definition adopted by the European economic communities in the mid-1980s:
The poor shall be taken to mean persons, families and groups of persons whose resources (material, cultural and social) are so limited as to exclude them from the minimum acceptable way of life in the Member State in which they live.
Poverty from this starting point has two core elements: It is about inability to participate, and this inability to participate is attributable to inadequate resources. Most economic research then employs income to distinguish the poor, with a great deal of research and debate on howbest to establish an income cutoff for that purpose. There are also substantial theoretical and empirical literatures on concepts such as social exclusion (Kronauer, 1998) and on the “capabilities” approach pioneered by Sen (1980, 1993), which have implications for how one thinks about and measures poverty.
Indeed, a concern with “poverty” per se may predominantly be seen as an Anglo-Saxon concern, with concepts such as deprivation and social exclusion more often the focus in countries such as France or Germany and with the “level ofliving” approach to living standards and well-being of central importance in the Nordic countries (and having much in common with Sen’s capabilities approach in general orientation, on which see for example Erikson, 1993).In comparative analysis, the most common approach to deriving income thresholds has been to calculate them as proportions of median income in the country in question, with 50% or 60% ofthe median being the most widely used metric. The underlying rationale is that those falling more than a certain “distance” below the average or normal income in their society are unlikely to be able to participate fully in that society, and notable examples from a very large literature adopting this approach are Atkinson et al. (1995) and the OECD’s recent studies Growing Unequal? (Whiteford, 2008) and Divided We Stand (OECD, 2011a). Such research, like that on income inequality, was for many years bedeviled by differences in definition and measures in the data available for different countries, but sources such as the Luxembourg Income Study (LIS) micro database, the figures produced by Eurostat from micro data for the EU countries, and the database of aggregate poverty (and inequality) estimates assembled by the OECD have greatly improved this situation. Differences across countries and trends over time in relative income poverty measured in this fashion have played a central role in European research and policy debate. Chapter 8 in this volume by Morelli et al. presents evidence on trends in such measures to which we will return below.
This approach to deriving income thresholds can be contrasted with the approach taken by the United States, where the existence of a long-standing official poverty line has fundamentally influenced how poverty is debated and how research is carried out.
That standard goes back to the 1960s when it was originally based on the cost of a nutritionally adequate diet, multiplied by a factor to take account of nonfood spending, but its key feature is that it has subsequently been uprated in line with consumer prices, rather than linked to average income or living standards. To characterize this contrast as between “relative” versus “absolute” notions of poverty would be to oversimplify, because above subsistence-level notions of what constitutes poverty inevitably reflect prevailing norms and expectations. The key issue in making comparisons over time is whether the poverty standard is fixed in terms of purchasing power—that is, “anchored” at a point in time or increases as average living standards rise. As Lampman (1971) put it in a U.S. context, in fighting a “War on Poverty” one may want to monitor how well one is doing in meeting a fixed target rather than redefining the target as income changes. However, over any prolonged period where average living standards are rising, this may lose touch with the everyday understanding of poverty in the society. Thus, an influential expert panel reviewing the U.S. official measure saw poverty in terms of insufficient resources for basic living needs, “defined appropriately for the United States today” (Citro and Michael, 1995).The fact that the “anchored” measure has continued to be seen as relevant in the United States—for all its well-recognized and analyzed technical limitations—is in itself a reflection of the fact that growth in median real incomes has been modest there. In Europe, the set of poverty and social inclusion indicators adopted by the European Union (EU) since 2001 have supplemented purely relative income poverty thresholds with ones anchored at a point in time some years earlier and uprated in line with prices. The onset of the economic crisis from 2007 to 2008, when median income and relative income thresholds actually fell in some countries, proved a salutary reminder of the value of such anchored thresholds.
Similar arguments apply in making comparisons across countries at rather different levels of average income: Neither purely country-specific relative measures nor common thresholds tell the whole story with respect to poverty. In a European context, this was brought to the fore by the accession to the EU in 2004 and 2007 of new eastern countries with much lower levels of average income than the “old” member states.Alternative ways of establishing an income poverty threshold in a rich country have been proposed, for example, by reference to what it costs to buy a specified basket of goods and services, to ordinary expenditure patterns, to standards implicit in social security support rates, or to views in the population about, for example, the income needed to “get by.” This continues to represent a significant theme in poverty research literature, as shown by recent attempts to apply the “basket of goods” approach in a consistent fashion across a variety of European countries (for a discussion of strengths and limitations of these alternatives see Nolan and Whelan, 1996). However, the extent to which this research has affected policy formulation and debate remains quite limited, with the relative and anchored income lines dominating. One suspects this is because of their reasonably straightforward empirical derivation.
In a similar vein, the way household size and composition are taken into account in applying those income lines is, for the most part, rather straightforward. The household is conventionally taken as the income recipient unit, as in the study of income inequality more broadly, assuming that income is shared so members reach a common standard of living. The fact that the types of household identified as poor (much more than the overall poverty rate) can be highly sensitive to the precise equivalence scale employed has been known for some time (Buhmann et al., 1987; Coulter et al., 1992), but in the absence of a more satisfactory alternative emerging from research practice, one has to rely on several commonly used scales (the square root of household size, the “OECD scale,” and the “modified OECD scale”) and (at best) present results with more than one so that this sensitivity can be assessed.
While a number of studies have sought to open up the household “black box” from a poverty perspective, a subset of the research on intra-household inequality, more broadly discussed in Chapter 16 of this volume by Chiappori and Meghir, has had little impact on practice in empirical analysis and policy formulation.The same could be said of the extensive literature on how best to capture the extent of poverty in a single summary indicator, where despite the considerable literature developing sophisticated indicators the most commonly used measure remains the simple headcount. As long ago as in the mid-1970s, Amartya Sen highlighted how the policy maker is faced with the perverse incentive to target the least poor, and Sen’s (1976) and alternative ways of incorporating the “poverty gap” and inequality among the poor have been debated, often derived from a set of axioms representing a priori notions of the properties such a measure should have. The Foster et al. (1984) class ofpoverty measures, for example, are additively decomposable and, additionally, allow for different judgments regarding the importance attached to the extent on inequality among the poor. Such poverty measures that capture poverty intensity also suffer from greater sensitivity to measurement error, especially in the presence of extreme low incomes, which often reflects misreporting,[DXXIV] and as Myles (2000) argues, their mathematical representation may have made their meaning obscure to potential users. The robustness of poverty orderings has also been a long-standing concern in the literature (Atkinson, 1987; Zheng, 2000), and dominance approaches developed for income inequality comparisons have been adapted for use in the poverty context (see Duclos and Makdissi, 2005), but once again this has not entered mainstream empirical practice, where the comparison of poverty headcounts over time or across countries on the basis of one or, at most, a very limited set of thresholds and equivalence scales remains the norm. An awareness of the importance of measurement error and the need to take statistical confidence intervals seriously in such comparisons does appear to be increasing, however (see Goedeme, 2013). There have also been significant improvements in the quality and comparability of income data for poverty analysis in recent years (as is the case for the analysis of income inequality more generally, as brought out in Morelli et al.’s Chapter 8 and in Toth, 2014), largely due to the efforts of organizations such as the OECD, the LIS, and Eurostat as well as national statistics offices.
A substantial strand in recent research on poverty that is increasingly influencing practice has focused instead on questioning what economic research had tended to take for granted: that current income is the most satisfactory, or least bad, yardstick available for identifying the poor. It has instead been argued forcefully that low-income fails in practice to distinguish those experiencing poverty and exclusion, because current income does not capture the impact of savings, debt, previous spending on consumer durables, owner-occupied housing, goods and services provided by the State, work-related expenses such as transport and child care, and geographical variation in prices, because needs also differ in ways missed by conventional equivalence scales (for example in relation to disability), and because income from self-employment, home production, and capital are particularly difficult to measure accurately. One response is to measure financial poverty in terms of consumption rather than income, on the basis that the transitory component is a great deal smaller, but expenditure as measured in household budget surveys often covers only a short period and is not the same as consumption, while low expenditure may be associated with saving and does not necessarily capture constrained resources. Other avenues explored in research have been to impute income from durables, owner-occupied housing and noncash benefits, to broaden the needs incorporated into equivalence scales and to combine survey and other data to improve the measurement of income.
The exploitation of longitudinal data has also been a significant contributor to income-based poverty research. Poverty measures are often based on the income of the household in a specific week, month, or year, but (even if measured accurately) income at a particular point in time may not be representative of the usual or longer term income of the household. Longitudinal data tracking households and their incomes have now become much more widely available, allowing those who move in and out of low income to be distinguished from those who are persistently of low income, and a dynamic perspective on income now plays a central role in research on poverty. Bane and Ellwood (1986) pioneered research on the length of spells in poverty in the United States, and cross-country analysis was pioneered by Duncan et al. (1993). Comparative studies of income poverty dynamics since then include OECD (2001), Whelan et al. (2003), Fouarge and Layte (2005), and Valletta (2006). Movements in and out of poverty are special cases of more general income mobility, discussed in Chapter 10 by Jantti and Jenkins in this volume. Available studies show what the OECD (2001) has summarized as the seeming paradox that poverty is simultaneously fluid and characterized by longterm traps. Many spells in poverty are short and represent only transitory setbacks, and considerably fewer people are continually poor for an extended period of time than are observed in poverty at a point in time, but on the other hand, the typical year spent in poverty is lived by someone who experiences multiple years of poverty; comparison across countries has found poverty persistence to be particularly high in the United States and much lower in countries with lower cross-sectional poverty rates. The EU’s social inclusion indicators now include a measure of persistent poverty, the percentage below the relative poverty threshold in the current year and at least two of the three previous years. More generally, this aspect of poverty research, with its emphasis on trying to understand not only once-off poverty entries and escapes but also the cumulative experience of poverty over years, has had a major impact on the way policy effectiveness is thought about and assessed.
As well as broadening the measurement of income/financial resources and their dynamics, a parallel development in recent poverty research has sought to go beyond income, with a view to:
• identifying the poor more accurately and understanding the causal processes at work,
• capturing the multidimensional nature of poverty, and/or
• encompassing social exclusion conceived as something broader than “financial poverty.”
Nonmonetary indicators of deprivation have been used for quite some time to directly capture different aspects of living standards and social exclusion (either on their own or combined with low income), to validate an income poverty threshold, and/or to bring out graphically what it means to be poor; the review of the literature on measures of material deprivation in OECD countries by Boarini and Mira d’Ercole (2006) listed more than 100 studies. Over the past decade or more, nonmonetary indicators measured at micro levels are also increasingly being used to capture the multidimensional nature of poverty and of social exclusion more broadly—especially in Europe, where the concepts of social exclusion and social inclusion have come to be widely used alongside poverty in research and policy circles, unlike in the United States where they have so far had little purchase. Comparative analysis of datasets such as the European Community Household Panel Survey (ECHP) organized by Eurostat and carried out in most of the (then) EU-member states from the mid-1990s to 2001, and the EU-Statistics on Income and Living Conditions (EU-SILC) data-gathering framework, which replaced it, has identified distinct dimensions of disadvantage (see Eurostat, 2005; Guio, 2009; Guio and Macquet, 2007; Nolan and Whelan, 2010, 2011; Whelan et al., 2001), bringing out that low income alone is not enough to predict who experiences poor housing, neighborhood deprivation, poor health and access to health services, and low education. The measurement of multidimensional poverty and inequality, discussed in Chapter 3 of this volume by Aaberge and Brandolini, raises complex issues not only about the best way to identify and empirically capture particular dimensions, but also about how information about different aspects of deprivation or exclusion is best summarized across those dimensions (see Aaberge and Peluso, 2012; Atkinson, 2003; Bourguignon and Chakravarty, 2003; Tsui, 2002).
The focus on multidimensionality has gone well beyond a purely academic concern to also influence the way poverty reduction targets have been framed, both nationally and at EU level. The national poverty reduction target adopted in Ireland in the 1990s, for example, was framed in terms ofthe combination of low income and “basic” deprivation, and lively debates about how best to frame targets for child poverty in the United Kingdom have centered on the role of multidimensionality. Since 2001 the EU’s social inclusion process has at its core a set of indicators designed to monitor progress and support mutual learning that is explicitly and designedly multidimensional, including but going beyond income-based poverty indicators, including indicators of material deprivation and housing deprivation (see Atkinson et al., 2002; Marlier et al., 2007; Nolan and Whelan, 2011; Chapter 3). Even more strikingly, when in 2010 the EU adopted the Europe 2020 strategy for jobs and growth, which for the first time included poverty reduction among its high-level targets, the target population for poverty reduction was identified as those:
• below the 60% of national median threshold relative income threshold, and/or;
• above the material deprivation threshold, and/or;
• in a jobless household.
A total of23% ofEU citizens were identified as “at-risk-of-poverty and social exclusion,” as this was labeled, significantly more than the 16% below the “headline” 60% of median relative income threshold, and EU leaders pledged to bring at least 20 million of these people out of poverty and exclusion by 2020. While once can readily criticize the logic and implications of this precise combination of elements (on which see Nolan and Whelan, 2011), it represents a powerful illustration of the role that multidimensional measures, and direct measures of material deprivation as a central component, have come to play in framing European antipoverty policy.
The European poverty target evolved from a process of development and adoption of social inclusion indicators at EU level over the previous decade (see Atkinson et al., 2002), which has had a significant influence on data and analyses of poverty and antipoverty policy in Europe, and indeed on the way poverty is thought about and research is framed. This serves as an important example of the broader point that a good deal of research on poverty is carried out or sponsored by bodies—national or international— that have an interest in demonstrating that particular sets of policies or orientations toward antipoverty strategy are or are likely to be successful. In a more subtle way, their perspectives will influence the data and indicators available to researchers, and thus the analyses that can be readily undertaken. There have been enormous advances in the availability of accessible micro data in recent years, which has fundamentally influenced poverty research and helped to “democratize” it, but the influence of national governments and international organizations remains substantial.
Finally, in discussing how poverty research is approached, differences in disciplinary perspectives are also important. For example, researchers from an economics perspective are generally more comfortable with financial indicators of living standards and exclusion, and highlight the role of economic incentives in understanding and tackling poverty, whereas sociologists have often been more open to employing nonmonetary measures and highlight the role of social stratification and social context. Having said that, there has been significant blurring of disciplinary boundaries, and poverty research has become a site for particularly fruitful collaborations between inter alia economists, sociologists, social policy analysts, geographers, anthropologists, educationalists, epidemiologists, psychologists, and indeed geneticists and neuroscientists, of which this chapter can only give a flavor, concentrating for the most part on the economics literature.
23.1.3 Key Patterns and Trends
As the previous section highlighted, the most common practice in comparative research on poverty remains the application of relative income poverty thresholds and comparisons of headcounts of the proportions falling below those thresholds in different countries. On that basis, poverty rates for various OECD countries based on the data in the LIS have been compared in, for example, Atkinson et al. (1995) and Fritzell and Ritakallio (2004). The OECD has assembled estimates for many of its member countries at intervals from 1980, which have underpinned its important studies in this area (notably OECD, 2008, 2011a) and annual estimates are also now produced by Eurostat for all the member states of the EU. This, together with national data, provides a substantially improved evidence base for the study of poverty across countries and over time.
Chapter 8 in this volume by Morelli et al. summarizes broad trends in relative income poverty over time, with figures from the LIS suggesting that from the mid-1980s to mid- 2000s relative income rates generally rose or stayed stable, with very few examples of significant falls. The OECD’s analysis of the estimates of relative income poverty it assembled, as examined in Burniaux et al. (1998), Forster and Pearson (2002), Forster and Mira d’Ercole (2005), Growing Unequal? (Whiteford, 2008), and Divided We Stand (OECD, 2011a), highlighted that the most common direction of change in those figures was upward. The corresponding data produced by Eurostat covers only (most of) the countries in the EU-15 for the period from the mid-1990s to 2001, based on the ECHP, while the expansion ofthe Union to 27 member states was accompanied by the development of a new statistical apparatus underpinning these estimates, EU-SILC, from about 2004; this means that trends before 2004 can be assessed only for the “old” member states and, for many of these, with a break in the series in the early 2000s, which affects comparability. Nonetheless, the feature displayed by these figures highlighted by a number of studies is the disappointing progress in bringing relative income poverty rates down despite strong growth in employment in some countries over the decade to the mid-2000s (see, for example, Cantillon, 2011).
It is important to note, however, that there is considerable variability in country experiences and that the stability in the overall poverty rate can mask major underlying shifts for different groups. The OECD’s studies, for example, show that the trend in relative income poverty for working-age people in the second half of the 1990s and into the 2000s was generally upward, often reflecting a decline in the poverty-reducing impact of taxes and transfers, but pensioners saw sizeable declines in many countries. So policies operating with respect to one important target group—such as older persons—could be having substantial success in reducing poverty while that is obscured by the impact of changes for other groups. In a similar vein, child poverty—the focus of particular attention from policy makers in recent years—may not necessarily move in the same direction as the overall poverty rate, with the U.K. providing an example where trends in child versus overall poverty have deviated substantially over the past two decades.
The OECD has also usefully documented trends in overall poverty taking a threshold “anchored” at 50% ofthe median in the mid-1980s and then indexed to price changes. On this measure, all OECD countries achieved significant reductions in “absolute” poverty up to year 2000. In countries like Ireland and Spain, which experienced very rapid income growth, poverty in 1995 measured this way was one-sixth the level of 10 years earlier. The U.S. poverty rate on this basis shows a decline from the mid-1980s up until 2000, though smaller than the average decline of the 15 OECD countries included in the study (Forster and Mira d’Ercole, 2005). In a similar vein, it is striking that some countries where relative income poverty remained quite stable or even rose have seen very marked falls in levels of material deprivation, notably some ofthe lower-income countries joining the EU from 2004 as the common indicators of material deprivation now also produced by Eurostat serve to demonstrate. The evolution of alternative measures of poverty since the onset of the economic crisis across the OECD from 2007 to 2008 is also of central relevance, as we discuss in detail in the final section of this chapter.
National studies for various countries also shed light on poverty trends and the factors at work, though given differences in methods and approaches, it is more difficult to generalize from them. In the United States, for example, most analyses of long-term poverty trends focus on the official poverty rate, which is not linked to average or median income (see Hoynes et al., 2006; Meyer and Wallace, 2009; Smeeding and Thompson, 2013). This (and variants of it) was higher in the 1980s than in the 1970s but despite subsequent falls was still as high in the mid-2000s as it had been in the mid-1970s. Stagnant median wage growth, rising inequality, and the evolution of unemployment have been highlighted in studies, with the changing wage distribution assigned a central role in explaining poverty trends. Studies of poverty trends in the United Kingdom, by contrast, have generally focused on relative income poverty and have highlighted the role of changes in the transfer and direct tax systems in the increase recorded in the 1980s and into the 1990s and then stabilization from the late 1990s. However, as Dickens and Ellwood (2003) emphasize in a comparative study of Britain and the United States, the factors influencing poverty trends can differ substantially between absolute and relative measures as well as countries, and it is hazardous to generalize.
Trends in poverty over time, overall, and for specific subgroups offer one important window into the causal factors involved and into “what works” in addressing poverty, especially in terms of the impact of changes made in social protection and tax systems. It is also striking that the ranking of countries in terms of relative income poverty rates tend to be fairly stable over time. Table 23.1 shows the percentage of people in households falling below 50% and 60% of median (equivalized) disposable household income in 25 OECD countries around the mid-2000s. The simple fact that there is considerable cross-country variation in poverty measured this way—with some countries displaying percentages below 60% ofthe median as low as 11—12% and at the other extreme countries having figures twice that high—and that the ranking of countries tends to be reasonably stable over time, suggests that there are important structural factors at work from which antipoverty strategies have much to learn.
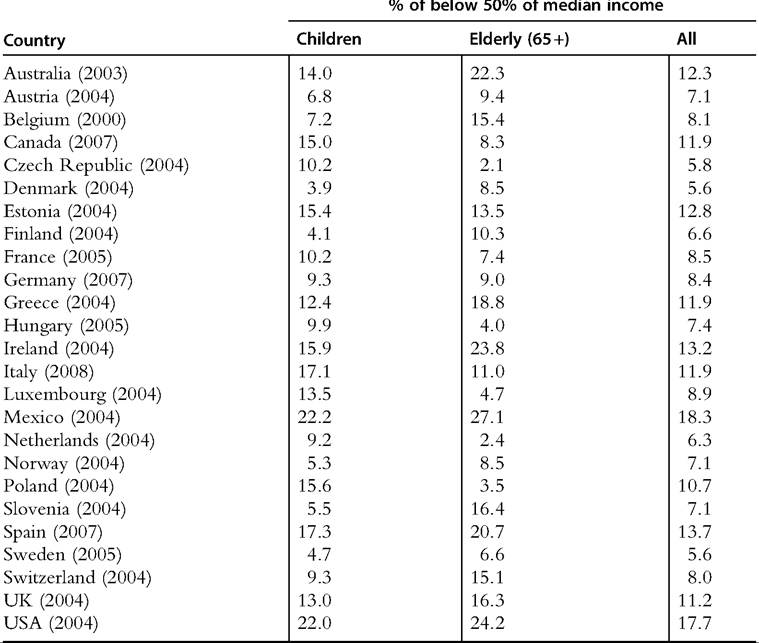
A similar point is brought home by reference to the variation across countries in relative income poverty rates for specific population subgroups. Table 23.2 illustrates this with the rates for children and older persons falling below 50% of national median income, compared with the population as a whole. Children have above-average rates in about half the countries shown, with the gap being particularly wide in the United Kingdom and the United States, but in a substantial minority, their rate is below average. The elderly have an above-average rate in most countries, with substantial variation in the size of the gap, and there are some instances where their rate is well below the average. A similar comparison across the EU 27 using data from EU-SILC shows similar patterns. So, this reinforces the notion that there is much to be learned in policy terms from analysis of the situation and treatment of similar groups in different countries.
The same is true of other groups that are generally thought of as vulnerable. For example, the unemployed face a significantly heightened risk of relative income poverty virtually everywhere, but the gap between them and the employed varies widely across countries. Similarly, single parents often face much higher risks of poverty than couples with one or two children, but that gap varies a great deal. As OECD (2005) points out, in
Table 23.1 Income poverty rates in OECD countries, mid-2000s
| Country Australia (2003) | % below 50% of median income 12.3 | % below 60% of median income 20.4 |
| Austria (2004) | 7.1 | 13.4 |
| Belgium (2000) | 8.1 | 16.1 |
| Canada (2007) | 11.9 | 18.7 |
| Czech Republic (2004) | 5.8 | 11.4 |
| Denmark (2004) | 5.6 | 13.2 |
| Estonia (2004) | 12.8 | 20.4 |
| Finland (2004) | 6.6 | 13.7 |
| France (2005) | 8.5 | 14.9 |
| Germany (2007) | 8.4 | 14.6 |
| Greece (2004) | 11.9 | 19.6 |
| Hungary (2005) | 7.4 | 12.5 |
| Ireland (2004) | 13.2 | 22.0 |
| Italy (2008) | 11.9 | 19.7 |
| Luxembourg (2004) | 8.9 | 13.8 |
| Mexico (2004) | 18.3 | 25.5 |
| Netherlands (2004) | 6.3 | 11.8 |
| Norway (2004) | 7.1 | 12.8 |
| Poland (2004) | 10.7 | 17.2 |
| Slovenia (2004) | 7.1 | 11.7 |
| Spain (2007) | 13.7 | 20.3 |
| Sweden (2005) | 5.6 | 12.0 |
| Switzerland (2004) | 8.0 | 14.8 |
| UK (2004) | 11.2 | 19.0 |
| USA (2007) | 17.7 | 24.4 |
Source: LIS downloaded.
many countries it is not living in single-parent households per se that increases risk, but rather the likelihood that the parent is not at work. As we shall see, this type of comparative analysis plays a central role in research aimed at informing antipoverty policies and strategies.
It is also worth noting that although relative income poverty measures are sometimes dismissed as really only capturing inequality, in fact a country (or group within it) can have zero poverty despite substantial inequality. To give concrete examples, in both the Netherlands and New Zealand the incidence of relative poverty among the elderly (with the 50% of median threshold) is close to zero, although there is substantial income inequality among their elderly populations. The redistributive effort required to truncate the distribution at a widely used poverty threshold like 50% of median equivalent income is in fact a fraction of the actual redistributive flows that take place in most countries. In practice, as Figure 23.1 shows, broadly speaking, where inequality in disposable income is
Table 23.2 Income poverty rates for children and elderly in OECD countries, mid-2000s
Source: LIS downloaded.
high relative income poverty rates tend to be high as well, but similar inequality levels can be associated with quite different levels of relative income poverty.
23.1.4 The Welfare State and Poverty
As Barr (2001) put it, the welfare state combines the role of piggy bank and Robin Hood, providing collective insurance against social risks while also aiming to ameliorate need and poverty. Redistribution can be horizontal, across the life cycle, or vertical between higher and lower incomes. Poverty reduction is by no means the sole criterion against which the success of welfare state institutions would or should be judged—whether at a point in time or over the life cycle—but it would be widely accepted as among the core aims. Research aimed at assessing success or failure in those terms can focus at the aggregate level, at specific population subgroups, or at particular institutional
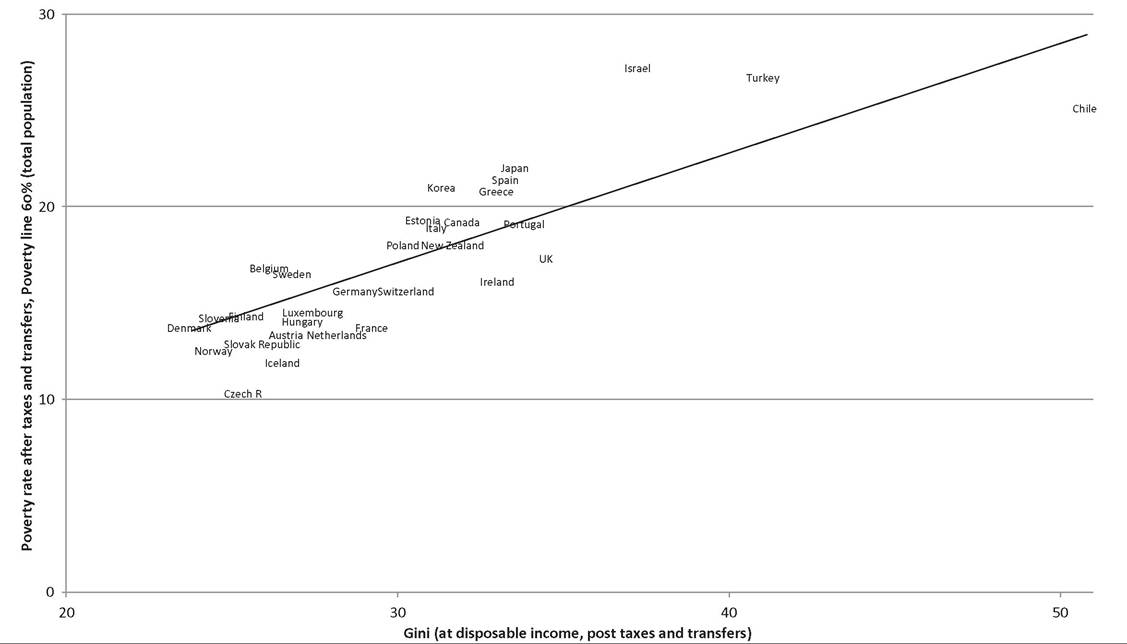
Figure 23.1 Gini coefficient for disposable income and relative income poverty (60% median), 2009, OECD. Source: OECD income distribution database.
structures, interventions, or innovations and can be for a particular country or from a comparative perspective.
The nature of that research is also multifaceted. At one end of the spectrum one can locate studies of the effectiveness of very particular aspects of institutional structures or changes in those structures on the target population to whom they are directed. Such evaluation studies employ a wide variety of analytical and technical approaches, which have been the subject of intensive development in the economics literature in recent years. While the outcome studied is occasionally whether people are lifted out of poverty, there is a much more extensive literature focusing on effectiveness in getting unemployed persons into employment, improving performance in school, keeping people out of jail or improving their health, all of which may be expected to impact on poverty status. While randomized controlled trials are recently in vogue in this context—though the negative income tax experiments conducted in the United States and Canada in the 1970s provide early large-scale examples —more commonly, assessments are not based on such an approach. The methods employed include reduced form or limited information models (including least squares, matching methods including propensity score matching, instrumental variable analysis or the closely related regression discontinuity design approach, and difference in difference estimation) versus the estimation of structural models/parameters.3 Such methods are discussed extensively in other books in this series (notably those focused on labor economics, since assessing the impact of labor market programs has been a particularly fertile field of application); purely from the point of view of research on poverty, though, while influencing specific national reform efforts they have had much less impact on the way antipoverty policy is thought about more broadly.
In that respect, comparative analysis of poverty outcomes and redistributive effort across countries over time continues to dominate (see Cantillon et al., 2014). This is underpinned by the fact that the direct effect of transfers and direct taxes on measured poverty is seen to differ very substantially across countries. OECD analysis concludes that the best-performing countries succeed in lifting about two-thirds of their pre-tax/transfer poor above the threshold, while others only manage to move one-quarter above. Recent EU statistics tell a similar story, as Table 23.3 illustrates: Welfare systems reduce the risk of poverty by 38% on average across the EU, but this impact varies from under 15% to more than 60% across the member states. Some countries achieve better “efficiency” (i.e., reduce poverty more for each euro or dollar spent) through targeting low-income groups, and the role of means-testing is one of the most hotly debated aspects of antipoverty policy to which we return below. However, the prior point to be made here is that
2 See for example Levine et al. (2005).
3 For discussion ofthe advantages and disadvantages of alternative approaches see Chetty (2009), Deaton (2010), Heckman and Urziia (2010), Imbens (2010), and Heckman (2010).
Table 23.3 Income poverty rates pre- and post-transfers in EU countries, 2007
| Country | Pre-transfer poverty | Post-transfer poverty | Reduction in poverty | |
| % | % | % point | % | |
| Belgium | 27.5 | 15.2 | 12.3 | 44.7 |
| Bulgaria | 25.5 | 22 | 3.5 | 13.7 |
| Czech Republic | 20.1 | 9.6 | 10.5 | 52.2 |
| Denmark | 27.1 | 11.7 | 15.4 | 56.8 |
| Germany | 24.8 | 15.2 | 9.6 | 38.7 |
| Estonia | 25.2 | 19.4 | 5.8 | 23 |
| Ireland | 33.1 | 17.2 | 15.9 | 48 |
| Greece | 23.7 | bgcolor=white>20.33.4 | 14.3 | |
| Spain | 23.9 | 19.7 | 4.2 | 17.6 |
| France | 26.4 | 13.1 | 13.3 | 50.4 |
| Italy | 24.1 | 19.8 | 4.3 | 17.8 |
| Cyprus | 21 | 15.5 | 5.5 | 26.2 |
| Latvia | 27.2 | 21.2 | 6 | 22.1 |
| Lithuania | 25.5 | 19.1 | 6.4 | 25.1 |
| Luxembourg | 23.4 | 13.5 | 9.9 | 42.3 |
| Hungary | 29.3 | 12.3 | 17 | 58 |
| Malta | 21.2 | 14.8 | 6.4 | 30.2 |
| Netherlands | 20.6 | 10.2 | 10.4 | 50.5 |
| Austria | 24.7 | 12 | 12.7 | 51.4 |
| Poland | 26.5 | 17.3 | 9.2 | 34.7 |
| Portugal | 24.2 | 18.1 | 6.1 | 25.2 |
| Romania | 30.9 | 24.8 | 6.1 | 19.7 |
| Slovenia | 23.1 | 11.5 | 11.6 | 50.2 |
| Slovakia | 18.2 | 10.6 | 7.6 | 41.8 |
| Finland | 28.9 | 13 | 15.9 | 55 |
| Sweden | 27.5 | 10.5 | 17 | 61.8 |
| UK | 29.7 | 18.6 | 11.1 | 37.4 |
Source: Eurostat downloaded.
the pattern of incomes from the market, taken as the baseline for comparison, will itself be very much influenced by social transfers and indeed by welfare state institutions more broadly. The existence of social transfers allows substantial numbers of households to have no income from the market, which would not be sustainable otherwise, and the welfare state also affects incentives to work and save in many other ways: the “no welfare state” counterfactual is not known.
A favored mode of analysis in comparative studies is to take a set of countries—at a point in time or pooling cross-sections over time—and assess the relationship between poverty outcomes and a wide set of independent variables reflecting population structures, welfare spending levels and aspects of labor market and welfare state institutions. (These parallel, and sometimes overlap, similar studies employing income inequality as dependent variable reviewed in depth in Chapter 19 of the current volume by Forster and Toth.) Particularly, influential studies in this vein include Korpi and Palme (1998), Moller et al. (2003), and Kenworthy (2011). In such comparative analysis, countries may be taken as individual units of observation, or they may be grouped together into different “welfare regimes,” designed to capture key commonalities/differences in welfare state institutions. Esping-Andersen’s (1990) distinction of three distinct regimes has been highly influential: the liberal/Anglo-Saxon countries with minimal public intervention and a preference for targeting and reliance on the market, the social democratic/ Nordic countries with comprehensive social entitlements, and the continental welfare states with conservative origins built around social insurance but often along narrowly defined occupational distinctions and a significant degree of reliance on the family (see also Esping-Andersen, 1999, 2009). A fourth “southern” regime is also generally distinguished (Ferrera, 1996), and the treatment ofthe formerly communist countries of eastern Europe is also a matter for debate. The relationship between aggregate social spending and poverty levels looks systematically different for the countries that joined the EU in 2004 versus the “old” 15 members (see Tsakloglou and Papadopoulos, 2002), but treating them as a single “regime” may not be satisfactory. Many empirical studies have brought out the extent to which conventional indicators of (relative income) poverty vary systematically across welfare regimes (for a recent example see Whelan and Maitre, 2010), and highlight the consistently low rates found in Nordic countries compared with the generally high (though varying) ones seen in the liberal and southern European countries. Looking in some detail at the make-up of household income by source, Maitre et al. (2012) show that countries in the Anglo-Saxon/liberal regime were distinctive in the extent to which low-income households were dependent on social transfers, and also in the extent to which that dependence served as a predictor of material deprivation. The social democratic and corporatist regimes were characterized by a more modest degree of welfare dependence among low-income households, while in the southern Mediterranean countries welfare was not strongly associated with low income and was a particularly poor predictor of deprivation.
Aggregate-level comparative analysis of this type suggests that while transfer and tax systems are undoubtedly key in underpinning variations in poverty levels, other institutional features also contribute in the best performers, notably high levels of minimum wage protection and strong collective bargaining compressing wages, more extensive public and subsidized employment as well active labor market programs, higher levels of public spending on education, and so forth (see also Chapter 19 in this book). Disentangling the effect of these various factors is inherently fraught with difficulties, and that is where simulation via tax-benefit models, discussed in detail in Chapter 24 of this volume by Figari et al. may be particularly helpful. The Euromod research program in particular has enabled comparative tax-benefit simulation analysis across the EU (Figari and Sutherland, 2013; Immervoll et al., 2006) with major implications for policy. To take just one example, Cantillon et al. (2003) showed that simply increasing spending on transfers would have a limited impact on poverty in some EU countries because much of it would go to those already above the poverty line, particularly in the southern European welfare states where pensions dominate.
Another central strand of comparative poverty research has focused on analysis of the characteristics associated with being in poverty and the underlying processes involved, employing micro data. This has been the subject of a very wide variety of studies covering many countries, both descriptive and econometric. Broadly speaking, the types of individual or household seen as at particular risk of poverty include those with low levels of education and skills, the low paid, the unemployed, people with disabilities, single parents, large families, the elderly, children, ethnic minorities, migrants, and refugees. However, there is substantial variation across countries in the patterning of risk, with major implications for how the underlying processes are understood and for policy. The extent to which individual characteristics, qualifications, or experiences manifest themselves in high-poverty rates is clearly seen to depend on the household, labor market, and institutional settings in which those “disadvantages” are experienced. To take one example, the poverty risk for the unemployed compared with others is seen to depend on whether they have dependants, whether there are others in the household at work, and how the welfare state and its institutions try to cushion the impact of unemployment, most importantly through social protection. Strikingly, a high employment rate is clearly not a sufficient condition for low poverty among the working-aged population, which as we discuss below is of central relevance when boosting labor market participation is at the heart of antipoverty policy in many countries.
Finally, the availability of longitudinal data has also allowed the development of econometric modeling of poverty dynamics, which seeks to link observed movements into or out of poverty over time to changes in the earnings, labor force participation, and composition of the household. Duncan et al. (1993) were the first to do so in a comparative setting. A distinction is often made in such dynamic analyses between income “events,” such as changes in earnings or benefits, and demographic “events,” such as the arrival of a new child, partnership formation, death, marital dissolution, or offspring leaving home. The comparative dynamic analysis by OECD (2005) suggests that changes in household structure may be less important in poverty entries and escapes in European countries than in the United States, with changes in transfers as well as earnings seen to be important in the EU and to a lesser extent in Canada, but much less so in the United States.
23.2.