SOCIAL PROTECTION AND REDISTRIBUTION
23.2.1 Introduction
Cash spending as a percentage of GDP is the most widely used measure of how much “effort” is being made to directly redistribute income. Despite its widespread use, this measure has some well-documented shortcomings.
First, it ignores the need to jointly analyze benefit and tax policies. Conventional measures of (gross) social expenditure tend to overestimate the cost of welfare in Denmark, Finland, and Sweden, where a substantial amount of benefit spending is clawed back through taxation. Conversely, in the Czech Republic and Slovenia, a substantial share of social spending takes the form of tax breaks for social purposes rather than cash transfers (Adema et al., 2011). Another widely acknowledged weakness of this measure is that it is a very imperfect indicator of policy intent and policy design. A high level of spending may result from very generous benefits flowing to small numbers of people and not necessarily people occupying the bottom end ofthe distribution—for example, government elites. Yet it may also result from relatively small benefits flowing to a large number of people (De Deken and Kittel, 2007).Yet, several studies have established a strong empirical relationship at country level between the overall level of social spending and various measures of inequality and inequality reduction, including (relative) poverty. This is arguably one ofthe more robust findings of comparative poverty research over the past decades (Atkinson et al., 1995; Ferrarini and Nelson, 2003; Gottschalk and Smeeding, 1997; Immervoll and Richardson, 2011; Kenworthy, 2004, 2008, 2011; Kraus, 2004; Nolan and Marx, 2009; OECD, 2008; Pestieau, 2006). Notable in these analyses is that no advanced economy achieved a low level of inequality and/or relative income poverty with a low level of social spending, regardless of how well that country performed on other dimensions that matter for poverty—namely, employment.
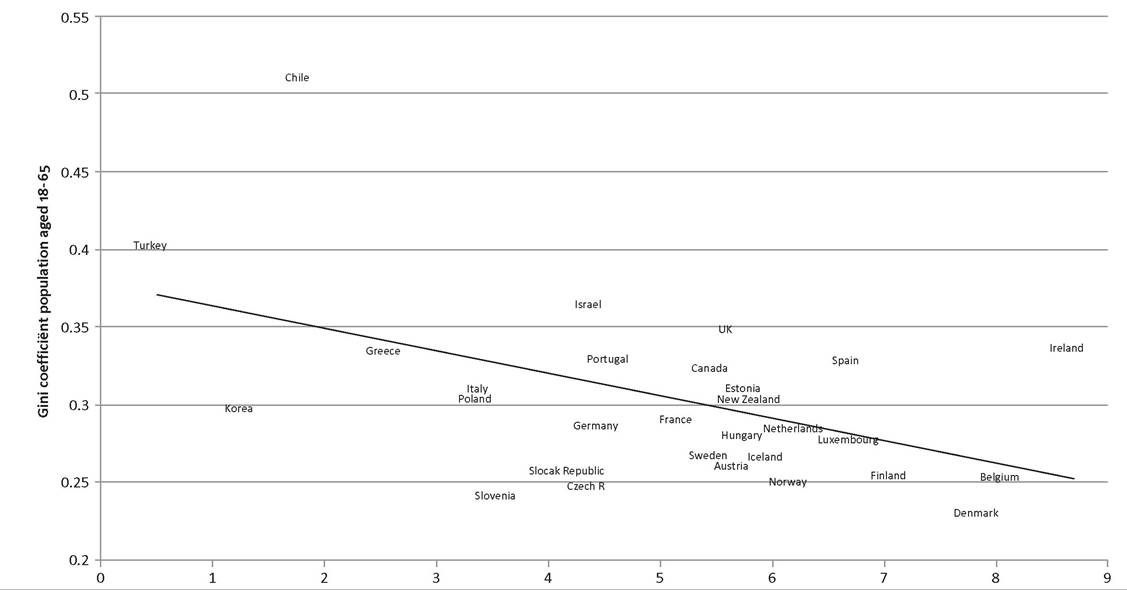
Contrarily, countries with relatively high social spending tended to have lower inequality and poverty. Here the extent of cross-country variation is always more significant, with some countries achieving more limited inequality/poverty reductions despite high social spending.The number of countries for which internationally comparative data are available has increased over recent years recently. As Figure 23.2 shows, there are now a number of countries (Czech Republic, Slovakia, Slovenia, as well as Korea) that do combine fairly low levels of social expenditure with low relative poverty rates and income inequality. For the Central European countries, part of the explanation may lie in a reliance on tax breaks as social policy tools, which are not captured in gross social spending indicators. More generally, the redistributive impact of taxes is not captured here (Verbist, 2004; Verbist and Figari, 2014).
This relatively strong relationship between social spending and poverty at the country level probably does not simply reflect the direct impact of transfers only: High-spending countries have other institutional features that contribute, notably high levels of minimum wage protection and strong collective bargaining compressing wages (hence limiting overall inequality), more extensive public and subsidized employment as well active labor market programs, higher levels of public spending on education, and so forth. Disentangling the effect of these various factors is inherently fraught with difficulties. There may in fact be mechanisms of mutual reinforcement between these factors
Public social expenditure, cash, all functions (excl. Old age & survivors)
Figure 23.2 Cash public social expenditure and income inequality on the working age in OECD countries, 2009. Note: Gini coefficient Ofequivalized disposable household income among the population aged 18-65.
Source: OECD Divided We Stand (Gini); OECD SOCX (social expenditure).(Beramendi Alvarez, 2001). Barth and Moene (2009) argue that a more equal wage distribution leads to welfare generosity through a process of political competition. In turn, more income redistribution produces more equality. The authors hypothesize that this “equality multiplier” operates mainly through the bottom of the income distribution: The amplification occurs where wages near the bottom of the distribution are compressed, not where higher incomes are compressed. They find empirical support in their analyses on 18 OECD countries over the years 1976-2002.[525]
While in theory, low or moderate levels of social spending could produce low poverty rates if resources were well targeted, the reality remains that almost no advanced economy achieves a low (relative) poverty rate, or a high level of redistribution, with a low level of social spending. Large, universal welfare systems, while on paper being least distributive, distribute in fact the most. Systems that by design strongly target resources to toward the poorest tend to be in fact less redistributive. Korpi and Palme (1998) have called this the “paradox of redistribution.”
There is a long-standing controversy in welfare state literature on the question of whether targeting benefits toward the bottom part of the income distribution actually enhances the redistributive impact of welfare state policies, especially of social transfer policies. This issue is of far more than academic importance. In its 2011 Divided We Stand?, the OECD states that “redistribution strategies based on government transfers and taxes alone would be neither effective nor financially sustainable.” In this context, the OECD (2011a) calls for “well-targeted income support policies.” Organizations like the IMF and the World Bank have long advocated targeted benefits. The issue of targeting will probably gain even more poignancy in a post-crisis period marked by continued and, in some cases, increased budget austerity.
The debate on targeting is still marked by opposed views. On the one side there are those who believe that a welfare state can only fight poverty effectively and efficiently (i.e., cost-effectively) when benefits are mainly targeted to those most in need—that is, when benefits are selective. The straightforward argument here is that selective benefit systems are cheaper because fewer resources are “wasted” on people who are not poor. Lower public expenditures imply lower taxes, which in turn are said to be conducive to economic growth. Economic growth, the argument proceeds, benefits the poor directly (although not necessarily proportionally so) and increases at the same time the fiscal base for redistributive policies.
This view of selectivity has never been commonly shared. Two sorts of arguments underpin this more critical stance. First, there are technical considerations. Van Oorschot (2002) sums up the most important dysfunctions of means-testing. First, these include higher administrative costs. Establishing need or other relevant criteria require monitoring, whereas universal benefits allow for less complex eligibility procedures. Furthermore, means-tested benefits are subject to higher non-take-up, partly because of stigmatization issues. Finally, and perhaps most importantly, targeted benefits can give rise to poverty traps, where benefit recipients have little incentive to work because this would entail loss of benefits.
A second line of counterargument is that proponents of selectivity pursue a “mechanical” economic argument that makes abstraction of the political processes, which determine how much is actually available for redistribution. The reasoning is that, paradoxically, in countries with selective welfare systems fewer resources tend to be available for redistribution because there is less widespread and less robust political support for redistribution. As a consequence, the redistributive impact of such systems tends to be smaller. To put it differently, some degree of redistributive “inefficiency” (the Matthew-effect) is said to foster wider and more robust political support for redistribution, including to the most needy.
This follows from the fact that a universal welfare state creates a structural coalition of interests between the least well-off and the politically more powerful middle classes (median voter theorem). By contrast, a selective system entails an inherent conflict between the least well-off, by definition the sole recipients of social transfers, and the better-off, who fund the system without the prospect of getting much out of it.The juxtaposition outlined above forms the starting point for Korpi and Palme’s highly influential “Paradox of Redistribution,” a paper in which they claim that more selective systems, paradoxically, have a smaller redistributive impact than universal systems offering both minimum income protection as well as income security and cost compensations (for children) in a broader sense. Korpi and Palme (1998) find that, in effect, this relationship is mediated by the relative size of available means for redistribution. Countries with selective redistribution systems, they argue, spend less on redistribution, at least in the public sector. In essence, selective systems are generally smaller systems.
The degree of redistribution is measured here by comparing the actually observed income inequality or at-risk-of-poverty rate with a rather unsophisticated “counterfactual” distribution (Bergh, 2005). In theory this counterfactual ought to accurately reflect the income distribution that would prevail in the absence of social transfers. However, the construction of this counterfactual is hampered by theoretical and practical problems. In most cases, including in Korpi and Palme’s paper, pre-transfer income is simply calculated by deducting observed social transfers and re-adding observed taxes. Full abstraction is thus made of any behavioral effects that a change in transfer/tax regime would entail. While patently less than perfect, the reality is that no satisfactory method exists to adequately model such behavioral effects. Many studies have pursued similar empirical approaches—for example, Nelson (2004, 2007).
Another critique has been formulated by Moene and Wallerstein (2003) who have argued that analyses of redistribution need to be done at a more disaggregated level than “the welfare system” because the determining redistributive principles may differ substantially for, say, unemployment, health care, or pensions. Some schemes may rest heavily on the insurance principle, while others may put more weight to the need principle. Universality and selectivity can coexist within one system. Yet, Moene and Wallerstein (2001) also conclude that universal provisions provoke the largest political support because of the higher chance of middle-class citizens to become a beneficiary. Some opinion-based studies also confirm that universal welfare schemes enjoy broader support (Kangas, 1995).
Some recent studies, however, claim that the link between redistribution and universal provision has substantially weakened, or even reversed over time. Kenworthy (2011) reproduces and updates Korpi and Palme’s analyses, which related to the situation in 11 countries as of 1985. Kenworthy’s findings confirm that countries with more universal benefits achieved more redistribution (measured in the size of redistributive policies in the budget) for the period from 1980 to 1990. By 1995, the image becomes less clear. Data for 2000 and 2005 seem to indicate that there is no longer any association (either positive or negative) between the two variables. Evidently, the findings are based on a small number of cases, which make them particularly sensitive to outliers. A trend toward more targeting in Denmark, in conjunction with an evolution toward more universal benefits in the United States, is largely responsible for the shift in conclusions. Moreover, the new findings may be driven to some extent by the growing share of pensions in social spending. Kenworthy (2011, p. 58) writes about this: “This by no means settles the question, but it does suggest additional reason to rethink the notion that targeting is an impediment to effective redistribution.”
Figure 23.3, taken from Marx et al. (2013b), strengthens the finding that the relationship between the extent of targeting and redistributive may have weakened considerably. Here targeting is captured through the concentration index. This is calculated in a similar way as the Gini coefficient. The more negative the concentration coefficient, the more targeted the transfers, whereas the closer the concentration coefficient is to the Gini, the more universal the transfers are distributed. Australia, the United Kingdom, and Denmark have most negative concentration coefficients and can be characterized as strongly propoor. Negative concentration coefficients are found in the majority of the countries, pointing to a substantial degree of targeting. Note however that the term “targeting” suggests that outcomes are due to the characteristics of the system, but this need not be the case. Moreover, the outcomes of a system are highly dependent on the characteristics of the underlying population in terms of sociodemographic characteristics, income inequality, composition of income, and so forth. If, for instance, a benefit is designed in such a way that all children are eligible, but all children are situated in the bottom quintile, then this policy measure may appear as targeted in its outcomes, even though its design may
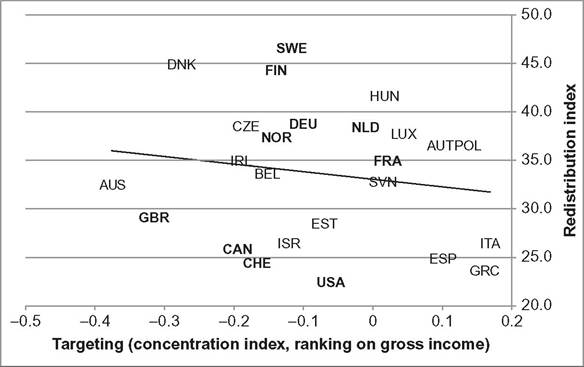
Figure 23.3 Concentration index (ranking by gross income) and redistributive impact, mid-2000s. Notes: (1) for Belgium, France, Greece, Hungary, Slovenia, and Spain calculations are based on disposable incomes instead of gross incomes due to data availability. (2) The countries included in Korpi and Palme (1998) are in bold. Source: Marx et al. (2013a,b) on the basis of the Luxembourg Income Study.
not include any means-testing or needs-based characteristics. This means that strictly speaking we cannot derive from the concentration coefficient how pro-poorness of a transfer comes about.
Redistribution refers to the impact of taxes and transfers on income inequality. It is measured by the difference between the Gini coefficients with and without tax-transfers relative to pre-transfer income; this corresponds in this analysis to the difference of the Gini coefficients of market and disposable income relative to that of market income. The impact on inequality is driven by the size of transfers, as well as by their structure, whether these transfers are going relatively more to lower or higher incomes.
Looking more closely at this graph, at the left-hand side are Australia, the United Kingdom, and Denmark, all characterized by having benefit systems that are the most strongly pro-poor of all countries. Yet, the redistributive impact in Denmark appears to be much stronger. Similarly, looking at the countries with still strong pro-poor spending (concentration indices between —0.2 and 0), the corresponding redistributive impact differs a great deal. Some of the countries with the strongest redistributive tax/transfer systems are to be found here (Sweden and Finland), together with some countries with the weakest (the United States, Canada, Israel, and Switzerland). On the right-hand side of the graph—the countries with positive targeting coefficients—the relationship does become consistently negative, especially in the countries with the weakest pro-poor spending (Greece, Spain, and Italy).
Why does a similar degree of strong targeting, as captured by the concentration index, produce stronger redistributive outcomes in Denmark as compared to the United Kingdom and Australia? Similarly, why do similar (quasi) universal systems yield such different redistributive outcomes across countries? This strongly suggests that design features matter. It is notable that one relationship remains fairly strong: the one between the extent of targeting and the size of the system. However, there are exceptions here: A country like Denmark does combine a strong degree of targeting with a high level of social spending.
The strongest redistributive impact is achieved by countries that combine moderate (Sweden and Finland) to strong targeting (Denmark) with comparatively high levels of spending. This suggests that the most redistributive systems are characterized by what is called “targeting within universalism”—that is, systems in which many people receive benefits but where the poorest get relatively more.
It is interesting to note that the very strong relationship between the extent of targeting and the size of the spending has weakened, as is documented by Kenworthy (2011). One of the factors that arguably made targeted systems less politically robust and prone to spending cuts in the 1980s was the fact that strongly targeted (means-tested) benefits entailed strong work disincentives and also (perceived) family formation incentives. The last decades have seen an intensified attention to this issue. To reduce work disincentives, earnings disregards have been introduced for people who make a (partial) transition from complete benefit dependency to part-time work.
Most importantly perhaps, means-tested benefits are no longer exclusively aimed at people not in work, but also at those in work in low-paying jobs. The French RSA (Revenu de Solidarite Active) scheme is a good example of a new style means-tested benefit scheme that offers integrated support for the nonemployed and (part-time) low-paid workers alike. The scheme also has entirely different work incentives. The RSAwas introduced in France in 2008 with the specific aim of remodeling the incentive structure social assistance beneficiaries, and particularly to make work or returning to education a more lucrative financial prospect. The previous minimum income system (Minimum Integration Income) was based on a one-for-one trade-off of benefit for earned income. Under RSA, a 62% slope is applied. Efforts have also been made to encourage beneficiaries of RSA into employment, for example, with assisted employment contracts and (improved) insertion mechanisms. In addition, the RSA has simplified the provision of social protection by combining several previously separate schemes into a single sum. A household with no earned income is eligible for the “basic RSA,” which is defined at the household level and takes into account the composition ofthe household. The “in-work RSA” acts as a top-up for people paid less than the national minimum wage (SMIC).
The point here is that targeted, means-tested systems look totally different today from the systems in place in the 1980s. Whereas the old systems were the focus of harsh welfare critiques, especially from the right, the new targeted systems are lauded as gateways of welfare to work. They enjoy broad partisan support, as is evident in the United Kingdom where the working tax credit (WTC), implemented by the Labor government, building on a scheme implemented under a Conservative one, is again expanded by the current Conservative one. Similarly, in France, the newly elected socialist government has no intentions for a major overhaul of the RSA, introduced by the Fillon/Sarkozy government.
In the United States, the earned income tax credit (EITC)—a transfer program for households of low earnings—has become the country’s preeminent welfare program (Kenworthy, 2011). The system appears to enjoy far broader and more robust political support than earlier U.S. antipoverty programs. The system also is less strongly targeted than earlier provisions, and it caters to larger sections of the electorate, including the (lower) middle class, which may account for that expansion. However, an equally if not more important factor may well be the fact that the system is perceived to encourage and reward work.
23.2.2 Cash Transfers for the Inactive Working-Age Population
Much comparative poverty research that has sought to link observed variation in income inequality and poverty across countries to policy has relied on government (social) spending statistics as indicators of policy “effort.” As we have seen, the relationship across countries between the level of social spending as a percentage of GDP, or some related indicator, and observed inequality or poverty levels is in fact by and large a rather strong one. This is in a way surprising because the level of spending is as much reflective of the number of people receiving benefits than it is of the level and thus potential adequacy of those benefits. Likewise, measured outcomes, for example, pre- versus post-transfer differences in inequality or poverty also depend on a host of factors that are independent or only indirectly influenced by policy: contextual and compositional factors, including labor market conditions (unemployment, employment patterns, and wages), household composition (patterns of cohabitation, marriage, divorce, childbirth, etc.), and policies that influence these dynamics (e.g., ALMPs and child care).
If we want to understand variations in outcomes we need more sophisticated and accurate measures of policy effort and policy design than spending indicators. So-called institutional indicators aim to be directly reflective of policy intent and design. Replacement rates for various branches of social insurance are commonly applied indicators of social protection. They are intended to express the level of benefit generosity within a particular provision, for example unemployment or disability insurance. The OECD has been compiling such time series for a considerable length of time. Academic databases have been compiled by, among others, the Swedish Institute of Social Research (the SCIP database) and the University of Connecticut (Scruggs database).
While such indicators are more directly reflective than spending-based measures of what actually happens at policy levels, they are not without their drawbacks. One is that replacement rates are generally expressed as a proportion of a reference wage. This is problematic for various reasons. With the growth of part-time and temporary employment, it has become increasingly difficult to specify a consistent wage denominator on the basis of available data. More importantly, wages have generally not evolved in line with the standard of living (and thus the relative poverty threshold). In many countries the standard of living has increased thanks to the proliferation of dual income families rather than through real wage growth. The mere fact that benefits follow wages says little about the potential adequacy of benefits in terms of poverty relief. A second important problem is that replacement rates, for example, within the systems of unemployment insurance or invalidity, do not capture the entitlement criteria applied, nor do they adequately express the entitlement periods. Nonetheless, there are strong indications that these are precisely the areas where policy makers have intervened the most. Unemployment benefit entitlement, for example, is now linked more strongly with job-search intensity. A third important issue is that replacement rates are based on a narrow rationale and tend to be calculated on a purely individual basis. For example, unemployment benefits may be combined with (increased) child benefit and other allowances. Additionally, of course, there may be the income of other household members, including its impact on benefit entitlement and vice versa. Also relevant in this context is the role of taxation. In most instances, the level of income protection that people actually receive in various situations is determined by a complex interaction between social security, social assistance, and taxation.
It is nevertheless interesting and relevant to consider trends. OECD time series on net replacement rates for the unemployed provide strong indications of reduced cash support for the unemployed between 1995 and 2005 (Immervoll and Richardson, 2011). Seven of the 10 countries recorded declining NRRs. Finland and Germany saw the biggest reductions in net replacement rates. Changes for the unemployed in most countries tended to be less damaging (or, sometimes, more beneficial) for families with children. The largest relative income drop was generally faced by long-term unemployed job seekers who mostly rely on unemployment assistance or social assistance for income support.
In the remainder of this section, we will focus in somewhat more detail on institutional indicators of minimum income protection because adequate protection against severe financial poverty is arguably the first duty of the welfare state and also because poverty relief is the prime focus of this chapter. Such a focus is further desirable because the design features of tax and benefits systems, and especially the way various programs interact in specific situations, tend to be so complex that they are not accurately and validly captured in a limited number of parameters. Minimum income protection provisions also mark the ground floor of other income maintenance provisions; minimum social insurance levels and minimum wages are almost always above the level of the social safety net. In that sense, indicators of minimum income protection also tell us something about the generosity of other income maintenance provisions (Marx and Nelson, 2013).
We draw on the CSB minimum income protection indicators (MIPI) dataset. In this dataset net income packages are calculated using the so-called model family approach, where the income package of households in various situations (varying by household composition and income levels) in simulated, taking into account all relevant benefits for which such households are eligible and also taking into account taxes. The MIPI database is among the most comprehensive databases available in terms of geographic and longitudinal scope, as well as in terms of the range of household situations and income components. It is worth pointing out that such institutional indicators have their limits too. They are calculated for a limited number of family types and situations. The assumption is that there is full take-up of benefits and that people effectively and immediately receive what they are entitled to. In the case of minimum wages, the assumption is these are fully enforced. However, this is not always the case and this is one reason why the observed relationship between generosity levels, as reflected in these indicators and outcomes, is relatively weak.
Van Mechelen and Marchal (2013) have analyzed patterns and trends in the level of minimum income protection for able-bodied citizens in the European countries. The chief focus is on means-tested benefits providing minimum income protection, usually in the form of social assistance. These general means-tested benefits provide cash benefits for all or almost all people below a specified minimum income level. In some countries separate schemes exist for such groups as newly arrived migrants or the disabled. The empirical analyses use data from the CSB-MIPI and cover social assistance developments in 25 European countries and three U.S. states. The study shows that the minimum income benefit packages for the able-bodied in Europe have become increasingly inadequate in providing income levels sufficient to raise households above the EU at-risk-of poverty rate, defined as 60% of median equivalent income in each country (Figure 23.4). The overall tendency for the 1990s was one of almost uniform erosion of benefit levels, relative to the development of wages. This downward trend in the relative income position of families in receipt of social assistance changes somewhat in the 2000s, when the erosion of the level of benefit packages came to a halt in a number of countries. In a few countries, there is even evidence of a partial reversal of the declining trend, thus somewhat strengthening the income position of able-bodied persons that are in receipt of social assistance benefits. During the crisis period in particular, a small number of countries took extra steps to increase protection levels (Marchalet al., 2014). Despite a number of positive developments, net incomes of minimum income recipients continue to fall well short of the EU's at-risk-of-poverty threshold in all but a few EU countries. The size of the gap between the level of the social safety net and the poverty threshold varies across countries and family types, but it is generally quite substantial.
While the erosion of minimum income protection levels seems to have slowed, the fact remains that Europe’s final safety nets offer inadequate protection in all but a handful of countries. This begs the question: Why are social safety nets not more adequate? Let
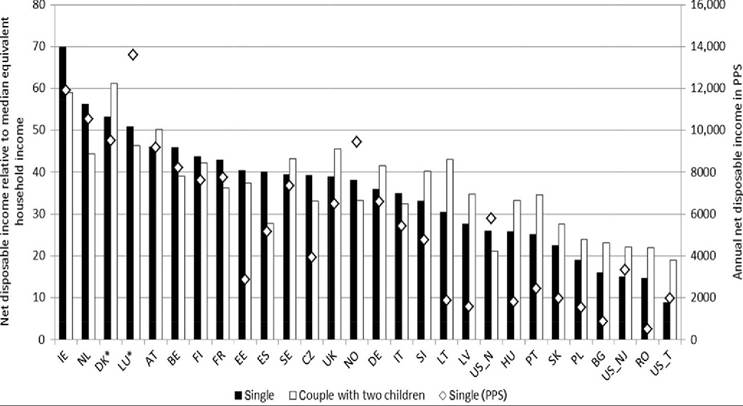
Figure 23.4 The level of the social safety net in the EU and three U.S. states, 2012. Notes: In some countries, such as the United States, Italy, and Bulgaria, time limits apply, either formal or discretionary. In order to avoid additional assumptions, the levels displayed do not take these time limits into account. Source: CSB-MIPI (Eurostat; US Bureau of the Census and Bureau of Labor Statistics; Van Mechelen et al., 2011).
us briefly consider two potential impediments: first, “adequate social safety nets are not affordable” and second, “adequate social safety nets undermine the work ethic and people’s willingness to work.”
Are adequate social safety nets too costly? Final safety net provisions (social assistance schemes) generally constitute only a fraction of total social transfer spending (typically well below 2.5% of GDP in Europe, except in Ireland and the UK), with the bulk of outlays going to pensions, unemployment and disability insurance, child benefits, and other benefits. Vandenbroucke et al. (2013) have made tentative calculations showing that the redistributive effort required to lift all equivalent household incomes to the 60% level would be below 2.5% of aggregate household income in most European countries and nowhere higher than 3.5%. The countries that would have to make such a relatively great effort are all southern and eastern member states. Vandenbroucke et al. (2013) also show that it is not the case that being poor in GDP per capita always implies a great redistributive effort to close the poverty gap. The Czech Republic and Hungary are relatively poor in terms of GDP per capita, but closing the poverty gap would require relatively little effort. On the other hand, Denmark and the United Kingdom have much higher living standards, yet they would have to make a relatively sizeable effort to close the poverty gap. Such a mechanical calculation ignores incentive effects and behavioral change (more poor people may prefer social assistance to low-paying jobs; the nonpoor may reduce their work effort). The real cost of such an operation is probably higher than the mechanical effect and the calculation may be seen as indicating a lower boundary for the distributive effort that is required. Still, the calculation also illustrates that the cost of an adequate social safety net is not necessarily outside of the realm of the conceivable.
Are adequate social safety nets compatible with work incentives? Despite widespread and sometimes strongly worded concerns over the potential work disincentive effects of social safety nets, empirical studies tell a more nuanced story (Immervoll, 2012). The income gap between situation of full-time dependence on minimum income benefits and a full-time job at the minimum wage (or the lowest prevailing wage) is in fact quite substantial in most European countries, especially for single persons. In some countries and under certain circumstances, particular groups such as single parents with young children gain relatively little from moving into a low-paid job, especially when child care costs are accounted for. Partial transitions into work—moving to a small part-time job—also do not pay in certain circumstances. But generally speaking it is hard to argue that long-term dependence on social assistance benefits is an attractive financial proposition in most of Europe. The hypothetical Europe-wide introduction of social assistance minimums equal to 60% of median income would, however, create a financial inactivity trap in many countries, as is also brought out in the paper by Vandenbroucke et al. (2013). In countries such as Bulgaria, Estonia, Slovenia, and Lithuania, the net income of a single benefit recipient would be between 25% and 30% higher than the equivalent income of a single person working at minimum wage; in Spain and the Czech Republic, the relative advantage of the benefit claimant would amount to around 15%. This implies that if such countries would wish to move toward better final safety net provisions then minimum income floors would have to be raised at least in step.
This would require quite substantial increases in minimum wages. In 2013, 20 member states of the EU had a national minimum wage set by government, often in cooperation with or on the advice of the social partners, or by the social partners themselves in a national agreement. As is illustrated in Figure 23.5, presenting figures for 2010, only for single persons and only in a number of countries do net income packages at minimum wage level (taking into account taxes and individual social security contributions, but also social benefits) reach or exceed the EU's at-risk-of-poverty threshold, as in all graphs set at 60% of median equivalent household income in each country. For single parents and sole breadwinners with a partner and children to support, net income packages at minimum wage are below this threshold almost everywhere, usually by a wide margin. This is the case despite shifts over the past decade toward tax relief and additional income support provisions for low-paid workers (Marx et al., 2013a).
When it comes to the question of whether and to what level minimum wages and hence minimum income benefits in general could be increased, opinions clearly diverge. Concerns about the work disincentive effects of social safety nets are legitimate, as are
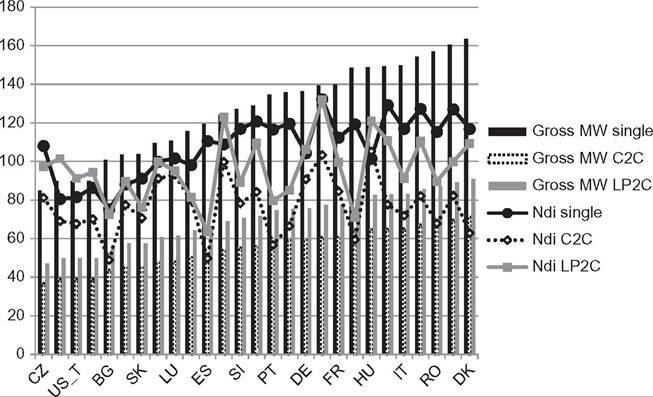
Figure 23.5 Gross minimum wages and net incomes at minimum wage as a percentage ofthe relative poverty threshold, 2012, selected EU-member states plus the United States (New Jersey). Source: CSB- MIPI (Eurostat, 2011; US Census Bureau, 2003; Van Mechelen et al., 2011).
concerns over potential negative employment effects of minimum wages, especially if these were to be set at levels high enough to keep households solely reliant on that wage out of poverty. The fact remains, however, that countries such as Denmark or the Netherlands combine what are comparatively among the highest levels of minimum protection for workers and nonworkers alike with labor market outcomes that on various dimensions are also among the best in the industrialized world. The Netherlands and Denmark enjoy among the highest employment rates in Europe and the lowest (long-term) unemployment rates.
Elaborate active labor market policies, specifically activation efforts directed at social assistance recipients, coupled with intensive monitoring and noncompliance sanctioning, appear to play a key role here. But it appears that the strength of overall labor demand is a key contextual factor for such associated policies and practices to effectively result in low levels of long-term dependence. Moreover, in terms of quality of employment, Denmark and the Netherlands are clearly among the best performers in Europe with relatively few workers in low-quality jobs (European Commission, 2008). Replicating the activation, empowerment, and sanctioning aspects associated with comparatively generous systems may well be difficult enough in itself. Replicating a context where job growth is strong and where jobs are sufficiently rewarding and attractive may be even more difficult.
Relatively elevated social safety nets and other income protection systems can be compatible with well-functioning labor markets. In fact, such systems may actually be conducive to well-functioning labor markets. Flexicurity proponents identify adequate social security benefits as an essential flexicurity pillar in that adequate benefits stimulate and accommodate labor market transitions and reduce risk aversion among workers (Bekker and Wilthagen, 2008).
23.2.3 Child Poverty and Child Cash Transfers
Children are generally at a higher risk of poverty than the population as a whole (Atkinson and Marlier, 2010). In addition, child poverty trends have, for the most part, not been favorable over the past decade (see also Chapter 8 in this book). The latest 2010 EU-SILC data shows that between 2005 and 2010 the at-risk-of-child-poverty rate increased in 17 out of 29 countries (EU27 plus Iceland and Norway). Child poverty rates rose in all the Nordic countries, Germany, and France. In most countries where child poverty fell this was in part the result of a fall in the 60% of median income threshold due the recession (Czech Republic, Estonia, Ireland, Lithuania, Poland, and Portugal). Poverty gaps (the gap between net income and the poverty threshold) for children have also risen between 2005 and 2010 in 15 out of the 29 countries. This deteriorating situation is of course the result of rising unemployment. However, in 2010, the majority of countries in the EU have more than 20% of poor children living in households with all working-age members in employment (work intensity of 1) and all but Belgium, Bulgaria, Czech Republic, Finland, Hungary, Ireland, and the UK have more than half of their poor children living in households with a work intensity of 0.5 or more (Van Mechelen and Bradshaw, 2013).
There are a number of reasons why children are living in poverty when their parents are employed. One explanation is that parental earnings are too low either because they are working part time and/or full-time but their wage is low. The second explanation is that families may be taxed into poverty. The direct taxes taken in income tax and social insurance contributions reduce gross incomes so much that they fall below the poverty threshold. The third explanation is that the cash benefits paid by the state to help parents with the costs of raising children are inadequate. Finally, the reason why a child with a working parent may be poor is that after having paid for housing and other charges the resources available for consumption are too little.
Countries use different mixes of tax benefits and cash benefits for delivering help to families with children. One can distinguish between income-related and universal— that is, non-income-related—cash benefits. Income-related benefits aim to target direct cash transfers to low-income families. Governments may decide to target benefits to other specific groups, for example, single parents or disabled children. Tax instruments are also used to redistribute income from childless families to families with dependent children—either in the form of tax allowances or tax credits specifically aimed at families with children. Tax allowances are deducted from taxable income whereas tax credits are subtracted from the amount of tax due. Tax credits may be wasteable or nonwasteable. Nonwasteable or refundable tax credits are tax benefits that can be paid as cash transfer to the taxpayer whenever the benefit exceeds tax liability. Wasteable tax credits can only be used if tax liability is positive. Both cash and tax benefits tend to vary by the age and the number of children (Bradshaw and Finch, 2002; Van Lancker and Ghysels, 2012).
Child benefit packages, as a whole, play an important role in preventing financial poverty. Nevertheless, in many countries child benefit packages fail to protect low-wage earners against poverty. In all countries the incomes of single-earner couples on minimum wages is below the poverty line. The child benefit package for a lone parent is more generous in most countries. However, how and whether child care costs are subsidized makes a big difference to the package, especially for lone parents. The costs of child care can undermine the value of the package in some countries. Whereas during the 1990s child benefit packages have been able to escape welfare erosion, over the past decade the value of the package relative to median equivalized income has fallen in more countries than it has increased (Van Mechelen and Bradshaw, 2013). This trend of decreasing child benefits has affected both low-paid families and the better-off.
Various studies have looked in detail at the structure of the child benefit package (e.g., Bradshaw, 2010; Bradshaw and Finch, 2002; Corak et al., 2005; Matsaganis et al., 2005; Van Lancker and Ghysels, 2012) and have documented the adequacy of child support arrangements in terms of poverty alleviation using empirical income surveys. Corak et al. (2005) find that universal child-related benefits that also have some degree of targeting at the poorest protect best against poverty. Their conclusion that targeting within universalism yields the best outcomes is echoed by Van Mechelen and Marchal (2013). They find that cross-country variation in the level of child-benefit packages for single-earner families on low pay largely overlaps with the degree of low- income targeting. Model family-type simulations suggest that comparatively generous packages for low-paid workers are to be found in countries where financial help for families with children is well targeted at low-income households by means of income-related cash benefits, refundable income-related tax credits, or social assistance top-ups. However, model family-type simulations effectively assume full take-up of benefits and full granting of rights. In reality, selective benefit systems may be quite ineffective with regard to poverty alleviation due to take-up problems and labor market disincentives (Deacon and Bradshaw, 1983; Gassmann and Notten, 2008). Van Mechelen and Bradshaw (2013) also show that child benefit packages are often also above average in countries with universal cash benefits but are combined with income-related cash benefits, housing allowances, or supplementary benefits from social assistance (Ireland, France, Austria, and Finland). This finding may in effect confirm and reinforce the assertion in empirical literature that targeting may be not so bad, if embedded in a universal social insurance context (Kenworthy, 2011; Skocpol, 1991; Van Lancker and Ghysels, 2012; Whiteford, 2008).
23.2.4 The Working Poor and Combating In-Work Poverty
The issue of in-work poverty has received increased attention recently (Andreβ and Lohmann, 2008; Crettaz, 2011; Fraser et al., 2011; Lohmann, 2009; Maitre et al., 2012; Marx and Nolan, 2013; OECD, 2008). It is usually linked to the growth of low-paid insecure employment in the service sector. The contrast is often drawn with the golden years of welfare capitalism when the manufacturing industry provided stable, well-paid employment even for those with little or no formal education. As EspingAndersen et al. (2002) put it: “We no longer live in a world in which low-skilled workers can support the entire family. The basic requisite for a good life is increasingly strong cognitive skills and professional qualifications... Employment remains as always the sine qua non for good life chances, but the requirements for access to quality jobs are rising and are likely to continue to do so.” By the same token, Bonoli (2007, p. 496) states, “Postindustrial labour markets are characterized by higher wage inequality with the result that for those at the bottom end of the wage distribution, access to employment is not a guarantee of a poverty-free existence.”
At the same time that good jobs for the less skilled are becoming scarcer, an increased policy emphasis on activation has become evident in many European countries, certainly at the level of rhetoric, and gauging by some indicators also in terms of actual policy (Barbier and Ludwig-Mayerhofer, 2004; Digeldey, 2007; Eichhorst et al., 2008; Kenworthy, 2008; OECD, 2007a,b). Within the broad set of activation strategies deployed, an important number specifically target the long-term unemployed, including social assistance recipients. And within this set, an important number of measures are aimed at stimulating these people, who generally have low levels of educational attainment, into relatively low-paid/minimum-wage level jobs.
So has in-work poverty become more prevalent? The literature on the working poor employs a variety of definitions based on different approaches of what is meant by “poor” and by “working” (for an overview see Crettaz, 2011; Nolan and Marx, 2000). The working poor are conventionally defined and measured as those individuals who have been mainly working during the reference year (either in employment or selfemployment) and whose household equivalized disposable income is below 60% of the median in the country in question. It is widely recognized that analysis of in-work poverty needs to distinguish between employees and the self-employed, both because of their differing nature and because survey information on self-employment income is normally less reliable than wages and salaries, and also between full-time and part-time workers, which is another important distinction. In fact, with the growth of part-time work, zero-hour contracts, internships, and so forth, “being employed” has become a very fuzzy heterogeneous concept indeed. Moreover, combining two levels of analysis— the individual’s labor market status and the household’s income (adjusted for household size)—inherently complicates interpretation, because the labor market status of other persons in the household, rather than that of the individual being considered, may be crucial, as may the number of dependent children if any. Using a year as the reference period for labor market status and income position also complicates interpretation. Those working for part but not all of the year may be in poverty on an annual basis for that reason even if they were not poor while working, and how much of the year does one have to work to be counted as “working”? For these and other reasons, this defini- tion/measure makes it difficult to identify the different factors potentially underlying the phenomenon and thus the locus or loci of policy failure, which could include: low (household) work intensity; inadequate out-of-work benefits; inadequate earnings; inadequate earnings supplements, the number of dependent people (children) relative to income, and so on.
Data from the EU-SILC database clearly shows that in-work poverty is a Europewide phenomenon. The prevalence of in-work poverty varies across EU countries; the extent of in-work poverty ranges from a low of 4—5% in Austria, Belgium, the Czech Republic, Finland, the Netherlands, and Slovenia up to 13-14% in Greece and Spain and 17% in Romania. On the basis of Eurostat figures, which combine data from ECHP and SILC, we can seek no general tendency for in-work poverty to have risen since the start of the century. Taking the time span from 2000 to 2010, in-work poverty is seen to have increased over the decade in countries such as Denmark, Germany, Spain, Luxembourg, Romania, and Sweden, but fell in as many countries. Abstracting altogether from the crisis period, a comparison of 2000 with 2006 also fails to show a marked rise in in-work poverty in many countries. The common presumption of a rising trend is therefore not supported by this data and indicator. However, the fact that the sources of data for 2000, unlike the later years, are not EU-SILC means that the trends shown have to be treated with some caution.
It is useful to relate these figures and trends to analysis by the OECD, providing a point of comparison and covering the decade from the mid-1990s to the mid-2000s (see OECD, 2009). Drawing on a variety of sources but seeking to apply a uniform methodology, the OECD found in-work poverty to have increased substantially in EU countries such as Germany, the Netherlands, and Luxembourg over this decade, but declined substantially in some other countries such as Italy. The OECD figures also draw on different data sources and employ a different definition—namely, in-work poverty being measured as households below 50% (rather than 60%) of median poverty threshold (with a different equivalence scale), and with “working” being captured at household rather than individual level by the presence of at least one person in work in the household. The study by Airio (2008) of the period 1970-2000 covering six OECD countries (and mostly based on data from the LIS) concludes that it is difficult to find any common trend on in-work poverty. These differences illustrate the care that must be exercised in drawing strong conclusions about levels and trends in in-work poverty across countries, because definitions, data, and period covered can all affect the outcome.
Which policy action, or set of policy actions, is most appropriate cannot be seen as entirely independent from normative notions that underlie the various ways the causes of working-age poverty in relation to work can be construed. Take for example a dual adult household with only one working adult and three dependent children. The male breadwinner has a low-paid job, yet is paid well above the minimum wage. Child benefits are limited. Whether their at-risk-of-financial-poverty status is construed as a problem of insufficient breadwinner earnings, or as a problem of partner nonparticipation, or as a problem of insufficient child support makes a fundamental difference as to what type ofpolicy action is to be examined and possibly favored. In the case of traditional breadwinner-type households with insufficient earnings, the preponderance of opinion in Europe appears to be that this is to be seen as a matter of partner nonparticipation or underparticipation. But other cases may be less clear-cut. Even if in-work poverty is construed as largely a problem of low-household work intensity, the question arises what can be deemed as sufficient level of work intensity. It is not self-evident that this is to equal all working age, work-capable adults in the household to be in full-time work the whole year round. Societal norms may differ across countries. In the Netherlands, for example, a four-fifths job per adult appears to be closer to the norm of full-work intensity. Also, household composition may be deemed to matter. It is not self-evident that a lone parent with young children is expected to work full-year, full-time before additional income support is to be considered legitimate if his or her earnings fall short of the poverty threshold.
Poverty is, to a large extent, far from exclusively associated with low-work intensity at the household level (see Corluy and Vandenbroucke, 2013; De Graaf-Zijl and Nolan, 2011). This brings into view a wide variety of potential policies that can help households to increase if not maximize their work intensity. These include policies aimed at boosting the demand for workers, and particularly the demand for people with low levels of education or weak work experience. Employer subsidies or reductions in employers’ social security contributions are an example here. At the supply side, policy can stimulate (e.g., through fiscal reform) or support (e.g., through child care) people to take-up work or to increase working hours. What mix of policies will work best in a given context will depend on the composition of the low-work-intensity population and on the underlying causes of low-work intensity.
Yet, and this is crucial, it must be recognized that even if such policies succeeded in getting every single nonemployed person into work, or every household to a level of fullwork intensity for that matter (and all empirical evidence to date suggests this to be highly unlikely), this would not guarantee the elimination of poverty. What policy can do to help households in these circumstances is again likely to depend on such factors as the institutional and policy context in place, labor market conditions, and the profile of the population in need of support.
In some EU countries, and certainly outside ofthe EU, minimum wages remain nonexistent or low relative to average wages, but in a range of others they do suffice to keep single persons reliant on them out ofpoverty. Thus, it would appear sensible for countries with nonexistent or very low minimum wages to contemplate introducing or increasing these. However, the route of introducing or boosting minimum wages to the upper ranges currently prevailing in Europe (relative to average earnings) would, even in the absence of negative employment effects, not be sufficient to eradicate in-work poverty. Even in countries where minimum wages are comparatively high they do not suffice to keep sole-breadwinner households out of poverty, especially when there are dependent others or children. Minimum wages have probably become inherently constrained in providing minimum income protection to sole-breadwinner households, especially in countries where relative poverty thresholds have become essentially determined by dual earner living standards.
For low-earnings households, only direct household income supplements may offer a reasonable prospect to a poverty-free existence, especially when there are dependent children. Such “in-work benefits” are now often associated with Anglo-Saxon-type “tax credits” such as the EITC in the United States and the WTC in the United Kingdom. It is increasingly argued that more effective redistribution will not come from augmenting/expanding the traditional channels of income support, for example, more generous social insurance or social assistance levels, or from higher minimum wages. These are seen not only as failing to address today’s social risks and needs, but also as exacerbating underlying problems such as exclusion from the labor market and entrapment in passive benefit dependency. Worse, these are considered as standing in the way of innovative mechanisms of social protection that are proactive and self-sufficiency enhancing, such as active labor market policies and services such as child care and improved education and training.
The options to consider, then, are other forms of (targeted) income supplements for households that provide some level of income protection and that are also conducive to labor market participation. As Kenworthy (2011) puts it, “Given the importance of employment and working hours for the market incomes of low-end households, policy makers must guard against programs that provide attractive benefits without encouraging or requiring employment. An ideal transfer would be one that both boosts the incomes of low-earning households and promotes employment by able working-aged adults. As it happens such a program exists. Referred to variously as ‘in-work benefit’ or ‘employment-conditional earnings subsidy’, it is best exemplified by the Working Tax Credit (WTC) in the United Kingdom and the Earned Income Credit (EITC) in the United States” (p. 44).
Under these schemes households with low earnings do not pay taxes but instead they receive additional money through the tax system. In the United States, the 1993 expansion of the EITC created the country’s preeminent antipoverty program for families of working age. The United Kingdom has also implemented and extended several schemes (and in fact did so earlier than the United States), culminating in the Universal Credit.
Clearly, Anglo-Saxon-Style negative income taxes have been garnering increased interest of late. As Immervoll and Pearson (2009) note, “Even in the mid-1990s, twenty years after such schemes were first introduced in the United Kingdom and the United States, such schemes were seen as interesting but unusual [...] it seems reasonable to conclude that IWB schemes are now mainstream policies in many countries.”
That is perhaps somewhat of an overstatement. Several European countries have contemplated introducing Anglo-Saxon-style tax credits, or have done so in some form. Examples here include the “Prime Pour l’Emploi” (PPE) and the Revenue de Solidarite Active (rSa) in France, the “Combination Credit” in the Netherlands, and a “Low Wage Tax Credit” in Belgium. Yet, the reality is that most of these schemes exhibit only a faint resemblance to the EITC or the WTC. Sweden has a scheme that goes by the same name in English as its U.S. counterpart, EITC. It was introduced in 2007, and was reinforced in 2008, 2009, and 2010. The stated motive for the reform was to boost employment; in particular, to provide incentives for individuals to go from unemployment to, at least, part-time work. The scheme is different from the U.S. scheme in that it is a nonrefund- able tax credit. Also, because the tax unit in Sweden is the individual and not the household it works in effect as a tax relief on low individual earnings. In that respect it is similar to personal social security contributions relief measures elsewhere.
While tax-channeled in-work benefits targeted at households with low-earnings remain of limited significance in most European countries, it is of course the case that many countries have child benefit systems that provide an additional income to workers and their families (Van Mechelen and Bradshaw, 2013). Child benefits have generally lost ground. For a couple with two children, the size of the child benefits package, expressed as a percentage ofthe gross minimum wage, declined in the majority of countries awarding these benefits. For single parents with two children the trend was somewhat more favorable in a number of countries. The decline of child cash benefits, both in value as in their importance in net disposable income, is discussed more extensively in Van Mechelen and Bradshaw (2013). Interest in EITC type schemes remains strong, however, in the public debate and in the academic literature (Aaberge and Flood, 2013; Allegre andJaehrling, 2011; Crettaz, 2011; Kenworthy, 2011; Marx et al., 2012a). This interest seems entirely legitimate. The empirical evidence shows the U.S. EITC, in combination with other policy reforms and several increases in the minimum wage, to have produced some significant results, including marked increases in labor market participation and declines in poverty among some segments of the population, especially singleparent households (Eissa and Hoynes, 2004; Hotz and Scholz, 2003). It needs to be noted, however, that these initial results occurred in favorable economic circumstances, including strong labor demand and low unemployment. The relatively strong increases in labor supply of single mothers in the U.S. setting also resulted from welfare reform—notably, the transformation of the social assistance scheme into a temporary support system with time limits on the duration of benefits. This clearly provided a strong push incentive, with the EITC acting as pull incentive. Not all who were forced out of passive dependence found their way to work (Grogger, 2003, 2004). In addition, as the survey by Holt (2011) reveals, there is considerable evidence of incomplete take-up (around 75% according to some estimates), although exact estimates are hampered by the fact that there is no systematic tracking.
There are potential downsides to subsidizing low-paid work. While EITC is intended to encourage work, EITC-induced increases in labor supply may drive wages down, shifting the intended transfer toward employers. Rothstein (2010) simulates the economic incidence of the EITC under a range of supply and demand elasticities and finds that in all scenarios a substantial portion of the intended transfer to low-income single mothers is captured by employers through reduced wages. The transfer to employers is borne in part by low-skill workers who are not themselves eligible for the EITC. There is some empirical evidence that corroborates the potential wage erosion effect of EITC (Chetty et al., 2013; Leigh, 2010).
Yet, whether EITC type schemes can work elsewhere, as Kenworthy (2011) and others suggest, is not self-evident. The sociodemographic make-up of the United States differs from that in most European countries; there are more single adult (and parent) households and also more multi-earner households. The dispersion in earnings is also much more compressed in most European countries, where, in addition, benefits are generally higher relative to wages (including minimum wages) and less subject to means-testing if they derive from social insurance. This also implies that benefit entitlements of household members are less interdependent, possibly weakening the potential impact on labor supply. Many countries have individual taxation, and the trend is moving away from joint taxation of couples.
In order to be effective as an antipoverty device and at the same time affordable within reasonable limits, such measures need to be strongly targeted. However, strong targeting at households with low earnings is bound to create mobility traps, which can only be avoided if taper-off rates are sufficiently flat. That comes at a very considerable cost if the lower end of the household earnings distribution is densely populated, as is the case in many European countries. This cost can only be avoided by making the amount of the tax credit itself smaller, but in that case the antipoverty effect is reduced. Simulations by Bargain and Orsini (2007) for Germany, France, and Finland, by Figari (2011) for four southern European countries (Italy, Spain, Portugal, and Greece) and by Marx et al. (2012a) for Belgium, shed doubt over the applicability of EITC type systems in other settings. In an earlier study, Bargain and Orsini (2007) investigated the effects on poverty of the hypothetical introduction of the British scheme (as it was in place in 1998) in Germany, France, and Finland, using EUROMOD for 2001. They found that the antipoverty effects of a U.K.-type tax credit (similar in design and relative overall spending) would be very small in these countries, especially relative to the budgetary cost. For Belgium, the hypothetical introduction of the United Kingdom’s WTC is shown to yield a limited reduction in poverty at the cost of possible weakened work incentives for second earners (Marx et al., 2012a). Figari (2011) notes that the presence of extended families in southern Europe does not allow for such policies to be well targeted at the very poorest. Bargain and Orsini (2006) have concluded that “interest in such schemes is destined to fade away.” Whether this is true remains uncertain and indeed doubtful, but EITC type negative tax credits are not obviously suitable for wholesale emulation throughout continental Europe. In Germany, for example, the labor market has undergone some profound changes over the past decade. Low-paid employment has become far more prevalent and in-work poverty seems to have increased. It is not unlikely that a simulation such as the one performed by Bargain and Orsini on 2001 data would yield different results today. A recent study by Giannelli et al. (2013) analyzes the quality of new jobs created in Germany between 1998 and 2010 and find that the reforms of the 2000s (Hartz reforms) reinforced an existing trend of increasing wage inequality and lower wages among the least advantaged individuals. Although, as found by Card et al. (2013), a great deal of the increase of wage inequality in Germany for the period 1985—2009 is due to the increasing heterogeneity in job premiums and the raise of assortativeness in the matching between workers and establishments.
Clearly, simulations demonstrate that in-work benefit schemes that work well in certain settings do not necessarily perform equally well in a different context. Family composition, individual earnings distributions, and family income structures drive outcomes in a very substantial way. It remains to be explored whether alternative designs are conceivable that have better outcomes in continental European settings and that are realistically affordable.
23.2.5 Pensions
The terminology “pillars” is widely employed (Holzmann and Hinz, 2005) to capture the different elements of pension systems, as they operate within, for example, Bismarckian or Beveridgean welfare states. Bovenberg and Van Ewijk (2011) offer a typology of four models of pension systems based on the dimensions of governance (private vs. public) and individual choice (mandatory vs. voluntary), which are related to the classification of welfare states by Esping-Andersen (1990). As pension systems in rich economies have, simultaneously or not, characteristics of social insurance and poverty prevention, and different forms to finance benefits, a more flexible taxonomy of pension systems is used by the OECD (see Figure 23.6).
There are three main visible tiers forming the retirement-income system. The first one is intended to prevent old-age poverty and is publicly financed. Within this tier there are basic benefits paid at a flat rate, resources-tested (means and assets) benefits, and minimum pensions. The second tier is composed by mandatory schemes that can be public or
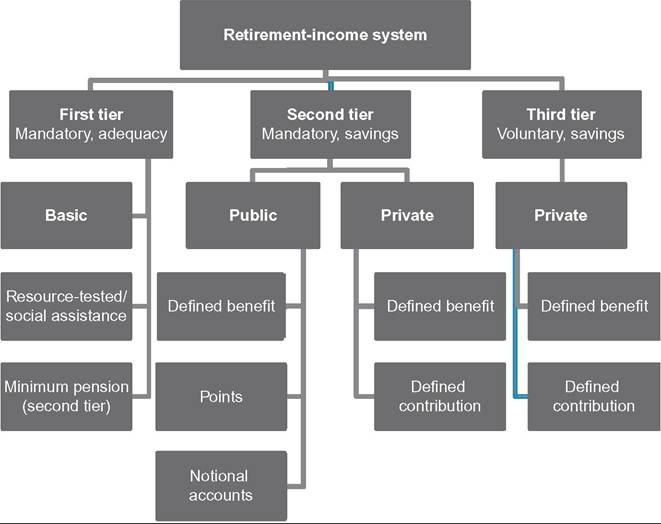
Figure 23.6 Taxonomy of different types of retirement-income systems. Source: OECD (2011b).
private. The public schemes offer defined benefits (DB) where the pension entitled is a function of individual Contributedyears and income. A system of points earned with each year income and accrued up to retirement age is also possible (e.g., occupational plans in France). A third plan under the public provision of the second tier is the Notional Defined Contributions, which is used in Italy, Norway, Poland, and Sweden. Under this plan, the individual contributions are recorded by the pension institution and offered a return rate. Once the retirement age is reached, such contributions are converted into pensions through an actuarial formula. The second tier also includes compulsory private (occupational) managed pensions, which can be DB or defined contribution (DC) types. Finally, the third tier is composed by voluntary private plans.
The composition of each plan within and between countries varies to a great extent. From 34 OECD countries, 14 have mandatory private schemes, 12 have public resources-tested benefits, 13 have basic flat rate benefits, and 18 have minimum pensions. Furthermore, DB pensions are present in 20 countries while DC pensions exist in 11 economies. For more details about the composition of pension plans by county, see section II.1 of OECD (2011a).
The adequacy of pension benefits is broadly measured by the replacement rate— namely, the ratio between pensions and average wages. Figure 23.7 reports the net
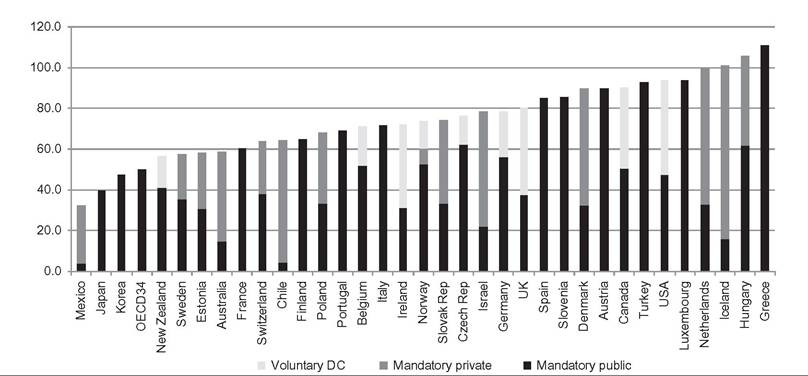
Figure 23.7 Net pension replacement rates by pension schemes in OECD countries. Source: OECD (2011b). Authors' elaboration.
pension replacement ratios in OECD countries with data from late 2000s. On average, the replacement rate is 50% in mandatory public plans while it is 43% in mandatory private plans, and 28% in voluntary plans. Overall, the mandatory systems show a replacement rate of 68%, which rises to 77% when voluntary plans are added. Furthermore, one can observe that adequacy differs significantly among countries and pension schemes. For example, in Japan, Korea, and Mexico the overall net replacement rate is lower than 50% while in 13 of 34 countries this figure is above 80%. All of the replacement ratio figures are lower when gross income and pensions are considered because income taxation burden for retirees is milder than for the working population. The mandatory systems have a gross replacement ratio of 57% and this reaches 64% when voluntary plans are included.
Typically, individuals at the beginning and the end of the life cycle face higher poverty rates. This U-shaped relationship by age groups has been maintained during the last decades, but the poverty rates have shifted impressively in favor of the elderly and in detriment of children and the young. Figure 23.8 from the OECD’s Unequal Growing? shows clearly the sharp reduction of poverty risk for old-age individuals between the 1970s and the 2000s in OECD countries. Moreover, women report more poverty rates than men. The poverty gap by gender significantly increases for older ages. As explained in OECD (2008), Smeeding and Sandstrom (2005), and Vignoli and De Santis (2010), the risk of living in poverty is higher for elderly women because they have gained less pension rights during their working life, and they are more likely to live alone after the death of their spouses. In this regard, studies from Burtless (2009) and Vignoli and De Santis (2010) alert on the trends of new living arrangements (shrinking of the household size of the elderly) that jeopardize the living conditions of the elderly and increase the risk of falling into poverty. As a feedback mechanism, the larger participation of the elderly in pensions
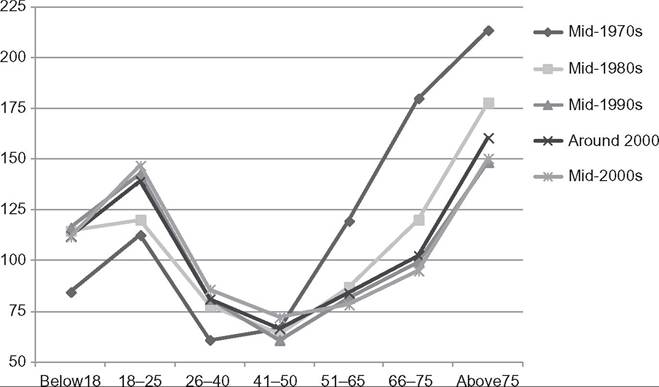
Figure 23.8 Risk of relative poverty by age of individuals in OECD-7 countries (poverty rate of the entire population in each year = 100). Notes: Relative poverty risk is the age-specific poverty rate divided by the poverty rate for the entire population times 100. The poverty threshold is set at 50% of median income of the entire population. OECD-7 is the average for Canada, Finland, Greece, the Netherlands, Sweden, the United Kingdom, and the United States. Source: OECD (2008).
and transfers will allow them to live alone without the need of other relatives, increasing in this way the risk of poverty. McGarry and Davenport (1998) are also aware of the effects of survivorship benefits for pensions on the poverty rates of U.S. widows given the scarcity of pension wealth of women.
The role of pensions in reducing poverty is particularly important due to the large share of old-age income coming from social security. On average, public transfers (earnings- related pensions, resource-tested benefits, etc.) to people over 65 during the mid-2000s represent 60% of their incomes. In some countries this figure reaches 80% or more (France, Hungary, Slovak Republic, and Belgium). The rest of the sources are divided in-work income (21%) and capital income (19%). The shares of incomes from work are large in Japan, Turkey, Mexico, and Korea where those represent about 50%. The average share of capital income for the elderly in Netherlands, United Kingdom, Switzerland, Canada, Australia, Denmark, and the United States is about 41%. Note that occupational plans are included in capital income sources, so that this component includes pension incomes. All these figures by country can be consulted in OECD (2011a). It is also observed that the reduction of market income poverty attained with transfers and taxes is greater for old-age people than for working-age people (OECD, 2008).
A number of recent studies have sought to measure the contribution of pensions in reducing old-age poverty across countries. Smeeding and Williamson (2001) use LIS data to estimate the effect of public pensions on poverty rates ofthe elderly in eight developed economies for mid-1990s: Australia, Canada, France, Germany, the Netherlands, Sweden, the United Kingdom, and the United States. The poverty rate for old-age people would be 84% in average if only market income is considered. This is reduced to 71.8% when occupational pensions are added, and then this falls to 21.2% when universal and social incomes are included. With social safety net transfers, the average poverty rate drops up to 13.2%. Different from the English-speaking countries, the greatest redistributive effects are found in France, Germany, the Netherlands, and Sweden. Similar trends are found when Smeeding and Sandstrom (2005) analyze data for the early 2000s. In both works, it is found that pensions are more effective to reduce poverty of old-age males than in old-age females. With early 2000s data, pensions, income social transfers, and safety net transfers reduce poverty of elderly women up to 24.3% while that figure is reduced up to 13.3% for both sexes. As women participate to less extent in the pension system, the safety net transfers are more important for them to reduce their risk of poverty, and the contrary holds for occupational pensions in the case of men. In a similar exercise by Lefebvre (2007), it is found that poverty alleviation due to pensions is less effective for the very old (75+) than for the old (65-74). This feature combined with gender depicts a very negative picture for very old women, who in turn, represent the majority of members in the oldest old cohort. Moreover, micro-simulation models like the one implemented by Dang et al. (2006) arrive at similar conclusions. Chapter 24 of this book shows other relevant micro-simulation models.
There is concern about the sustainability of public pension expenditures due to the accelerated aging process in developed economies; and, in particular, there is a legitimate worry about the effects of the reforms aiming to attenuate it on old-age poverty and inequality (Arza and Kohli, 2008; Borsch-Supan, 2012; Burtless, 2006). Although, as indicated in the reports by Zaidi et al. (2006a,b) the pension reforms promoted by the World Bank were mainly driven by financial sustainability issues, and little concern was put on the effects on the living standards of the retirees. These reports offer an important effort to estimate the long-term effects of a variety of pension reforms in EU countries—undertaken between the 1990s and the 2000s—on the poverty and living standards of the elderly. In Zaidi et al. (2006b), the authors find a strong negative relationship between the generosity of public pensions and the at-risk-of-poverty rates among the 65 and older, and they foresee a decline of the pension generosity (for years 2025 and 2050) on the basis of the analysis of each pension reform. These two combined findings will result in an increase of the poverty rate for the vast majority of countries analyzed (Estonia, Malta, Austria, Italy, Belgium, Denmark, Spain, France, Latvia, Lithuania, Portugal, Slovenia, Finland, and Sweden). Only Ireland and Cyprus appear to have a reduction of the 65 and older poverty rates. However, as warned by the authors, these results have to be taken with caution as no behavioral responses are considered.
In a more static framework, Van Vliet et al. (2012) estimate the effects of pension reform on poverty and inequality in European countries. They acknowledge that recent shifts from public to private provision in pensions are still limited in Europe but that this is important for some countries. They estimate the effects of those changes on old-age inequality and poverty with OLS panel data regressions, but they do not find substantial effects on those variables. Nonetheless, they cast the limitation of their analysis by indicating that the reforms may be affecting only to new and future retirees.
Looking at the effects of public transfers and taxes in a more general way, some authors appeal for a rebalance of the spending from pension programs toward programs aimed to prime-age people and their children at the bottom of the income scale, which could reduce poverty rates to a greater extent (OECD, 2008). As pointed out by Dang et al. (2006), social protection systems are very old-age oriented in the EU with the elderly receiving much more cash transfers than the working population. They show that even high old-age spending countries can leave significant pockets of elderly in poverty while others with lower expenditures in old-age can be more successful at limiting the risk of poverty. Furthermore, their simulations indicate that there is scope to reorient the expenditures from old-age to working population and rebalance the tax liabilities in favor of the working population. These changes will not jeopardize the living standards of the elderly if the reforms include proper safety net measures.
The role of public pensions in reducing inequality can be very large because these pensions represent a large fraction on income in old-age. During the mid-2000s, public cash benefits accounted for 70% of income of retirement-age individuals in 24 OECD countries, and in many of them the figure was above 80% (OECD, 2008). In countries where public pensions are important, the effect of re-ranking when one uses the distribution of market or disposable income as the counterfactual can be large. Mahler and Jesuit (2006) find a sizeable effect of pensions (public and private) in reducing the Gini coefficient on 13 rich countries during the period 1980—2000. On average, the Gini is reduced from 0.43 to 0.27 when all taxes and transfers are considered, with a reduction of 0.039 points from taxes and 0.121 from transfers of which 0.068 comes from pensions, 0.013 from unemployment transfers, and 0.040 from other transfers. In Belgium, Sweden, and France, the reduction in the Gini is about 0.10 points due to pensions, while in the United States, Canada, and Australia it is only about 0.04 points. Lefebvre (2007) computes the marginal contribution of earnings, property income, private pensions, and public transfers on total inequality in 19 EU countries. Itis found that public pensions decrease inequality in all countries and that private pensions increase inequality in all countries except in Ireland and France. Similarly, Caminada et al. (2012) disentangle the changes of contributions of different income components in reducing inequality between the mid-1980s and mid-2000s in 12 LIS countries. Around 1985, the primary income Gini falls 0.139 points after transfers and taxes, while around 2005 this drop is about 0.163 points. The authors estimate that this increase in redistribution is mainly due to the state old-age and survivor benefits, which account for 60% ofthe total change. Different designs ofpen- sion systems have diverse effects on inequality. For example, Benedict and Shaw (1995) with data from the early 1980s, find that private pensions in the United States increase inequality among unionized workers by 21% with respect to observed wage inequality. On the reforms undertaken in Europe since the mid-1990s, Van Vliet et al. (2012) do not find evidence of important effects of those reforms on income inequality.
In general, the assessment of inequality is made in one single year, but studies such as Burtless (2006) emphasize that this approach can overestimate the redistributive impact of pensions. This is related to the question of what is the proper counterfactual distribution to use when one analyzes the impact of pensions. If pensions are simply absent, it is expected that individuals will look for other forms of savings to afford their old-age. Different living arrangements can also be different if pensions would be nonexistent or less generous, which will cause other redistributive effects (Burtless, 2006, 2009). In this regard, some authors favor the estimation of the distribution of lifetime income (e.g., Deaton et al., 2002; Liebman, 2002) although the data requirements are more demanding. This approach shares features with a growing literature studying lifetime income inequality (see for instance Aaberge and Mogstad, 2012) which highlights a life-cycle bias that overestimates income inequality when only one or a few years are analyzed.
23.3. BEYOND SOCIAL PROTECTION
23.3.1 Noncash Social Spending and Poverty
While cash transfers form a substantial proportion of overall social expenditure and have a pronounced impact on household incomes and poverty, other forms of social expenditure—such as health, housing, and perhaps education (which is sometimes included as “social” spending and sometimes not)—may also have substantial direct and indirect effects. Table 23.4 shows spending on cash transfers and on other forms of social expenditure—which one can think of as benefits in kind from a household perspective— based on the OECD’s social expenditure database before the onset ofthe economic crisis in 2007—2008, which has boosted expenditure on cash transfers in many countries. This shows that in about half the countries shown, cash transfers significantly outweighed such benefits in kind—notably, in the “continental/corporatist” countries like France, Germany, Belgium, and Luxembourg; in the southern countries of Italy, Spain, and Greece; and in Poland. However, in many of the other OECD countries, overall social spending was fairly evenly balanced between cash transfers and other spending. This is using a definition of social expenditure that does not include education, so if one adds education spending, the relative importance of noncash spending is even more obvious, as brought out in Marical et al. (2008). They conclude that public spending on health, education, and “other services” in the OECD social expenditure database represents an amount comparable to public cash transfers, exceeding those transfers in 11 OECD countries.
The impact of such noncash spending on poverty is difficult to assess for various reasons (see for example Currie and Gahvari, 2008; Garfinkel et al., 2006). One approach
Table 23.4 Social expenditure distinguishing cash and noncash benefits as percentage of GDP in OECD countries, mid-2000s
| Country | Cash transfers % of GDP | Noncash social benefits % of GDP |
| Australia | 8.1 | 6.7 |
| Austria | 18.4 | 8.2 |
| Belgium | 16.2 | 9.1 |
| Canada | 8.8 | 9.4 |
| Czech Republic | 11.4 | 7.8 |
| Denmark | 13.8 | 11.8 |
| Finland | 15.3 | 9.9 |
| France | 17.5 | 10.8 |
| Germany | 15.9 | 9.9 |
| Greece | 13.4 | 7.1 |
| Hungary | 13.8 | 8.7 |
| Ireland | 8.4 | 7.7 |
| Italy | 16.7 | 7.7 |
| Japan | 10.2 | 8.1 |
| Luxembourg | 13.9 | 8.8 |
| Netherlands | 11.1 | 8.5 |
| New Zealand | 9.7 | 8.4 |
| Norway | 10.9 | 10.1 |
| Poland | 15.7 | 4.9 |
| Slovak Republic | 10.2 | 6.1 |
| Spain | 13.1 | 7.4 |
| Sweden | 14.5 | 13.6 |
| Switzerland | 11.8 | 7.8 |
| UK | 10.3 | 10.5 |
| USA | 8.0 | 7.0 |
Source: OECD social expenditure database.
employed in comparative studies (Callan et al., 2008; Marical et al., 2008; Paulus et al., 2010; Smeeding et al., 1993) and in national studies (Aaberge and Lang0rgen, 2006; Callan and Keane, 2009; Harding et al., 2006; Nolan and Russell, 2001; Wolff and Zacharias, 2007) is to use micro data to assess who is benefiting from such expenditure and to what extent, and to compare overall inequality and (sometimes) poverty levels when this noncash income is included. With some studies this also means allocating indirect taxes to households and deducting them to arrive at a “final” income concept. Major decisions have to be made about how to value the benefits to users of services as has been debated in the literature for three decades. The empirical studies have shown that these can have a marked impact on the measured outcomes—notably, in the case of health spending where particularly challenging conceptual issues have to be addressed.
One complication is that services, which in principle are provided free or in subsidized fashion to everyone, may actually be readily available only in certain areas or to certain groups, or even if available may be taken up to a varying degree by those with higher versus lower levels of income or education. Information on actual use patterns may not always be available, and attributing a common value across a particular age group, for example, may be misleading. Empirical studies thus make use, where possible, of information—generally from household surveys—of actual usage patterns for the range of services involved, but this may not cover all the areas of expenditure one wants to include.
Difficulties then arise, though, first of all because one does not know whether households would have bought the same amount of the goods or services in question if those were not provided free or at a subsidized rate. Recipients may place a value on noncash benefits that is less than what they would have to pay for the good or service in the market, because the recipient has no choice in its allocation. However, a U.S. study of food stamps suggested that where the item is a basic necessity and the in-kind transfer is smaller than the amount the household would normally spend on that good, the value to the recipient may be very close to the market price (Moffit, 1989). Unlike food, what is meant by market price for many of the services provided by the state may itself be unclear since they are not available in the market—the most obvious examples being defense or law enforcement. If one takes the supply price (i.e., the cost to government) as the point of reference, the optimal level of provision will equate the marginal benefit with this price times the marginal cost of public funds. In any case, the widely used approach in empirical studies is simply to assume that the value of a particular (unit of a) service is equal to the average cost of producing it. Use of such an average may mask variations in quality of the service provided to different socioeconomic groups—for example, in the quality of the health care provided to the rich versus the poor—and that is another important aspect that is very difficult to capture empirically.
The second general issue arises where the noncash benefit covers something like health care, which is required to meet a specific contingency affecting only some households in a given year. In those circumstances, if we simply add the cost of the free or subsidized services supplied to the households consuming them, sick people will be richer than the healthy at any cash income level. One can in those circumstances attempt to also take the additional “needs” of such persons into account by elaboration of the equivalence scales employed—drawing on, for example, recent studies focused on the costs associated with disability such as in Jones and O’Donnell (1995) and Zaidi and Burchardt (2005)—but this remains underdeveloped. A more widely employed approach is that instead of basing values on the household’s own consumption, one attributes to all those eligible for state provision an extra income equal to the insurance premium they would have to pay to obtain the same level of cover in the market. Even assuming the cost of this cover can be established satisfactorily, a serious problem remains. Even the insurance value could be worth enough by itself to bring a household above the poverty threshold when it might still have insufficient cash income to buy enough food, clothing, or shelter, reinforcing the point that the in-kind transfer does not represent command over resources in the same way that cash income does. Furthermore, even with the insurance approach, the fact that different households have different underlying needs should be taken into account in arriving at conclusions about the welfare implications of in-kind benefits (see Aaberge et al., 2010).
The final, and fundamental, issue to be noted relates to the time-period employed. In measuring poverty and income inequality annual income is most often the focus, but in thinking about the consumption of education or health care and the value of the in-kind benefit they represent it would be natural to take a life-cycle approach, since the benefits are often long-term rather than confined to the point of use. Such an approach is very demanding in data terms and involves a wide range of assumptions for which it is difficult to find a robust empirical basis.
The results of recent empirical studies on this topic are of significant interest in the broader context of welfare state institutions and policies and their impact on poverty. Marical et al. (2006—and also chapter 9 in OECD, 2008) look at the impact of public spending on health, education, and social housing on income inequality in OECD countries, concluding that they generally contribute to narrowing inequality, though not usually by as much as cash transfers and direct taxes combined; they do not look at corresponding results forpoverty. Paulus et al. (2010) on the other hand assess the impact of valuing noncash or in-kind benefits from public housing subsidies, education, and health care in five European countries, recalculating both inequality and relative poverty measures when this value is added to cash income. In such an exercise, the relative income poverty threshold—in this case 60% of median equivalized income—is itself recalculated, rising by between about one-fifth and one-third in value when in-kind benefits are included. The proportion of persons falling below that threshold is found to be much lower than the corresponding figure based on cash income in all five countries, with reduction being greatest in the United Kingdom where the poverty rate falls by half and least in Greece where it still falls by one-third. There are also major effects on the composition of those falling below the threshold, with the reduction in poverty rate greatest for children and older people (since the incidence of spending on education and health care is particularly concentrated on them). This pattern is familiar, having featured strongly in Smeeding et al.’s (1993) early comparative study covering seven countries based on data in LIS.
Sutherland and co-authors caution that “it is doubtful whether these results should be interpreted as having any bearing on the assessment of poverty or inequality from a welfare perspective” (p. 259), being mainly of interest in showing the scale of noncash incomes relative to cash incomes, but without taking into account the needs of individuals for health care or education. The study goes on to attempt to take the variation in those needs into account via modifying the equivalence scales employed. It finds that the distributional effects of noncash transfers on several summary income inequality measures are then far more modest; corresponding results for poverty rates are not reported, but it seems likely that the same would be true in that case. It is also worth highlighting the argument by Bourguignon and Rogers (2007) that once the intertemporal or interge- nerational nature of the effects of many social expenditures are recognized, it is no longer possible to assume that they are equivalent to cash transfers, food subsidies, and other programs of direct redistribution. Education spending is an investment in future generations and may have redistributive effects for these generations, but may worsen distribution initially. Moral hazard makes it infeasible to borrow against the human capital of one’s descendants, so an increase in public education expenditures financed by an increase in a neutral tax may actually be regressive for the generations with schoolage children. Poor households in this generation pay the tax and receive no benefit, whereas rich households pay the tax but may recover it through intergenerational reallocation of consumption (that is, smaller bequests to their children). Intergenerational accounting may then be necessary to more fully capture the redistributive and poverty-related effects.
23.3.2 The Labor Market, Education, and Active Labor Market Policy
Income derived from the labor market is central to the overall distribution of income and to poverty and disadvantage at household level (see for example OECD, 2008). Even for those not currently earning (via employment or self-employment), previous labor market experience may determine current entitlement to social protection or to occupational pensions. A wide variety of studies on poverty in individual countries, both descriptive and econometric, find that those in work are much less likely to be poor than the unemployed or working-age inactive. Cross-country differences in labor market performance and structure then seem a natural starting point in seeking to understand cross-country variation in poverty rates (Burniaux et al., 1998; Forster and Mira d’Ercole, 2005). The poverty rate among the working-age population varies greatly across OECD countries and is indeed the main contributor to overall poverty headcounts (see for example OECD, 2009). However, at the country level working-age poverty—overall or for specific groups—is not in fact strongly linked to employment rates. Burniaux et al. (2006) report some relationship between female participation rates and poverty rates across OECD countries, but it is not particularly strong. Poverty rates are generally lower in low unemployment countries and vice versa, but there are notable exceptions. High employment rate is not a sufficient condition for low poverty among the working-aged population (see also the simulations in Marx et al., 2012b). At the aggregate level, then, employment performances are not the main driver of cross-country differences in the overall poverty risk among the working-age population (OECD, 2009).
There is thus a contrast between micro studies on poverty and the labor market in individual countries, which tends to focus on the labor market situation and experience of individuals and their households and the characteristics associated with good rather than bad labor market outcomes for them, and comparative studies at the aggregate level, which focus on labor market institutions and performance. The relationship between individual characteristics and labor market outcomes is of course a core concern of labor market research, as is the structure of earnings in terms of overall dispersion and differentials. (For reviews see the Handbook of Labour Economics; Ashenfelter and Card, 1999, 2011; Ashenfelter and Layard, 1987; Blau and Kahn, 2008; and Chapter 18 of this volume by Checchi and Salverda.) The extent to which individual disadvantage and relatively bad labor market outcomes manifest themselves in high-poverty rates depends on the household, labor market, and institutional settings in which those disadvantages are experienced. Comparative studies of the relationship between poverty and the labor market at the aggregate level include collective bargaining structures, the role of unions, minimum wages, and so forth, in the explanatory variables employed as key aspects of labor market institutions (see, for example, Burniaux and Mira d’Ercole, 2006). These may often be embedded in wider sets of variables covering, for example, welfare spending and structures, intended not only to serve as controls but also to capture broader concepts of the welfare state “regime,” as discussed in Section 23.1.4. This reflects a recognition that labor market institutions, while central, are inextricably bound up with the broader welfare state, and that the impact on poverty of, for example, a minimum wage will vary depending on that broader context—as brought out in our discussion of in-work poverty and social protection transfers in Section 23.2.4.
A core element of that broader welfare state, strongly linked to the labor market, is the education system and educational spending. Once again a contrast may be drawn between micro studies on the relationship between educational attainment, earnings, and poverty at individual or household level, and studies at the aggregate level that focus on the education system and spending and their impact on economic performance and poverty. The relationship between educational attainment and earnings/labor market outcomes for individuals has been a major preoccupation of labor market research since the earnings equation first derived by Mincer (1958) became a basic tool of analysis, but the broader role of education as a facilitator or engine of economic growth is also a major focus of research. The concept of “human capital” has become embedded since the “Chicago School” of economics (see especially Becker, 1964; Mincer, 1958), with human capital seen as similar to physical means of production in that investment in enhancing capacities and skills, notably through education and training, also increases future productive capacity. Microeconomic investigation of this relationship via estimation of the returns accruing to the individual in terms of earnings is the topic of a vast array of empirical economic research, including investigation of the extent to which the positive earnings differentials for the more educated may be interpreted as a causal impact of education itself rather than selection (on which see for example Card, 1999; Machin, 2008). The impact of educational attainment on the likelihood of being in poverty is also a consistent finding from microeconometric analysis of individual OECD countries and holds whether poverty is measured in terms of low annual income, persistent low income, or levels of deprivation (see for example Fouarge and Layte, 2005; Layte and Whelan, 2002), though the relative and absolute “penalty” paid for low educational attainment in terms of enhanced poverty risk varies substantially across countries.
The implications of this individual-level link between educational attainment and poverty risk for aggregate performance and for policy is not as straightforward as it is often taken to be, and requires further research. Improving the education and skills of the workforce has assumed a central role in strategies to promote economic growth and tackle poverty and exclusion. This is illustrated by the European Union’s, 2013 Social Investment Package, which focuses on policies designed to strengthen people’s skills and capacities, including education and child care as well as active labor market policies (see European Commission, 2013), or in a U.S. context by the Obama administration highlighting that “To prepare Americans for the jobs of the future and help restore middle-class security, we have to out-educate the world and that starts with a strong school system.” This reflects, in particular, the concern that the low-skilled in advanced economies are being left behind by rapid technological change in a globalized world economy, as discussed in depth in Freeman (2008) and Chapter 20 by Kanbur in this volume. On the role of education in this context, OECD (2011a) concludes that between the mid-1980s and the mid-2000s the sizeable disequalizing effect on earnings of factors such as technological change, more flexible labor market regulation, and less generous unemployment insurance was largely offset by growth in average educational attainment, up-skilling serving to reduce wage dispersion among workers and increase employment rates.
However, the corollary is not that continued expansion in education per se will be effective as an equalizing or antipoverty policy. As Checchi et al. (2014) emphasize, increasing average levels of educational attainment was associated with reducing dispersion in attainment in many OECD countries over the twentieth century, but with completion rates at second level approaching saturation in many rich countries, the main issue facing educational policies in most OECD countries now is whether they should pursue further expansion at tertiary level. Such expansion, depending on how it is brought about and underpinned, may not benefit those from poorer backgrounds, as we discuss in the context of intergenerational transmission of disadvantage in the next section. Research on how best to enhance skills in the middle and bottom parts of the distribution in secondary school, including performance in mathematics and languages, as well as issues of
http://www.whitehouse.gov/issues/education, downloaded July 25, 2013. school system structures, tracking, and early childhood education, discussed in the next section are thus also central to the research agenda from a poverty perspective.
Training and skill enhancement, as well as matching, are important components of the active labor market programs and activation strategies that are now widely seen as at the core of antipoverty policies (see European Commission, 2013; OECD, 2009). These have been the subject of a very substantial research literature, covering the evaluation of the impact of specific interventions and of active labor market policies more broadly. For reviews see Heckman et al. (1999), OECD (2005, 2007b), Card et al. (2010), and Kluve (2010). The general thrust of these evaluations, when carried out rigorously, was not particularly positive for a time, as reflected in Richard Freeman’s summary that “Random assignment social experiments analysed with care.... have shown us that one favourite solution to labour market problems—training and other active labour market measures—have at best only modest effects on outcomes” (Freeman, 1998, p. 16). More recent evaluations have been more positive in tone, with OECD (2009), for example, concluding that activation programs can have a significant impact on unemployment. Card et al.’s (2010) meta-analysis of microeconometric evaluations yields particularly interesting findings from both a substantive and methodological point of view. They find subsidized public sector employment programs to have the least favorable impact estimates, whereas job-search assistance programs have relatively favorable short-run impacts, classroom and on-the-job training programs tend to show better outcomes in the medium-run than in the short-run, and programs for youths are less likely to yield positive impacts than untargeted programs. Methodologically, they find that—controlling for the outcome measure and the type of program and participants—experimental and nonexperimental studies have similar impact estimates, suggesting that the research designs used in recent nonexperimental evaluations are unbiased. They also note that the outcome variable used to measure program effectiveness matters, with evaluations based on registered unemployment durations being more likely to show favorable short-term impacts. The outcome variable is also clearly very important from a poverty perspective: It cannot be taken for granted that success in terms of a transition from unemployment into employment, even if sustained, leads to an escape from poverty because not all those benefiting may have been in poverty when unemployed. For those who were in poverty, the increase in income involved after taxes and withdrawal of benefits may not suffice to lift the household above a poverty threshold, as discussed at some length in Section 23.3. The rigorous evaluation of active labor market programs in terms of their impact on poverty remains a major gap to be filled.
As is noted in Card et al.’s (2010) work, active labor market programs are widely diverse. An effort to categorize these policies in relation to their political determinants is made by Bonoli (2010) on the basis of national variation across OECD economies. However, Bonoli found little regularity over time in these determinants, with a mix of leftist and centrist political parties in each period advocating active labor market policies. Moreover, Bruno and Rovelli (2010) compare and document differences in labor market policies in EU countries in 2000s and find that, in general, higher rates of employment are associated with more expenditure on active labor market programs for countries with a larger share of the population embracing pro-work attitudes. Recently, an OECD (2013) study analyzing activation programs in OECD countries and with more detail in Ireland, the United Kingdom, Japan, Norway, Finland, Switzerland, and Australia brings out the different responses of expenditures on activation programs after the economic crisis, finding it difficult to establish a common pattern.
23.3.3 Intergenerational Transmission, Childhood, and Neighborhoods
The intergenerational transmission of poverty and disadvantage continues to be a core concern for research and policy. Research on income mobility across the distribution is the topic of Chapter 10 by Jantti and Jenkins, but here it is important to reiterate that there is substantial evidence from country-specific studies that mobility is particularly limited toward the bottom of the socioeconomic hierarchy, so that poverty is to a significant degree inherited across generations. Examples from research in the United States include Wilson (1987), Gottschalk et al. (1994), Duncan et al. (1994,1998), Duncan and Brooks-Gunn (1997), and Corcoran (2001); for Canada, see Corak (2001); for recent U.K. studies include Sigle-Rushton (2004) and Blanden and Gibbons (2006), and similar studies that trace current poverty or disadvantage to conditions in childhood that exist for other rich countries. The likelihood of being a welfare recipient is also seen to be associated across generations—see, for example, Corak (2004) for Sweden and Canada and Page (2004) for the United States.
OECD (2009) concludes that variation in the strength of transmission of poverty across countries cannot reliably be assessed with the available evidence. However, the findings of Jantti et al. (2006) showing considerably greater upward mobility in individual earnings from the bottom quintile in the Scandinavian countries than in the United Kingdom and especially the United States, and those of Raaum et al. (2007) that the intergenerational transmission of family earnings is also significantly stronger in the United Kingdom and even more so the United States than in the Scandinavian countries, are suggestive (see also Aaberge et al., 2002). Furthermore, recent studies by EspingAndersen and Wagner (2010) and Whelan et al. (2013) have been able to exploit the availability of harmonized data from a special module on intergenerational transmission attached to EU-SILC in 2005. Esping-Andersen and Wagner estimate the impact of economic hardship during childhood on both educational attainment and adult income (controlling inter alia for lone motherhood and parents’ education) in Denmark, Norway, France, Italy, Spain, and the United Kingdom. They conclude that economic hardship in childhood has no direct effects on adult income in any of the countries, but it does have powerful indirect effects via children’s educational attainment; this effect disappears among the youngest cohorts in both Denmark and Norway but not in the other countries, leading the authors to conclude that the Scandinavian countries are more recently succeeding in minimizing the adverse consequences of economic want in childhood. This is consistent with Whelan, Nolan, and Maitre’s study, which included a broader range of EU countries and found that factors such as parental class, parental education, and childhood economic circumstances/hardship had less influence on income poverty and a broader, multidimensional measure of vulnerability in social democratic countries than in countries in the liberal and southern European welfare regimes.
Understanding the mechanisms at work is clearly vital in designing strategies aimed at reducing the extent to which poverty is handed down from one generation to the next, and both causal channels and policy responses have been the subject of substantial bodies of literature (for reviews see D’Addio, 2007; Esping-Andersen, 2004a,b; Nolan et al., 2011). Studies focused on the United States show that the inheritance of poverty is connected with substantially less schooling (on average, poor children will have 2 years fewer schooling than nonpoor children), poor health, and crime (Duncan and Brooks-Gunn, 1997; Mayer, 1997), and similar if less dramatic effects have been documented for the United Kingdom (Gregg et al., 1999) and France (CERC, 2004; Maurin, 2002). Gregg et al.’s (1999) study controls for the child’s abilities (via cognitive test scores at age seven), and still finds strong poverty effects. U.S. and British studies demonstrate strong negative effects of lone motherhood on child outcomes, but also suggest that the main reason has to do with poor economic conditions (Biblarz and Raftery, 1999; Gregg et al., 1999; McLanahan and Sandefur, 1994), while selection into lone parenthood may also be a factor (Piketty, 2003). Interestingly, Esping-Andersen and Wagner’s (2010) multicountry study found no significant effects of lone motherhood on educational attainment or adult income having controlled for mother’s education and childhood financial hardship.
The impact of genes/nature versus nurture and the interactions between them have been the topic of much debate in the broader intergenerational mobility literature, as discussed in Jantti and Jenkins’ Chapter 10. (See also Chapter 18 by O’Donnell, Van Doorslaer and Van Ourti for a detailed discussion on health and inequality.) From the point of view of transmission of poverty and disadvantage, the key thrust of recent findings is that cognitive skills and family finances matter, but so do noncognitive abilities, social skills, cultural resources, motivation and, more generally, the familial “learning milieu.” Cognitive and noncognitive skills are influenced by family endowments that are neither strictly financial or genetic. Heckman and Lochner (2000) and Carneiro and Heckman (2003) have been influential studies, with their “learning-begets-learning” model stressing the fundamental causal importance of conditions in the preschool years, especially those related to behavioral and cognitive development. There is growing consensus in the literature that conditions when children are under age 6, or even 3, are decisive for their cognitive skills, sense of security, and ability and motivation to learn (Danziger and Waldfogel, 2000; Duncan and Brooks-Gunn, 1997). Substantial differences in children’s cognitive abilities by parents’ socioeconomic status emerge at early ages and carry through to subsequent achievements in education and earnings (e.g., Cunha and Heckman, 2007); poverty in early childhood has strong adverse effects on these later outcomes, partly because of parental traits such as poor cognitive and noncog- nitive skills and the effects of family “culture,” in particular in terms of how it influences parenting behavior and child stimulation (de Graaf et al., 2000; Esping-Andersen, 2007).
This has significantly influenced thinking about the role of education in seeking to reduce intergenerational transmission of poverty. Mounting evidence suggests that differences in the design and financing of education systems per se seem to matter rather less than had been thought. There appears to be a broad consensus that early tracking according to ability reduces educational mobility across generations (see Hanushek and Woessmann, 2006), with the abolition of early tracking and the introduction of comprehensive school systems seen to have boosted educational attainment among the least privileged social strata in Sweden, Finland, and Norway. Since these are also countries in which welfare state redistribution increased substantially over the same period, it is difficult to identify how much of it was education reform or income equalization that produced higher mobility. However, Blanden et al.’s (2005) U.K. analyses suggest that education reform that delayed tracking produced a substantial increase in intergenera- tional mobility there, primarily to the benefit of children from low-income families, which cannot be ascribed to an increase in welfare state redistribution because over the period in question income inequality actually grew. More broadly, though, it has become increasingly clear that generalized policies promoting the attainment of higher levels of education by increasing the proportion going on to third level—assigned a central role in strategies aimed at improving equality of opportunity in many countries—may not be adequate if the aim is to address the disadvantages that children from poorer backgrounds face from the outset.
This has served to reinforce the emphasis in recent literature arguing for an early childhood focus, and that high-quality early childhood programs can significantly improve both cognitive and noncognitive outcomes for disadvantaged children (Carneiro and Heckman, 2003; Currie, 2001; Karoly et al., 2005; Waldfogel, 2006). Heckman’s work has been particularly influential in demonstrating that investing in early childhood is a cost-effective policy (though the broader implications in terms of later interventions have been hotly debated). The core evidence that underpins Heckman’s work comes from early intervention programs in the United States, but Esping-Andersen (2004a,b) relates the significant decline in social inheritance effects for the Nordic countries to the introduction of universal, high-quality child care. Schtitz et al. (2005) in their cross-sectional comparison across countries report an inverted U-shaped relationship between family background effect and preschool enrolment, which suggests that early education may reduce the extent to which family background shapes life chances. OECD (2009) concludes that good quality care in early childhood, preschool, and also school years, are essential tools for promoting intergenerational mobility.
Going beyond education, the extent and nature of the welfare state itself can clearly affect the intergenerational transmission of poverty, indeed this is often articulated as a core aim in terms of equalizing children’s life chances and avoiding wasted potential. One might expect that social policies that reduce child poverty (such as effective income support and promoting maternal employment, as discussed earlier—see UNICEF, 2007; Whiteford and Adema, 2007) would also promote more intergenerational inequality, but directly demonstrating that link is less straightforward. Mayer (1997), for example, argued that low income in itself is less important than parental characteristics such as low skills, poor health, or deviance, which affect the likelihood of being poor. In a comparison across the United States, though, Mayer and Lopoo (2008) find that in high-spending states the difference in mobility between advantaged and disadvantaged children is smaller than in low-spending states. It has been calculated that the risk of child poverty falls by a factor of four when mothers are employed (Esping-Andersen, 2009). There is also some evidence that intergenerational transmission of welfare dependency may be related to program design, with Corak et al.’s (2004) comparison ofcash support schemes in North America and Sweden suggesting that passive programs are more likely to promote the transmission of welfare dependency than active ones. More generally, benefit systems that rely heavily on means-testing are more likely to create the poverty and unemployment traps that make it more likely that poverty and welfare dependency persist into subsequent generations.
Finally, still focusing on children and the transmission of poverty, an issue that has received considerable attention in the research literature is the potential effect of living in a “bad” neighborhood. Some studies suggest that local conditions can help explain the intergenerational transmission of income (OECD, 2008), although their impact may be relatively weak even in the United States. The range of U.S.-focused studies reported in Brooks-Gunn et al. (1997) suggested that neighborhood does matter for child and youth development, having greatest impact in early childhood and late adolescence and less in between, but the size of these effects was usually much smaller than those of family-level conditions. Solon et al. (2000) used the cluster sampling design of the Panel Study of Income Dynamics to estimate both sibling and neighborhood correlations on years of schooling and found sibling correlations of around 0.5, whereas their neighborhood estimates were as low as 0.1. Raaum et al. (2003) used Norwegian census data and concluded likewise that neighborhood correlations were small compared to sibling correlations, both for educational attainment and long-run earnings. This is consistent with the findings of U.S. experiments where families living in public housing were assigned housing vouchers by lottery encouraging them to move to neighborhoods with lower poverty rates; the results reported in Sanbonmatsu et al. (2006) show no significant effects on test scores. Looking beyond educational attainment to a broader set of poverty-related outcomes, the difficulties in adequately characterizing neighborhoods in terms of all their potentially relevant characteristics, and of distinguishing their effects on poverty and related outcomes from those of individual/family characteristics—taking into account that there may be interactions between them—have also been emphasized in research outside the United States (see Lupton, 2003).
23.4. THE WELFARE STATE, ANTIPOVERTY POLICY, AND THE ECONOMIC CRISIS OF THE LATE 2000s
23.4.1 Poverty, Income Inequality, and the Economic Crisis
The economic crisis experienced by the OECD countries since 2007—2008 has been the most serious since the Great Depression ofthe 1930s in terms of its impact on output and growth and is central to the ways in which poverty and antipoverty policies are now being thought about, studied, and debated. The crisis has affected poverty directly, as we will discuss, but it also has altered the context in which welfare states are currently operating and perspectives on how they are and should be evolving in the medium term. Here, we look first at the evidence on the immediate impact of the crisis, and then at the medium-term context for antipoverty policy.
The immediate impact of the crisis on income inequality and poverty has been the subject of a number of national and comparative studies, including Matsaganis and Leventi (2013), Callan et al. (2011), Figari et al. (2011), andJenkins et al. (2013). Jenkins and colleagues adopt a comparative perspective, looking at aggregate indicators across the OECD and at six case-study countries in depth. Their central conclusion is that the immediate impact of the crisis on income inequality and income poverty in most countries was much more modest than the dramatic experience of the Great Depression, although not so different from more recent recessions, such as the Nordic crisis of the early 1990s. They stress that a striking feature of the crisis from 2007 to 2008 has been the extent to which its macroeconomic impact varied across countries: in some there were major declines in economic activity and sharply rising unemployment, but in others there was much more modest changes in growth and employment (see also Lane and Milesi-Ferretti, 2012). The peak-to-trough fall in quarterly GDP was substantially larger than the average fall during recessions over the previous 50 years almost everywhere but ranged, nonetheless, from zero in Australia to nearly 13% in Ireland. Another feature highlighted is that GDP declines were not fully transmitted into falls in the real disposable income of households, which were protected by both automatic stabilizers and additional support of governments through the tax and benefit system. The immediate response of employment to the fall in GDP was also frequently smaller than in previous recessions, though this was not the case in countries such as Ireland, Spain, and the United States where a boom-bust pattern in the housing market played an important role in the recession. Large falls in individual employment were also accompanied by significant rises in household worklessness in countries such as Ireland, Spain, and the United States, but not in some others—notably, Denmark and Finland where the workless household rate fell despite relatively large increases in the individual nonemployment rate, cushioning the impact on poverty. Another feature of the immediate onset of the crisis was the decline in income from capital, concentrated among richer households.
Looking at available poverty indicators up to 2009 compared with pre-crisis, Jenkins and colleagues found that relative income poverty rates typically fell in European countries, whereas absolute poverty rates (using “anchored” income thresholds indexed to prices) tended to fall slightly in Europe while rising modestly in the United States (as measured with the U.S. official poverty line), but in both cases these rates fell for the elderly. The six countries they studied in detail—Germany, Ireland, Italy, Sweden, the United Kingdom, and the United States—experienced differing macroeconomic shocks, with Germany recovering very rapidly, Sweden seeing a large decline in GDP but relatively rapid recovery, the United States experiencing marked contraction followed by some recovery, Italy and the United Kingdom seeing major downturns, and Ireland experiencing the largest GDP decline among OECD countries. Germany saw little change in employment, whereas in Ireland and in the United States at the other extreme, unemployment rose rapidly. The short-run impact on household income inequality and poverty was relatively modest. In Germany, the proportion of persons with a household income less than 60% of the contemporary median income declined marginally, and the proportion in households below such an income threshold held fixed in purchasing power at its 2007 level also fell. Chapter 2 shows that median income, inequality, and relative poverty all rose slightly in 2010. In the United Kingdom, the number falling below 60% of median income fell by more than 1 percentage point, and a fixed real threshold showed a larger decline in poverty. In Sweden, the proportion falling below 60% of median income increased, although when a threshold fixed in purchasing power terms is employed the increase was a good deal smaller. In Ireland, relative income poverty declined between 2007 and 2009 while the proportion below a fixed real income threshold remained stable. In Italy, the buffering role of social transfers was relatively limited, although the consequent increase in poverty might be considered modest given the scale of the initial macroeconomic shock. Finally, in the United States, the relative poverty rate declined modestly, reflecting a decline in real median income, whereas the official poverty rate (calculated using a low-income cut-off held fixed in real terms) increased. In all six case-study countries, elderly people were relatively well protected, compared with children and individuals of working age.
The variation in the distributional impact of the crisis to date across countries reflects not only differences in the nature of the macroeconomic downturn but also differences in how cash transfers and direct taxes cushioned household net incomes from the full effects of what was happening to market incomes. To some extent, these are differences in automatic stabilization and so they vary with the generosity and comprehensiveness of social safety nets and the structure and levels of direct taxes and social insurance contributions. However, policy responses and choices as the recession impacted have also been important (for a discussion of EU government’s initial responses to the crisis see Marchal et al., 2014).
More recent poverty indicators for European countries produced by Eurostat, up to 2011, also show that experiences have been quite varied. As shown in Table 23.5, between 2007 and 2011 the proportion falling below 60% of median income rose by 1 percentage point or more in eight countries, fell by that amount in seven countries, and was stable in the rest. The average relative income poverty rate across the EU 27 was 16.5% in 2007 and 16.9% in 2011. Income poverty rates “anchored” at the 2008 60% of median threshold and then indexed to prices showed a good deal more variability over time across EU countries, as Table 23.6 shows. This rose in 13 countries, sometimes by a remarkably large amount—by 11 percentage points in Latvia and Lithuania and almost 14 percentage points in Iceland; however, it fell in another 10 countries, so that the overall average across the EU rose only from 16.4% to 17.5%. It is interesting to compare this with the trend in material deprivation over the same period, as measured by the EU’s severe material deprivation indicator: Table 23.7 shows that this rose between 2008 and 2011 in 13 countries while falling in 6; the average across the EU rose marginally. Among countries particularly hard hit by the crisis, deprivation rose sharply in Ireland, Spain, Greece, and Italy, as well as in Latvia and Lithuania, but fell in Portugal.
23.4.2 The Crisis and Antipoverty Policy in the Medium Term
The immediate impact of the onset of the crisis from 2007 to 2008 on living standards and poverty was cushioned, at least to some extent, by welfare state institutions and in particular by social protection and tax systems. The medium-term impact of the crisis on poverty depends not only on developments in the macroeconomy and in employment, but also on the policies adopted with respect to the welfare state broadly conceived and to transfers most particularly. The effects of the crisis on the public finances are dominant in framing the context in which these choices are being made. The need—or perception of such a need—to consolidate public finances plays a central role in debates about responding to the crisis, with tackling poverty often relegated to a more modest role. This could lead to changes to welfare state systems and parameters that will take many years to work their way through, continuing to have an impact on poverty long after economic growth has resumed and the recession is considered to have ended from a purely macroeconomic perspective. (The fairness of fiscal consolidation programs may itself affect the likelihood ofthem being successful, as analyzed by Kaplanoglou et al. (2013) for 29 OECD countries over the period 1971—2009; their results suggest that programs improving the targeting of
Table 23.5 Relative income poverty rates (60% of median threshold), European Union countries 2007-2011
| Country | 2007 (%) | 2008 (%) | 2009 (%) | 2010 (%) | 2011 (%) |
| Belgium | 15.2 | 14.7 | 14.6 | 14.6 | 15.3 |
| Bulgaria | 22.0 | 21.4 | 21.8 | 20.7 | 22.3 |
| Czech Republic | 9.6 | 9.0 | 8.6 | 9.0 | 9.8 |
| Denmark | 11.7 | 11.8 | 13.1 | 13.3 | 13.0 |
| Germany | 15.2 | 15.2 | 15.5 | 15.6 | 15.8 |
| Estonia | 19.4 | 19.5 | 19.7 | 15.8 | 17.5 |
| Ireland | 17.2 | 15.5 | 15.0 | 16.1 | — |
| Greece | 20.3 | 20.1 | 19.7 | 20.1 | 21.4 |
| Spain | 19.7 | 19.6 | 19.5 | 20.7 | 21.8 |
| France | 13.1 | 12.7 | 12.9 | 13.3 | 14.0 |
| Italy | 19.8 | 18.7 | 18.4 | 18.2 | 19.6 |
| Cyprus | 15.5 | 15.9 | 15.8 | 15.1 | 14.5 |
| Latvia | 21.2 | 25.6 | 25.7 | 21.3 | 19.1 |
| Lithuania | 19.1 | 20.0 | 20.6 | 20.2 | 20.0 |
| Luxembourg | 13.5 | 13.4 | 14.9 | 14.5 | 13.6 |
| Hungary | 12.3 | 12.4 | 12.4 | 12.3 | 13.8 |
| Malta | 14.8 | 15.0 | 15.3 | 15.0 | 15.4 |
| Netherlands | 10.2 | 10.5 | 11.1 | 10.3 | 11.0 |
| Austria | 12.0 | 12.4 | 12.0 | 12.1 | 12.6 |
| Poland | 17.3 | 16.9 | 17.1 | 17.6 | 17.7 |
| Portugal | 18.1 | 18.5 | 17.9 | 17.9 | 18.0 |
| Romania | 24.8 | 23.4 | 22.4 | 21.1 | 22.2 |
| Slovenia | 11.5 | 12.3 | 11.3 | 12.7 | 13.6 |
| Slovakia | 10.6 | 10.9 | 11.0 | 12.0 | 13.0 |
| Finland | 13.0 | 13.6 | 13.8 | 13.1 | 13.7 |
| Sweden | 10.5 | 12.2 | 13.3 | 12.9 | 14.0 |
| United Kingdom | 18.6 | 18.7 | 17.3 | 17.1 | 16.2 |
| Iceland | 10.1 | 10.1 | 10.2 | 9.8 | 9.2 |
| Norway | 11.9 | 11.4 | 11.7 | 11.2 | 10.5 |
| Switzerland | — | 16.2 | 15.1 | 15.0 | 15.0 |
| Croatia | 18 | 17.3 | 17.9 | 20.5 | 21.1 |
| European Union (27 countries) | 16.5 | 16.4 | 16.3 | 16.4 | 16.9 |
Notes: The household income statistics in Eurostat are mainly produced with EU-SILC data, which reference period is a fixed 12-month period (such as the previous calendar or tax year) for all countries except the United Kingdom for which the income reference period is the current year and IE for which the survey is continuous and income is collected for the last 12 months.
Source: Eurostat (downloaded March 20, 2013).
social transfers and their effectiveness in poverty alleviation, increasing spending on training and active labor market policies, and even reducing value-added taxes on necessities, enhance the probability of successful adjustment while promoting social cohesion.)
In such a context, the pressure to increase the targeting of cash transfers is likely to intensify, although that can run the risk of worsening poverty and unemployment
Table 23.6 Anchored income poverty rates (60% of median threshold in 2008, indexed to consumer prices subsequently), European Union countries 2008-2011
| Country | 2008 (%) | 2009 (%) | 2010 (%) | 2011 (%) |
| Belgium | 14.7 | 13.1 | bgcolor=white>13.013.5 | |
| Bulgaria | 21.4 | 16.1 | 14.8 | 17.8 |
| Czech Republic | 9.0 | 8.1 | 7.8 | 8.6 |
| Denmark | 11.8 | 13.1 | 12.6 | 12.2 |
| Germany | 15.2 | 16.0 | 15.8 | 15.9 |
| Estonia | 19.5 | 18.9 | 19.7 | 23.9 |
| Ireland | 15.5 | 15.4 | 22.8 | — |
| Greece | 20.1 | 18.9 | 18.0 | 24.9 |
| Spain | 19.6 | 20.2 | 22.3 | 25.7 |
| France | 12.7 | 12.7 | 12.3 | 13.9 |
| Italy | 18.7 | 19.9 | 19.3 | 21.4 |
| Cyprus | 15.9 | 16.3 | 16.2 | 14.4 |
| Latvia | 25.6 | 26.0 | 33.0 | 36.2 |
| Lithuania | 20.0 | 18.6 | 28.4 | 30.8 |
| Luxembourg | 13.4 | 15.5 | 14.4 | 14.6 |
| Hungary | 12.4 | 11.8 | 13.7 | 14.7 |
| Malta | 15.0 | 14.3 | 16.5 | 15.9 |
| Netherlands | 10.5 | 10.6 | 10.0 | 11.0 |
| Austria | 12.4 | 11.4 | 11.0 | 10.5 |
| Poland | 16.9 | 13.7 | 13.0 | 11.9 |
| Portugal | 18.5 | 18.1 | 16.1 | 17.9 |
| Romania | 23.4 | 18.2 | 16.2 | 17.9 |
| Slovenia | 12.3 | 10.2 | 12.1 | 13.0 |
| Slovakia | 10.9 | 7.8 | 7.3 | 7.0 |
| Finland | 13.6 | 13.0 | 12.0 | 12.3 |
| Sweden | 12.2 | 11.7 | 11.2 | 11.6 |
| United Kingdom | 18.7 | 20.4 | 21.4 | 21.8 |
| Iceland | 10.1 | 9.8 | 16.7 | 23.7 |
| Norway | 11.4 | 10.2 | 9.6 | 8.9 |
| Switzerland | 16.2 | 13.8 | 13.8 | 13.1 |
| European Union (27 countries) | 16.4 | 16.3 | 16.4 | 17.5 |
Notes: The household income statistics in Eurostat are mainly produced with EU-SILC data, which reference period is a fixed 12-month period (such as the previous calendar or tax year) for all countries except the United Kingdom for which the income reference period is the current year and IE for which the survey is continuous and income is collected for the last 12 months.
Source: Eurostat (downloaded March 20, 2013).
“traps” and undermining the bases for social solidarity and political support for relatively generous provision. The notion of “social investment” has come to play a major part in debates about the role of social spending and the future of welfare states in rich countries, particularly in Europe where the language of social investment has become embedded in EU discourse since the adoption of the Lisbon Agenda in 2000. A number of important
Table 23.7 Severe material deprivation rate, European Union countries 2008-2011
| Country | 2007 (%) | 2008 (%) | 2009 (%) | 2010 (%) | 2011 (%) |
| Belgium | 5.7 | 5.6 | 5.2 | 5.9 | 5.7 |
| Bulgaria | 57.6 | 41.2 | 41.9 | 45.7 | 43.6 |
| Czech Republic | 7.4 | 6.8 | 6.1 | 6.2 | 6.1 |
| Denmark | 3.3 | 2.0 | 2.3 | 2.7 | 2.6 |
| Germany | 4.8 | 5.5 | 5.4 | 4.5 | 5.3 |
| Estonia | 5.6 | 4.9 | 6.2 | 9.0 | 8.7 |
| Ireland | 4.5 | 5.5 | 6.1 | 7.5 | — |
| Greece | 11.5 | 11.2 | 11.0 | 11.6 | 15.2 |
| Spain | 3.0 | 2.5 | 3.5 | 4.0 | 3.9 |
| France | 4.7 | 5.4 | 5.6 | 5.8 | 5.2 |
| Italy | 6.8 | 7.5 | 7.0 | 6.9 | 11.2 |
| Cyprus | 13.3 | 9.1 | 9.5 | 10.1 | 10.8 |
| Latvia | 24.9 | 19.0 | 21.9 | 27.4 | bgcolor=white>31.4|
| Lithuania | 16.6 | 12.3 | 15.1 | 19.5 | 18.5 |
| Luxembourg | 0.8 | 0.7 | 1.1 | 0.5 | 1.2 |
| Hungary | 19.9 | 17.9 | 20.3 | 21.6 | 23.1 |
| Malta | 4.2 | 4.0 | 4.7 | 5.7 | 6.3 |
| Netherlands | 1.7 | 1.5 | 1.4 | 2.2 | 2.5 |
| Austria | 3.3 | 6.4 | 4.8 | 4.3 | 3.9 |
| Poland | 22.3 | 17.7 | 15.0 | 14.2 | 13.0 |
| Portugal | 9.6 | 9.7 | 9.1 | 9.0 | 8.3 |
| Romania | 36.5 | 32.9 | 32.2 | 31.0 | 29.4 |
| Slovenia | 5.1 | 6.7 | 6.1 | 5.9 | 6.1 |
| Slovakia | 13.7 | 11.8 | 11.1 | 11.4 | 10.6 |
| Finland | 3.6 | 3.5 | 2.8 | 2.8 | 3.2 |
| Sweden | 2.2 | 1.4 | 1.6 | 1.3 | 1.2 |
| United Kingdom | 4.2 | 4.5 | 3.3 | 4.8 | 5.1 |
| Iceland | 2.1 | 0.8 | 0.8 | 1.8 | 2.1 |
| Norway | 2.3 | 2.0 | 2.2 | 2.0 | 2.3 |
| Switzerland | — | 2.2 | 2.1 | 1.7 | 1.0 |
| Croatia | — | — | — | 14.5 | 14.8 |
| European Union (27 countries) | 9.1 | 8.4 | 8.1 | 8.3 | 8.8 |
Source: Eurostat (downloaded March 20, 2013).
recent contributions have highlighted the potential of social investment as a new perspective on or a paradigm for social policy in the context of the economic crisis and to the demand of the knowledge-based economy more broadly, as an alternative to neoliberal responses focusing on retrenchment in social spending, and as a key ingredient in responding to the macroeconomic/Euro crisis (see the contributions to Hemerijck and Vandenbroucke, 2012; Morel et al., 2011; Vandenbroucke et al., 2011). Others have sought to assess the extent to which recent directions in social policies and spending patterns could be characterized as moving toward a social investment strategy and whether disappointing outcomes in terms of poverty can be seen as a failure of such a strategy (Cantillon, 2011; Vandenbroucke and Vleminckx, 2011; van Kersbergen and Hemerijck, 2012). The EU is paying serious attention to this debate, as evidenced by the establishment by DG Employment, Social Affairs and Equal Opportunities of an expert group on Social Investment for Growth and Cohesion in autumn 2012 as input to a major initiative envisaged in the area of social policies.
“Social investment” may be viewed in a number of distinct ways, as Nolan (2013) discusses: as a paradigm and strategy for social policies and spending, as a conceptual base and analytical framework, and/or as a platform for political engagement in both a narrow and broad sense. Whether social investment can credibly be presented as the paradigm most likely to underpin economic growth or employment is open to debate and merits further research, even if—as Nolan (2013) argues—the distinction between social “investment” and other social spending is not particularly robust, conceptually and empirically. Highlighting that distinction may not in any case be the most useful and productive way to frame the debate about the future of social spending, where concentration on a narrow economic argument runs the risk of obscuring normative choices and the broader case for social spending.
Finally, it is important to note that an economic crisis of the depth and nature of the one that began in 2007—2008 may also have major implications for intergenerational equity, especially if it continues to be the case that the elderly are relatively well- cushioned from its effects compared to younger people; sustained high unemployment in particular may well result in long-term “scarring” of those affected, with the risk that their disadvantage is transmitted to the next generation.
23.5.