TECHNOLOGY, ADOPTION AND USES
Since its inception during the 1960s the Internet has developed into an indispensable communications infrastructure. Within a few decades, it evolved from a multi-purpose to a general purpose network that can serve a broad range of uses (Bresnahan and Trajtenberg, 1995).
During this expansion, and especially during the past two decades of accelerated growth into a mass market technology - sparked by several critical innovations, including the World Wide Web, user-friendly browsers, and increasing connectivity since the early 1990s - the Internet has been transformed by the co-evolution of technological, political, social and economic forces interacting in mutually reinforcing ways (Greenstein, 2015).The development of the Internet from a network connecting a few computing centers to a global network carrying massive amounts of data was facilitated by continuous technological change in component technologies, including semiconductors, fixed and wireless networking technologies, and computing. Jointly these developments have resulted in a rapid decline of the costs of transporting, processing and storing digitized information and the ability to pack increasing computing power into smaller and mobile devices. Digitization of information flows has contributed to two waves of convergence, first between computing and telecommunications (‘telematics’; see Nora and Minc, 1978) and subsequently between telematics and media (‘mediamatics’; see Latzer, 1998, 2013). In parallel to the resulting integration or fusion of formerly separate communications activities, the sector has differentiated and diversified, even if information increasingly flows over an integrated network infrastructure. As traffic migrates to next-generation networks (NGNs) the legacy specialized voice, data, audio, and video networks are gradually being replaced and retired.2
The type and quality of Internet access and use show strong differentiations.
National Internet patterns reveal considerable access (first-level) and usage (second-level) divides related to differences in socio-demographic factors like age, income, education level, race and ethnicity, as well as urban-rural inequalities (Buchi et al., 2015; Ragnedda and Muschert, 2015; Robinson et al., 2015). Because these dimensions interact with public policy decisions and other factors, considerable variations exist within and across nations. Consequently, any comparison of national performance metrics needs to take the specific contexts into account, especially when drawing lessons for policy and management.Fixed and wireless access networks have been continuously upgraded throughout their history but performance has increased exponentially since the 1980s, supporting ever higher download and upload speeds. Figure 1.1 shows (using a log scale) that the maximum capacity of access networks using the telephone network grew steadily from 9.6 Kbps in a typical dial-up link in 1988 to 1 Gbps in 2015 using advanced technologies such as G.fast. Similarly, mobile access networks could support 14.4 Kbps in the late 1980s but by 2015 maximum download speeds of up to 1 Gbps using LTE-A (long-term evolution-advanced) were achievable. Cable networks were initially designed for one-way delivery of video signals and therefore have historically provided broadband capacity. They continue to have a distinct lead over upgraded legacy telephone networks and mobile wireless networks, with download capacities that increased from the widespread 42.88 Mbps in 1996 to 10 Gbps by 2013. Even higher bandwidths can be provided by active and passive fiber optical networks (PONs), although they require considerable new investment. While the maximum download capacity of different platforms has become comparable, important differences between these technologies remain. For example, mobile access networks and cable networks are shared, dividing the available capacity among multiple users.
Optimal, cost-minimizing network configurations will most likely include multiple technologies, for example, wireless at the edges and fiber for high-volume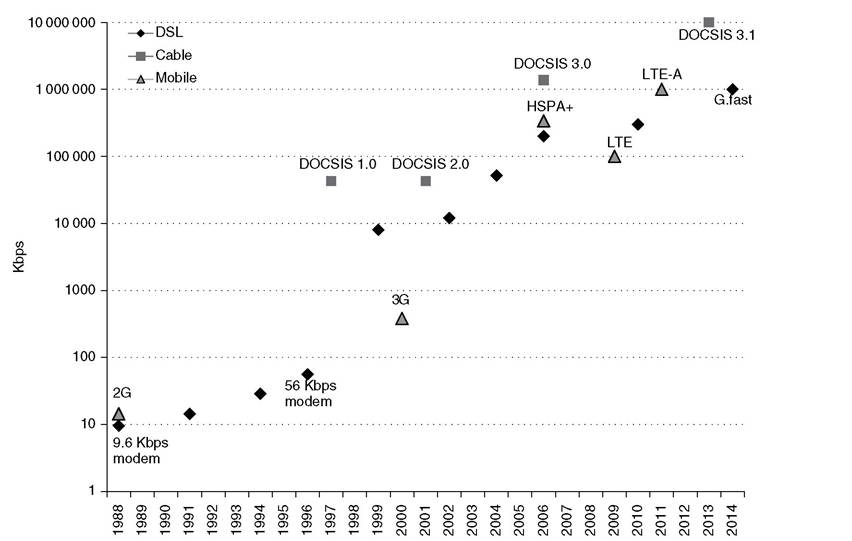
Note: ADSL = asymmetric digital subscriber line; DOCSIS = data over cable service interface specification; DSL = digital subscriber loop/line; HSPA = high-speed packet access; LTE-A = long-term evolution- advanced; VDSL = very high bit rate digital subscriber line.
Source: Own research.
Figure 1.1 Download capacity for DSL, cable, and mobile access platforms, 1988-2014
routes. With the continued migration to all-IP technology, specific network transportation services will increasingly be software-defined so that they can be configured flexibly.
These performance increases and the associated price decreases have accelerated the diffusion of Internet access since the 1990s although considerable regional differences remain (Figure 1.2). The introduction of smartphones, essentially mobile computing devices, has boosted wireless and mobile broadband3 Internet use on a global scale. By 2015, there were 47.2 mobile broadband subscriptions compared to 10.8 fixed subscriptions per 100 inhabitants worldwide (ITU, 2015). A growing body of research takes advantage of this variation to better understand the drivers and impediments of Internet adoption and use. Although several factors, such as the intensity of competition, income and Internet literacy, are frequently identified as key drivers of Internet adoption, there is considerable variation between countries even within comparable income groups (Cambini and Jiang, 2009; Gruber and Koutroumpis, 2013; Bauer et al., 2014; Briglauer, 2014). Figures 1.3 and 1.4 show the variation in fixed and mobile broadband adoption in the OECD member states. At the end of 2014, fixed broadband adoption rates varied
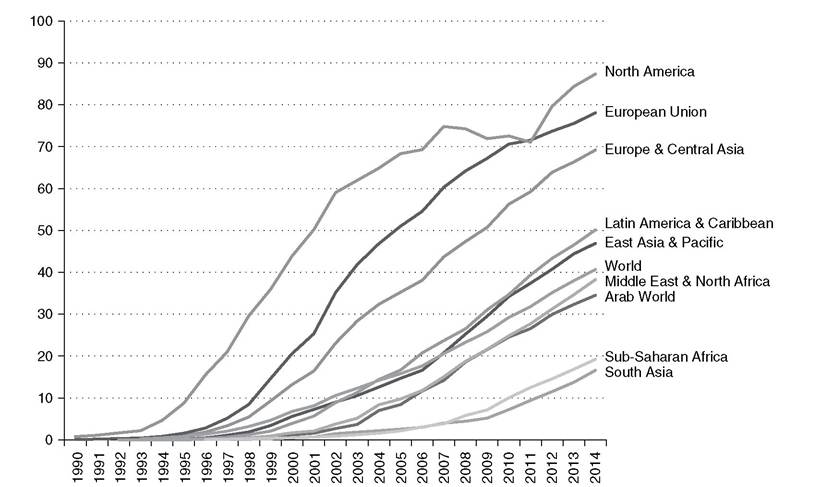
Source: The World Bank, World Development Indicators, accessed 18 August 2015 at http://data.
worldbank.org/indicator/IT.NET.USER.P2.Figure 1.2 Internet users per 100 inhabitants, 1990-2014
from 10.7 percent in Mexico to 48.9 percent in Switzerland. Mobile subscriptions, which in contrast to fixed are typically bought on an individual and not household basis, varied from 34.4 percent in Hungary to 138 percent in Finland. More recent research has generated evidence that technological, economic, socio-demographic and policy factors work as constellations and that several combinations exist that may result in similar outcomes if they are appropriate to the specific national context (Groenewegen et al., 2009; Kunneke et al., 2010).
This diversity of network access platforms is also visible in the quality of the Internet infrastructure. Applications and services are becoming more differentiated with heterogeneous bandwidth and quality needs. At the same time, network access platforms are increasingly capable of supporting high bandwidth and different service qualities, which can be software defined and software configured. One important attribute of network quality is download speed, but other characteristics such as jitter and latency also matter for certain types of applications. Figure 1.5 provides a snapshot of actually measured download speeds in OECD countries. As measurements can be taken at multiple points in the network and using different metrics, numbers generated by different providers vary. Download speeds measured by Ookla are higher than data from Google M-Labs and Akamai. The latter two are fairly consistent, as is the pattern across countries.
Enabled by more bandwidth and more widely available connectivity, the range of network uses has changed significantly over time. During recent years, real-time
Johannes M. Bauer and Michael Latzer - 9780857939845
Downloaded from EIgarOnIine at 04/05/2017 01:09:57AM via Hong kong University of Science and Technology
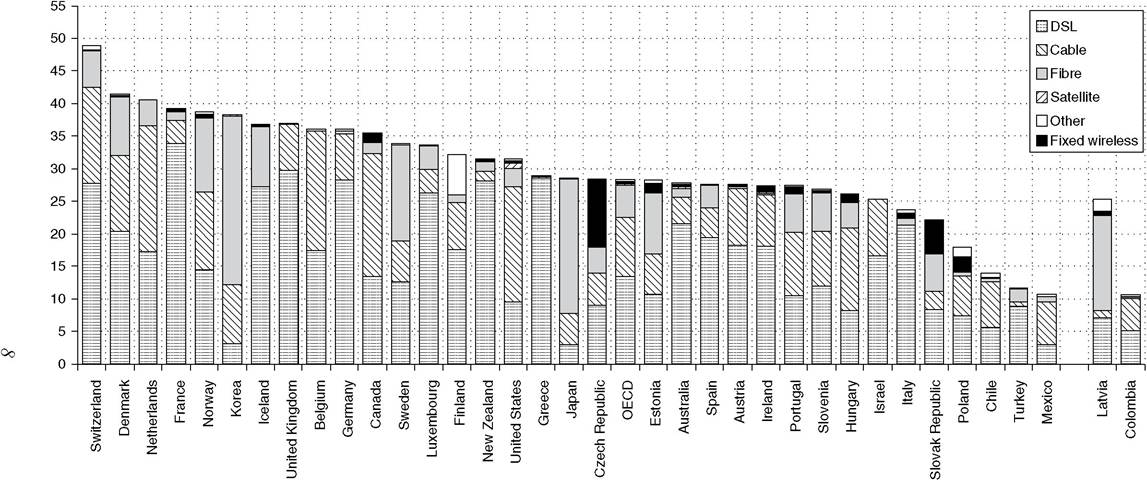
Notes: The OECD adjusted its definitions of fixed and mobile broadband by transferring the categories Satellite and Fixed Wireless from Mobile to Fixed Broadband.
Fiber subscriptions data includes FTTH, FTTP and FTTB and excludes FTTC. Germany: DSE includes VDSL (FTTC); Cable excludes cable infrastructure based on FTTB/FTTH; FTTB/FTTH includes fibre lines provided by cable operators. Mexico: Data for 2014 are preliminary. Mexico is currently reviewing the Fixed broadband data in relation to the implementation of the methodology. Israel, Switzerland and United States: Data for 2014 are estimates; United Kingdom: DSL includes FTTH, FTTP, FTTB and FTTC as the breakdown between these technologies is not available yet; Colombia and Latvia are in the process of accession to the OECD.Sources: OECD, Broadband Portal, accessed 18 August 2015 at www.oecd.org/sti/broadband/oecdbroadbandportal.htm. Information on data for Israel: http:// oe.cd/israel-di sclaimer.
Figure 1.3 Fixed broadband subscriptions per 100 inhabitants in the OECD, by technology (December 2014)
Johannes M. Bauer and Michael Latzer - 9780857939845
Downloaded from EIgarOnIine at 04/05/2017 01:09:57AM via Hong kong University of Science and Technology
150
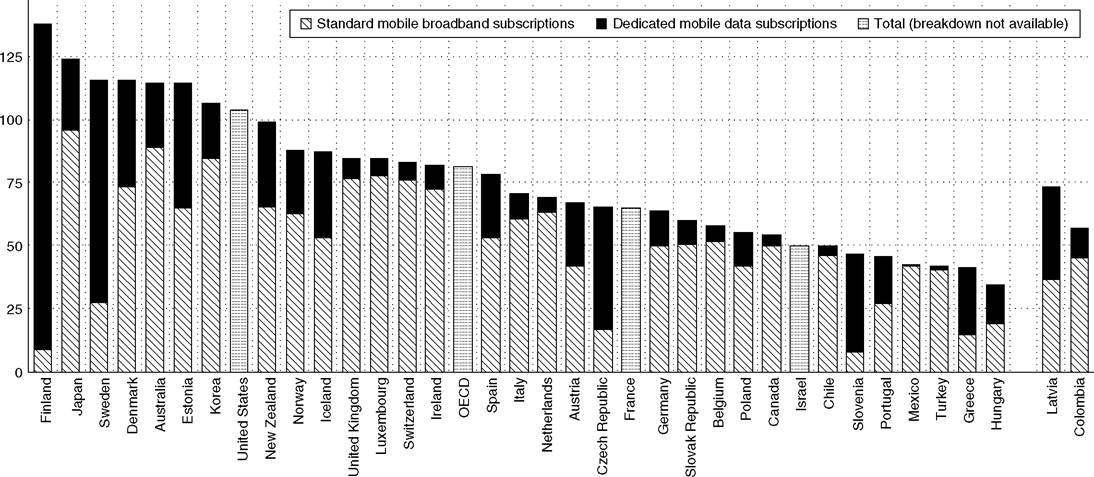
Note: The OECD adjusted its definitions of fixed and mobile broadband by transferring the categories Satellite and Fixed Wireless from Mobile to Fixed Broadband. Mexico: Data for 2014 are preliminary; Israel, Switzerland and United States: Data for 2014 are estimates; Colombia and Latvia are in the process of accession to the OECD.
Sources: OECD, Broadband Portal, accessed 18 August 2015 at www.oecd.org/sti/broadband/oecdbroadbandportal.htm. Information on data for Israel: http:// oe.cd/israel-disclaimer.
Figure 1.4 Mobile broadband subscriptions per 100 inhabitants in the OECD, by technology (December 2014)
Johannes M. Bauer and Michael Latzer - 9780857939845
Downloaded from EIgarOnIine at 04/05/2017 01:09:57AM via Hong kong University of Science and Technology
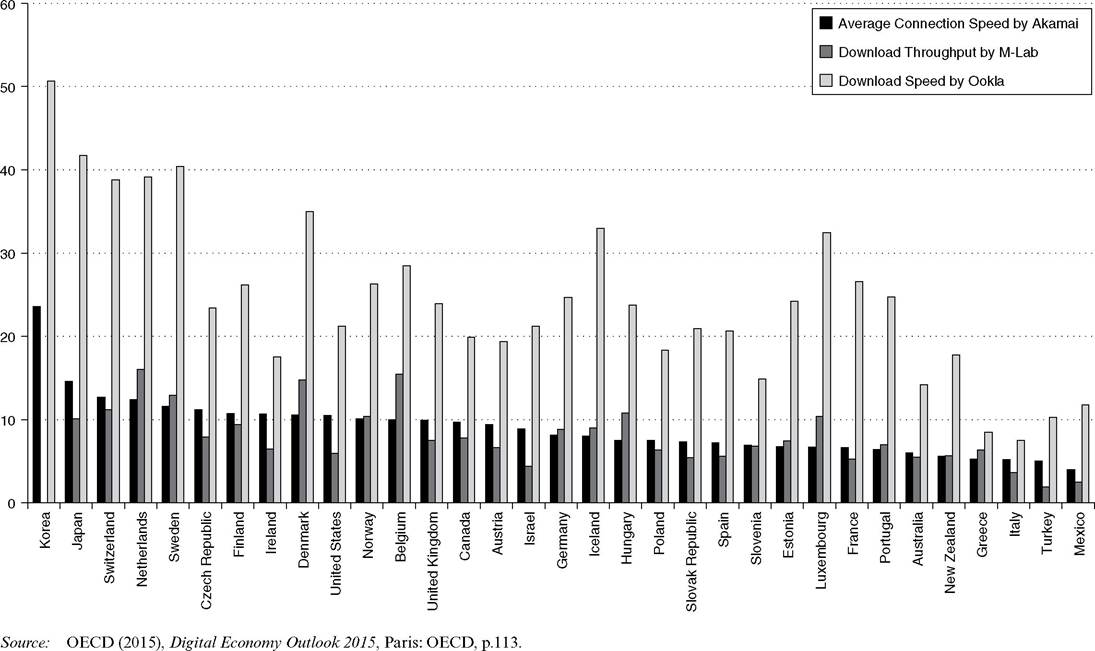
Figure 1.5 Alternative measures of actual download speeds (Mbit/s, 1Q2O14)
entertainment (e.g., video streaming, online gaming) has been growing rapidly.
In North America, its share on fixed networks during peak periods expanded from 29.5 percent of total traffic in 2009 to 64.5 percent in 2015 (Sandvine, 2011, 2015). During the same period, peer-to-peer (P2P) traffic, which had been the third largest traffic category in 2009, declined from 15.1 percent to 5.4 percent, falling out of the top five uses. Web browsing experienced an even more dramatic decline from 38.7 percent to 7.2 percent of total traffic. On the other hand, social networking, which made up only a miniscule share of total network traffic in 2009, grew to 4.6 percent of total traffic by 2015. On mobile networks the share of real-time entertainment increased from 30.8 percent in 2011 to 41.9 percent in 2015. In the same time period, social networking traffic increased from 20 percent to 22.5 percent but web browsing declined from 27.3 percent to 13.7 percent (Sandvine, 2011, 2015).Near ubiquitous Internet access in many parts of the world has allowed migrating processing and storage of information from local machines to servers on the network (the ‘cloud’) and made it possible to develop innovative new information architectures. The Internet’s unique characteristics, including flexibility, plasticity, and scalability, have not only changed the technological basis of communications but have also had wide repercussions on all work and private activities relying on it. These features, combined with the ease of imitation in some areas (e.g., apps), have greatly intensified the competitive pressure in the digital economy. As many Internet-based innovations are software based or have a strong software component, the technology of innovating in the digital economy has also changed, allowing continuous experimentation via the combination and recombination of features, real-time feedback, and the rapid upscaling of successful solutions (Brynjolfsson and McAfee, 2014). Many of these effects seem to be contingent on a threshold level of adoption. Roller and Waverman (2001) found evidence that the productivity and growth effects of telecommunication networks were particularly strong in countries where a critical mass of connectivity had been reached. Koutroumpis (2009) found similar critical mass effects for broadband, although these were achieved at a much lower adoption rate.
These technological transformations have changed the economics of the Internet and have had far-reaching economic consequences for private and public sector users. Through the mid-1990s, the Internet was largely funded by the public sector. This allowed investments and technological decisions to be made with a broader public interest perspective in mind. Once infrastructure investment decisions were predominantly made by commercial investors, this societal calculus was superseded by private profitability considerations. An overarching assumption of stakeholders was that in the competitive Internet market coordination would assure that these decisions were aligned with the public interest. There is considerable evidence in support of this premise but, like other information and communication technologies (ICTs), the Internet has a unique cost structure that interacts with the dynamics of decentralized decision-making and influences the outcomes of unfettered market coordination.
With the exception of dedicated local access links, the costs of networks are shared. High upfront investment costs go hand in hand with very low incremental costs of transporting, processing and storing information. To recoup investment costs, network operators need to find ways to significantly mark up incremental costs. Pursuing such a strategy is complicated by the fact that the implementation of Internet technology has contributed to a commodification of network services. At the same time, value generation moved to the higher layers of the stack where applications and services are configured. Among the possible responses of private companies to these economic structures are horizontal and vertical integration as well as attempts to introduce differentiated network services, all major trends visible in the Internet today. The chapters in this Handbook address these challenges in more detail.
1.3