THE DEVELOPING WORLD: CHARACTERIZATION AND DATA
In this section we briefly characterize the economies of the developing world and review the sources of data to measure and analyze income poverty and inequality.
9.2.1 Developing Countries
The division between developed and developing countries is a helpful simplification that can be done in different arbitrary ways.
In this chapter we follow the World Bank’s main criterion based on gross national income (GNI) per capita: Developing countries are those with per capita GNI below a certain nominal threshold (US$ 12,276 in 2011). These nations are usually classified into six geographical regions: East Asia and Pacific (EAP), Eastern Europe and Central Asia (ECA), Latin America and the Caribbean (LAC), Middle East and North Africa (MENA), South Asia (SA), and sub-Saharan Africa (SSA). The Appendix includes a list of all the developing countries in each region with their populations.[450] The developing countries cover almost 75% of the total land area in the world and represent 85% of the total population. Table 9.1 summarizes some basic demographic and economic statistics.According to these indicators Eastern Europe and Central Asia is the most developed region in the group: per capita GNI is almost twice the mean for the developing world, and the Human Development Index (HDI) is significantly higher. Latin American and the Caribbean ranks second, and Middle East and North Africa third. Although economic growth in Asia has been remarkable in the last decades, per capita GNI and other development indicators are on average still below the mean of the developing world.
Table 9.1 Population, GNI per capita and Human Development Index, 2010 Develooino countries by reαion
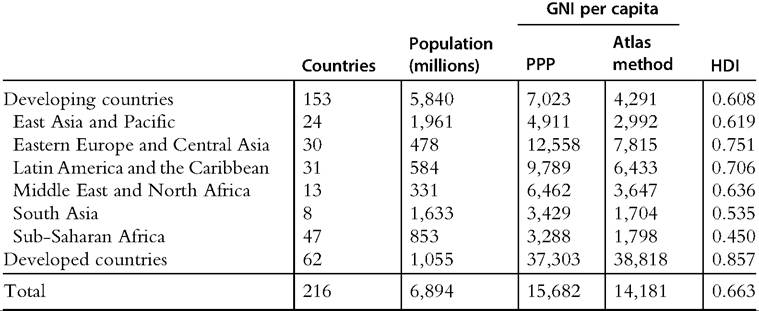
Source: Population is taken from the United Nations Demographic Yearbook.
Gross National Income (GNI) per capita in international dollars adjusted for purchasing power parity (PPP), and in current US$ (Atlas method) are taken from World Development Indicators. The HumanDevelopment Index (HDI) is from the UNDP HumanDevelopment Report. GNI and HDI are unweighted averages across countries.South Asia is significantly less developed than East Asia and the Pacific. Sub-Saharan Africa is the poorest and least developed region of the world. The mean of the national per capita GNIs in that region is less than 50% of the developing world mean and less than 10% of the mean of the industrialized economies.
9.2.2 Data Sources
National household surveys are the main source of information for distributive analysis. Because one of the central goals of these surveys is measuring living standards, they typically include questions to construct a monetary proxy for well-being: income and/or expenditures on consumption goods. Although some developing countries started to implement national household surveys after World War II, it is only recently that governments engaged in programs of regularly collecting information through household surveys, often with the help of some international organization. Distributive statistics for the developing world are rare before the 1970s and reasonably robust only from the 1990s on. There has been a remarkable increase in the availability of national household surveys over the last decades. A chapter like this one, that includes a broad assessment of income inequality and poverty in developing countries, could hardly have been written two decades ago and is a sign of the huge progress made on data collection. However, as we discuss later, data limitations are still stringent and allow only a still blurred picture of inequality and poverty.
The databases for international distributive analysis can be classified into two groups: those that produce statistics with microdata from surveys or administrative records, and those that collect, organize, and report summary measures.
The former group includes the World Bank’s PovcalNet, the Luxembourg Income Study, the World Income Distribution database, the World Top Incomes Database, and some regional initiatives. The second one includes the seminal work by Deininger and Squire (1996) and its follow-up—the WIDER’s World Income Inequality Database, the All the Ginis database, and some other projects.The main source of information for poverty and inequality analysis at a large international scale in the developing world is the World Bank’s PovcalNet, a compilation of distributive data built up from national household surveys, generally fielded by national statistical offices. PovcalNet, used for the World Bank’s World Development Indicators, includes statistics constructed mostly from household survey microdata and in some few countries from grouped tabulations. At the moment of writing this database includes more than 850 surveys from almost 130 countries, representing more than 90% of the population of the developing world, spanning the period 1979—2011. The website of PovcalNet provides public access to data to generate estimates for selected countries and alternative poverty lines from grouped data.[451] Martin Ravallion and Shaohua Chen, the developers of PovcalNet, have produced several papers exploiting the data set (Chen and Ravallion, 2001, 2010, 2012; Ravallion and Chen, 1997). This project has been increasingly influential in shaping the assessment of inequality, and in particular poverty, in the developing world by researchers and policy practitioners. It is, for instance, the source used to monitor the poverty-reduction goal of the MDGs. This chapter draws heavily on statistics computed in the PovcalNet project.
Some regional initiatives aimed at estimating social statistics from harmonized household survey microdata are useful to study distributive issues in specific geographic areas and as sources of information for world databases. Forinstance, the Socioeconomic Database for Latin America and the Caribbean (SEDLAC), jointly developed by CEDLAS at Univer- sidad Nacional de La Plata (Argentina) and the World Bank’s LAC poverty unit, includes distributive and labor statistics for LAC constructed using consistent criteria across countries and years.
BADEINSO, developed by the United Nations' ECLAC, is also a large and good-quality database on social variables in LAC. In Eastern and Central Europe the World Bank ECA database includes statistics for 28 countries since 1990 computed from direct access to household surveys. The Household Expenditure and Income Data for Transitional Economies developed by Branko Milanovic at the World Bank is the predecessor of that database. Milanovic has also built the World Income Distribution (WYD) database, which includes data for five benchmark years (1988, 1993, 1998, 2002, and 2005) for 146 countries, 75% obtained from direct access to household surveys. The data set has been used in several studies to compute global inequality (Milanovic, 2002, 2005, 2012). The Luxembourg Income Study (LIS), described in Chapter 8 of this volume, includes distributive information computed from household survey microdata for developed countries. LIS also reports statistics for several transitional economies in Eastern Europe and recently has added some developing countries in Latin America (Brazil, Colombia, Guatemala, Mexico, Peru, and Uruguay).The growth in the availability of distributive statistics stimulated efforts to gather and organize them. Deininger and Squire (1996) put together a large data set of quintile shares and Gini coefficients for most countries since World War II taken from different studies and national reports.[452] This panel database, which greatly promoted the empirical study of the links between inequality and other economic variables, was updated and extended by the UNU/WIDER-UNDP World Income Inequality Database (WIID; WIDER, 2008).[453] The WIID database includes Gini coefficients, quintile and decile shares, and the income shares of the top 5% and bottom 5%. The information is drawn from very different sources, which raises comparability concerns.[454] To provide guidance in the use of the database, ratings are given to the observations, based on the survey quality, the coverage, and the quality of the information provided by the original source.
The SWIID is an effort to identify reasonably comparable information in WIID (Solt, 2009).[455]The All the Ginis database, assembled also by Branko Milanovic, is a compilation and adaptation of Gini coefficients retrieved from five data sets: LIS, SEDLAC, WYD, the World Bank ECA database, and WIID. Besides gathering all the information in a single file, the All the Ginis database is useful as it provides information on the welfare concept and recipient unit to which the reported Gini refers, facilitating the comparisons.
The Chartbook of Economic Inequality, assembled by Atkinson and Morelli (2012), presents a summary of evidence about changes in economic inequality (income/consump- tion, earnings, and wealth) in the period from 1911 to 2010 for 25 countries. The information drawn from household surveys for the seven countries in the developing world included in the database (Argentina, Brazil, India, Indonesia, Malaysia, Mauritius, and South Africa) starts in the 1950s.
All the data sets mentioned earlier are based on data from national household surveys.[456] Even when they are the best available source of information for distributive analysis, household surveys are plagued with problems for international comparative studies because, among other reasons, the questionnaires and the procedures to compute income/consumption variables differ among countries and frequently also within a country over time.[457] Some surveys inquire about income and others about consumption, some capture net income and some gross income, in some cases variables are reported on a weekly basis and in others on a monthly basis, items as the imputed rent for owner-occupied housing are included in some surveys and ignored in others.[458] Even in those projects that make explicit efforts to reduce these differences, comparability issues persist, as problems rooted in differences in questionnaires are difficult to be completely overcome.
These limitations are well recognized in the literature. Chen and Ravallion (2012) state that.. there are problems that we cannot deal with. For example, it is known that differences in survey methods (such as questionnaire design) can create non-negligible differences in the estimates obtained for consumption or income.” In a survey of global income inequality, Anand and Segal (2008) share those concerns.There are some alternatives to reduce the comparability problems, although they all come at a price. Gallup conducts a survey in nearly all nations in the world with almost exactly the same questionnaire. The Gallup World Poll is particularly rich in self-reported measures of quality of life, opinions, and perceptions, but it also includes basic questions on demographics, education, and employment, and a question on household income. In principle, the Gallup World Poll allows a distributive analysis in nearly all the countries in the world based on the same income question. The downside is that measurement errors may be very large when reported income is based only on one question and with sample sizes of just around 1000 observations per country.[459]
The Estimated Household Income Inequality (EHII) data set produced by the University of Texas Inequality Project is based on UTIP-UNIDO, a global data set that calculates industrial pay-inequality measures for 156 countries from 1963 to 2003, using the between-groups component of a Theil index, measured across industrial categories in the manufacturing sector (Galbraith and Kum, 2005). Specifically, EHII consists on estimates of gross household income inequality computed from an OLS regression between the Deininger and Squire (DS) inequality measures and the UTIP-UNIDO manufacturing pay-inequality measures.[460] Although in principle the use of industrial pay information could lend some homogeneity into the comparisons, it should be stressed that because the underlying data do not refer to individuals and then have no distributive content, the methodology could be seen just as an extension of DS.
9.3.