THE LONG-RUN EVOLUTION OF WEALTH-INCOME RATIOS
15.2.1 Concepts, Data Sources, and Methods
15.2.1.1 Country Balance Sheets
Prior to World War I, there was a vibrant tradition of national wealth accounting: economists, statisticians, and social arithmeticians were much more interested in computing the stock of national wealth than the flows of national income and output.
The first national balance sheets were established in the late seventeenth and early eighteenth centuries by Petty (1664) and King (1696) in the United Kingdom, and Boisguillebert (1695) and Vauban (1707) in France. National wealth estimates then became plentiful in the nineteenth and early twentieth century, with the work of Colquhoun (1815), Giffen (1889), and Bowley (1920) in the United Kingdom, de Foville (1893) and Colson (1903) in France, Helfferich (1913) in Germany, King (1915) in the United States, and dozens of other economists.The focus on wealth, however, largely disappeared in the interwar. The shock of World War I, the Great Depression, and the coming of Keynesian economics led to attention being switched from stocks to flows, with balance sheets being neglected. The first systematic attempt to collect historical balance sheets is due to Goldsmith (1985, 1991). Building upon recent progress made in the measurement of wealth, and pushing forward Goldsmith’s pioneering attempt, Piketty and Zucman (2014) construct aggregate wealth and income series for the top eight rich economies. Other recent papers that look at specific countries include Atkinson (2013) for the United Kingdom and Ohlsson et al. (2013) for Sweden. In this section, we rely on the data collected by Piketty and Zucman (2014)—and closely follow the discussion therein—to present the long-run evolution of wealth-income ratios in the main developed economies.
In determining what is to be counted as wealth, we follow the U.N. System of NationalAccounts (SNA).
Forthe 1970-2010 period, the data come from official national accounts that comply with the latest international guidelines (SNA, 1993, 2008). For the previous periods, Piketty and Zucman (2014) draw on the vast national wealth accounting tradition to construct homogenous income and wealth series that use the same concepts and definitions as in the most recent official accounts. The historical data themselves were established by a large number ofscholars and statistical administrations using a wide variety ofsources, including land, housing and wealth censuses, financial surveys, corporate book accounts, and the like. Although historical balance sheets are far from perfect, their methods are well documented and they are usually internally consistent. It was also somewhat easier to estimate national wealth around 1900-1910 than it is today: the structure of property was simpler, with less financial intermediation and cross-border positions.[24]15.2.1.2 Concepts and Definitions: Wealth Versus Capital
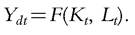
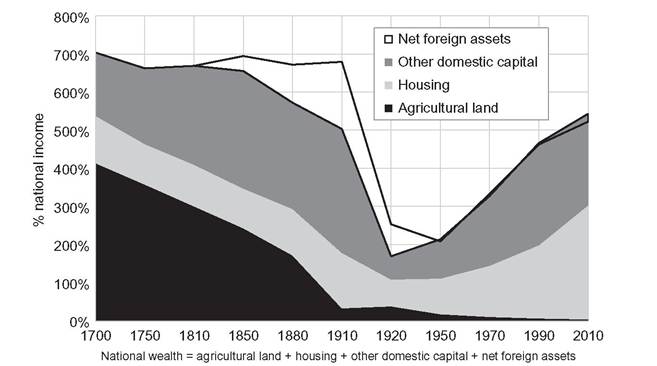
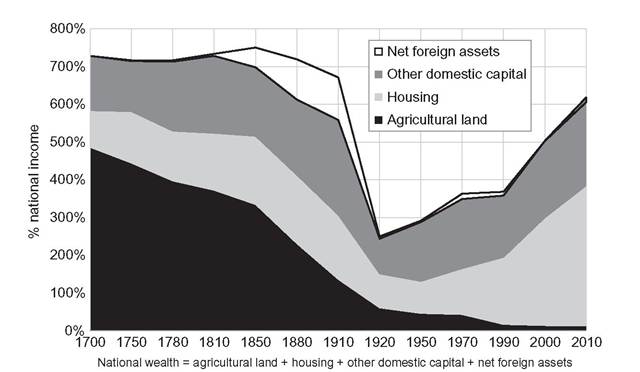
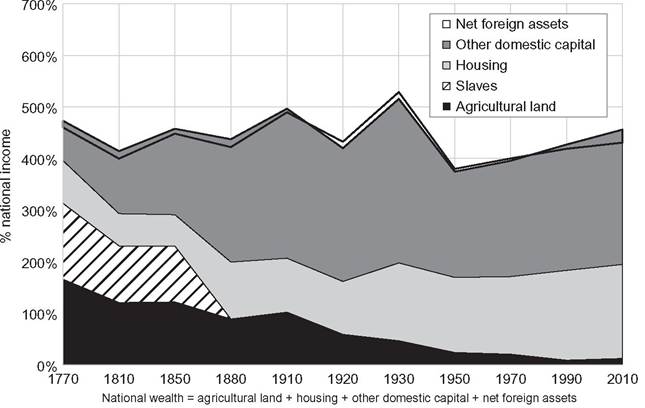
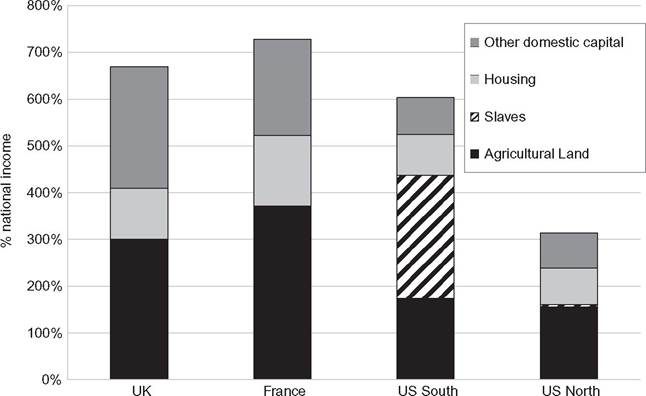
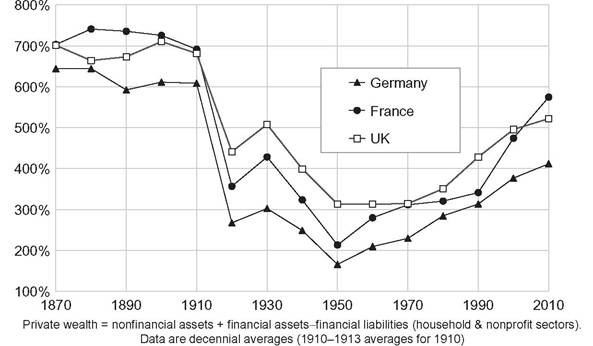
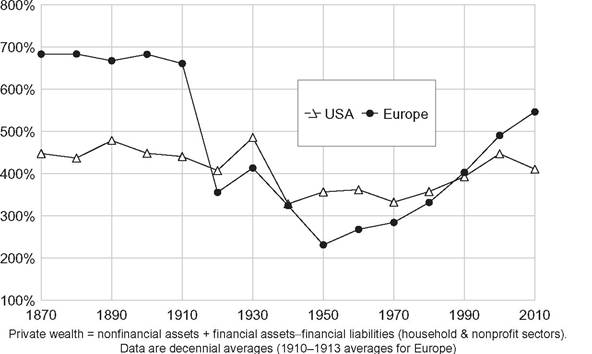
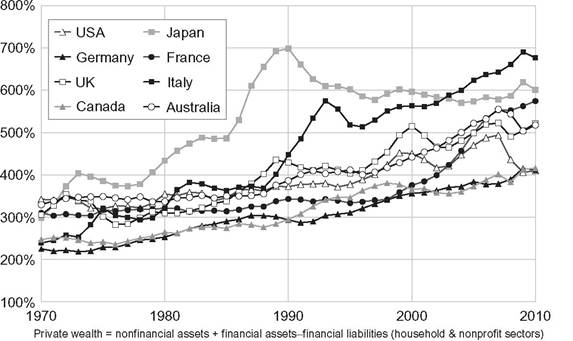
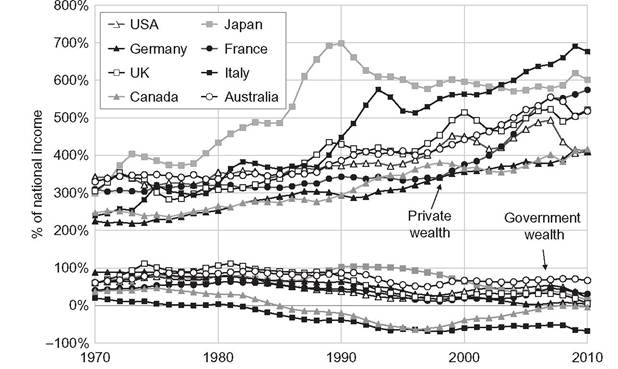
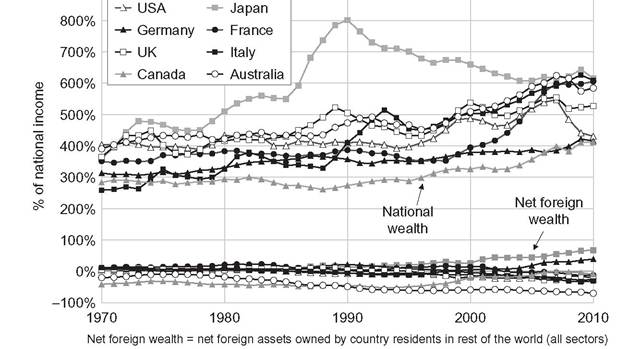
We define private wealth, Wt, as the net wealth (assets minus liabilities) of households.[25] Following SNA guidelines, assets include all the nonfinancial assets—land, buildings, machines, etc.—and financial assets—including life insurance and pensions funds—over which ownership rights can be enforced and that provide economic benefits to their owners. Pay-as-you-go Social Security pension wealth is excluded, just as all other claims on future government expenditures and transfers (such as education expenses for one’s children or health benefits). Durable goods owned by households, such as cars and furniture, are excluded as well.[26] [27] As a general rule, all assets and liabilities are valued at their prevailing market prices. Corporations are included in private wealth through the market value of equities and corporate bonds. Unquoted shares are typically valued on the basis of observed market prices for comparable, publicly traded companies. Similarly, public (or government) wealth, Wgt, is the net wealth of public administrations and government agencies. In available balance sheets, public nonfinancial assets such as administrative buildings, schools, and hospitals are valued by cumulating past investment flows and upgrading them using observed real estate prices. Market-value national wealth, Wnt, is the sum of private and public wealth: and national wealth can also be decomposed into domestic capital and net foreign assets: In turn, domestic capital Kt can be written as the sum of agricultural land, housing, and other domestic capital (including the market value of corporations, and the value of other nonfinancial assets held by the private and public sectors, net of their liabilities). Regarding income, the definitions and notations are standard. Note that we always use net-of-depreciation income and output concepts. National income Yt is the sum of net domestic output and net foreign income be thought of as coming from some aggregate production function that uses domestic capital and labor as inputs: One might prefer to think about output as deriving from a two-sector production process (housing and nonhousing sectors), or more generally from n sectors. In the real world, the capital stock Kt comprises thousands of various assets valued at different prices (just like output Ydt is defined as the sum of thousands of goods and services valued at different prices). We find it more natural, however, to start with a one-sector formulation. Another choice that needs to be discussed is the focus on market values for national wealth and capital. We see market values as a useful and well-defined starting point. But one might prefer to look at book values, for example, for short-run growth accounting exercises. Book values exceed market values when Tobin’s Q is less than 1, and conversely when Tobin’s Q is larger than 1. In the long run, however, the choice of book versus market value does not much affect the analysis (see Piketty and Zucman, 2014, for a detailed discussion). We are interested in the evolution of the private wealth-national income ratio βt = Wt∕Yt and of the national wealth-national income ratio βnt = Wnt∕Yt. In a closed economy, and more generally in an open economy with a zero net foreign position, the national wealth-national income ratio βnt is the same as the domestic capital-output ratio βkt = Kt∕Ydtβ Ifpublic wealth is equal to zero, then both ratios are also equal to the private wealth-national income ratio βt=βnt=βkt. At the global level, the world wealthincome ratio is always equal to the world capital-output ratio. 15.2.2 The Very Long-Run: Britain and France, 1700-2010 Figures 15.1 and 15.2 present the very long-run evidence available for Britain and France regarding the national wealth-national income ratio βnt. Net public wealth—either positive or negative—is usually a relatively small fraction of national wealth, so that the evolution of βnt mostly reflects the evolution of the private wealth-national income ratio βt (more on this below).[28] [29] Figure 15.1 The changing level and nature of national wealth: United Kingdom 1700-2010. Figure 15.2 The changing level and nature of national wealth: France 1700-2010. The evolutions are remarkably similar in the two countries. First, the wealth-income ratio has followed a spectacular U-shaped pattern. Aggregate wealth was worth about 6-7 years of national income during the eighteenth to nineteenth centuries on both sides of the channel, up until the eve of World War I. Raw data sources available for these two centuries are not sufficiently precise to make fine comparisons between the two countries or over time, but the orders of magnitude appear to be reliable and roughly stable (they come from a large number of independent estimates). Aggregate wealth then collapsed to as little as 2—3 years of national income in the aftermath of the two World Wars. Since the 1950s, there has been a gradual recovery in both countries. Aggregate wealth is back to about 5-6 years of national income in the 2000s to 2010s, just a bit below the pre-World War I level. The other important finding that emerges from Figures 15.1 and 15.2 is that the composition of national wealth has changed in similar ways in both countries. Agricultural land, which made the majority of national capital in the eighteenth century, has been gradually replaced by real estate and other domestic capital, which is for the most part business capital (i.e., structures and equipment used by private firms). The nature of wealth has changed entirely reflecting a dramatic change in the structure of economic activity, and yet the total value of wealth is more or less the same as what it used to be before the Industrial Revolution. Net foreign assets also made a large part of national capital in the late nineteenth century and on the eve of World War I: as much as 2 years of national capital in the case of Britain and over a year in the case of France. Net foreign-asset positions were brought back to zero in both countries following World War I and II shocks (including the loss of the colonial empires). 15.2.2 Old Europe Versus the New World It is interesting to contrast the case of Old Europe—as illustrated by Britain and France— with that of the United States. As Figure 15.3 shows, the aggregate value of wealth in the eighteenth to nineteenth centuries was markedly smaller in the New World than in Europe. At the time of the Declaration of Independence and in the early nineteenth century, national wealth in the United States was barely equal to 3-4 years of national income, about half that of Britain or France. Although available estimates are fragile, the order of magnitude again Figure 15.3 The changing level and nature of national wealth: United States 1770-2010. appears to be robust. In Section 15.5, we will attempt to account for this interesting contrast. At this stage, we simply note that there are two obvious—and potentially complementary—factors that can play a role: first, there had been less time to save and accumulate wealth in the New World than in the Old World; second, there was so much land in the New World that it was almost worthless (its market value per acre was much less than in Europe). The gap between the United States and Europe gradually reduces over the course of the nineteenth century, but still remains substantial. Around 1900—1910, national wealth is about 5 years of national income in the United States (see Figure 15.3) versus about 7 years in Britain and France. During the twentieth century, the U.S. wealth-income ratio also follows a U-shaped pattern, but less marked than in Europe. National wealth falls less sharply in the United States than in Europe following World War shocks, which seems rather intuitive. Interestingly, European wealth-income ratios have again surpassed U.S. ratios in the late twentieth and early twenty-first centuries. This brief overview of wealth in the New World and Europe would be rather incomplete if we did not mention the issue of slavery. As one can see from Figure 15.4, the aggregate market value of slaves was fairly substantial in the United States until 1865: about 1-1.5 years of national income according to the best available historical sources. There were few slaves in Northern states, but in the South the value of the slave stock was so large that it approximately compensated—from the viewpoint of slave owners— the lower value of land as compared to the Old World (see Figure 15.5). It is rather dubious, however, to include the market value of slaves into national capital. Slavery can be viewed as the most extreme form of debt: it should be counted as an Figure 15.4 The changing level and nature of wealth: United States 1770-2010 (including slaves). Figure 15.5 National wealth in 1770-1810: Old versus New World. asset for the owners and a liability for the slaves, so that net national wealth should be unaffected. In the extreme case where a tiny elite owns the rest of the population, the total value of slaves—the total value of “human capital”—could be a lot larger than that of nonhuman capital (since the share of human labor in income is typically larger than 50%). Ifthe rate of return r is equalized across all assets, then the aggregate value of human capital—expressed in proportion to national income—will be equal to βh = (1 — a)/r, whereas the value of nonhuman capital will be given by βn = α/r, where α is the capital share and 1 — α the labor share implied by the production technology.[31] So for instance with r = 5%, α = 30%, 1 — α = 70%, the value ofthe human capital stock will be as large as βh = (1 — a)/r = 1400% (14 years of national income), and the value of the nonhuman capital stock will be βn = a/r = 600% (6 years of national income). Outside of slave societies, however, it is unclear whether it makes much sense to compute the market value of human capital and to add it to nonhuman capital. The computations reported on Figures 15.4 and 15.5 illustrate the ambiguous relationship of the New World with wealth, inequality, and property. To some extent, America is the land of opportunity, the place where wealth accumulated in the past does not matter too much. But it is also the place where a new form of wealth and class structure—arguably more extreme and violent than the class structure prevailing in Europe—flourished, whereby part of the population owned another part. Available historical series suggest that the sharp U-shaped pattern for the wealthincome ratio in Britain and France is fairly representative of Europe as a whole. For Germany, the wealth-income ratio was approximately the same as for Britain and France in the late nineteenth and early twentieth centuries, then fell to a very low level in the aftermath of the World Wars, and finally has been rising regularly since the 1950s (see Figure 15.6). Although the German wealth-income ratio is still below that of the United Kingdom and France, the speed of the recovery over the past few decades has been similar.[32] On Figure 15.7, we compare the European wealth-income ratio (obtained as a simple average of Britain, France, Germany, and Italy, the latter being available only for the most recent decades) to the U.S. one. The European wealthincome ratio was substantially above that of the United States until World War I, then fell significantly below in the aftermath of World War II, and surpassed it again in the late twentieth and early twenty-first centuries (see Figure 15.7). Figure 15.6 Private wealth/national income ratios in Europe, 1870-2010. Figure 15.7 Private wealth/national income ratios 1870-2010: Europe versus United States. 15.2.4 The Return of High Wealth-Income Ratios in Rich Countries Turning now to the 1970—2010 period, for which we have annual series covering most rich countries, the rise of wealth-income ratios, particularly private wealth-national income ratios, appears to be a general phenomenon. In the top eight developed economies, private wealth is between 2 and 3.5 years of national income around 1970, and between 4 and 7 years of national income around 2010 (see Figure 15.8). Although there are chaotic short-run fluctuations (reflecting the short-run volatility of asset prices), Figure 15.8 Private wealth/national income ratios, 1970-2010. the long-run trend is clear. TakeJapan. The huge asset price bubble of the late 1980s should not obscure the 1970—2010 rise of the wealth-income ratio, fairly comparable in magnitude to what we observe in Europe. (For instance, the Japanese and Italian patterns are relatively close: both countries go from about 2-3 years of national income in private wealth around 1970 to 6-7 years by 2010.) Although we do not have national wealth estimates for Japan for the late nineteenth and early twentieth centuries, there are reasons to believe that the Japanese wealthincome ratio has also followed a U-shaped evolution in the long run, fairly similar to that observed in Europe over the twentieth century. That is, it seems likely that the wealth— income ratio was relatively high in the early twentieth century, fell to low levels in the aftermath of World War II, and then followed the recovery process that we see in Figure 15.8.14 To some extent, the rise of private wealth-national income ratios in rich countries since the 1970s is related to the decline of public wealth (see Figure 15.9). Public wealth has declined virtually everywhere owing both to the rise of public debt and the privatization of public assets. In some countries, such as Italy, public wealth has become strongly negative. The rise in private wealth, however, is quantitatively much larger than the decline in public wealth. As a result, national wealth—the sum of private and public wealth—has increased substantially, from 250-400% of national income in 1970 to 400-650% in 2010 (see Figure 15.10). In Italy, for instance, net government wealth fell by the equivalent of about 1 year of national income, but net private wealth rose by over The early twentieth century Japanese inheritance tax data reportedby Morigushi and Saez (2008) are consistent with this interpretation. Figure 15.9 Private versus government wealth, 1970-2010. Figure 15.10 National versus foreign wealth, 1970-2010. 4 years of national income, so that national wealth increased by the equivalent of over 3 years of national income. Figure 15.10 also depicts the evolution of net foreign wealth. Net foreign asset positions are generally small compared to national wealth. In other words, the evolution of national wealth-national income ratios mostly reflects the evolution of domestic capitaloutput ratios. There are two caveats, however. First, gross cross-border positions have risen a lot in recent decades, which can generate large portfolio valuation effects at the country level. Second, Japan and Germany have accumulated significant net foreign wealth (with net positions around 40% and 70% of national income, respectively, in 2010). Although these are still much smaller than the positions held by France and Britain on the eve of World War I (around 100% and 200% of national income, respectively), they are becoming relatively large (and were rising fast in the case of Germany in the first half of the 2010s, due to the large German trade surpluses). 15.3.

 Domestic output can