THE LONG-RUN EVOLUTION OF WEALTH CONCENTRATION
15.3.1 Concepts, Data Sources, and Methods
We now turn to the evidence on the long-run evolution of wealth concentration. This question can be studied with different data sources (see Davies and Shorrocks, 1999, for a detailed discussion).
Ideally, one would want to use annual wealth tax declarations for the entire population. Annual wealth taxes, however, often do to exist, and when they do, the data generally do not cover long periods of time.The key source used to study the long-run evolution of wealth inequality has traditionally been inheritance and estate tax declarations.[33] By definition, estates and inheritance returns only provide information about wealth at death. The standard way to use inheritance tax data to study wealth concentration was invented over a century ago. Shortly before World War I, a number of British and French economists developed what is known as the mortality multiplier technique, whereby wealth-at-death is weighted by the inverse of the mortality rate of the given age and wealth group in order to generate estimates for the distribution of wealth among the living.[34] This approach was later followed in the United States by Lampman (1962) and Kopczuk and Saez (2004), who use estate tax data covering the 1916-1956 and 1916-2000 periods, respectively, and in the United Kingdom by Atkinson and Harrison (1978), who exploit inheritance tax data covering the 1922-1976 period.
To measure historical trends in the distribution of wealth, one can also use individual income tax returns and capitalize the dividends, interest, rents, and other forms of capital income declared on such returns. The capitalization technique was pioneered by King (1927), Stewart (1939), Atkinson and Harrison (1978), and Greenwood (1983), who used it to estimate the distribution of wealth in the United Kingdom and in the United States for some years in isolation.
To obtain reliable results, it is critical to have detailed income data, preferably at the micro level, and to carefully reconcile the tax data with household balance sheets, so as to compute the correct capitalization factors. Drawing on the very detailed U.S. income tax data and Flow of Funds balance sheets, Saez and Zucman (2014) use the capitalization technique to estimate the distribution of U.S. wealth annually since 1913.For the recent period, one can also use wealth surveys. Surveys, however, are never available on a long-run basis and raise serious difficulties regarding self-reporting biases, especially at the top of the distribution. Tax sources also raise difficulties at the top, especially for the recent period, given the large rise of offshore wealth (Zucman, 2013). Generally speaking, it is certainly more difficult for the recent period to accurately measure the concentration of wealth than the aggregate value of wealth, and one should be aware of this limitation. One needs to be pragmatic and combine the various available data sources (including the global wealth rankings published by magazines such as Forbes, which we will refer to in Section 15.5).
The historical series that we analyze in this chapter combines works by many different authors (more details below), who mostly relied on estate and inheritance tax data. They all relate to the inequality of wealth among the living.
We focus on simple concentration indicators, such as the share of aggregate wealth going to the top 10% individuals with the highest net wealth and the share going to the top 1%. In every country and historical period for which we have data, the share of aggregate wealth going to the bottom 50% is extremely small (usually less than 5%). So a decline in the top 10% wealth share can for the most part be interpreted as a rise in the share going to the middle 40%. Note also that wealth concentration is usually almost as large within each age group as for the population taken as a whole.[35]
15.3.2 The European Pattern: France, Britain, and Sweden, 1810-2010
15.3.2.1 France
We start with the case of France, the country for which the longest time series is available.
French inheritance tax data is exceptionally good, for one simple reason. As early as 1791, shortly after the abolition of the tax privileges of the aristocracy, the French National Assembly introduced a universal inheritance tax, which has remained in force since then. This inheritance tax was universal because it applied both to bequests and to inter-vivos gifts, at any level of wealth, and for nearly all types of property (both tangible and financial assets). The key characteristic of the tax is that the successors of all decedents with positive wealth, as well as all donees receiving a positive gift, have always been required to file a return, no matter how small the estate was, and no matter whether any tax was ultimately owed.In other countries, available data are less long run and/or less systematic. In the United Kingdom, one has to wait until 1894 for the unification of inheritance taxation (until this date the rules were different for personal and real estate taxes), and until the early 1920s
17
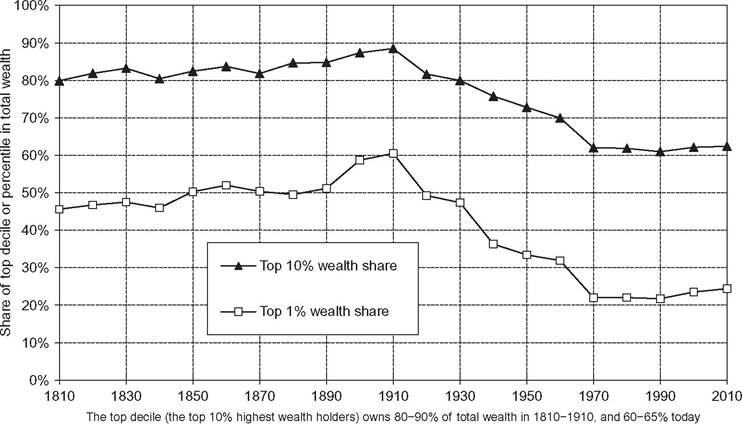
Figure 15.11 Wealth inequality in France, 1810-2010.
for unified statistics to be established by the U.K. tax administration. In the United States, one has to wait until 1916 for the creation of a federal estate tax and the publication of federal statistics on inheritance.
In addition, individual-level inheritance tax declarations have been well preserved in French national archives since the time of the revolution, so that one can use tax registers to collect large representative micro samples. Together with the tabulations by inheritance brackets published by the French tax administration, this allows for a consistent study of wealth inequality over a two-century-long period (see Piketty etal., 2006, 2013).
The main results are summarized on Figures 15.11 and 15.12.[36] First, wealth concentration was very high—and rising—in France during the nineteenth and early twentieth centuries.
There was no decline in wealth concentration prior to World War I, quite the contrary: the trend toward rising wealth concentration did accelerate during the 1870—1913 period. The orders of magnitude are quite striking: in 1913, the top 10% wealth share is about 90%, and the top 1% share alone is around 60%. In Paris, which hosts about 5% of the population but as much as 25% of aggregate wealth, wealth is even more concentrated: more than two-thirds of the population has zero or negligible wealth, and 1% of the population owns 70% of the wealth.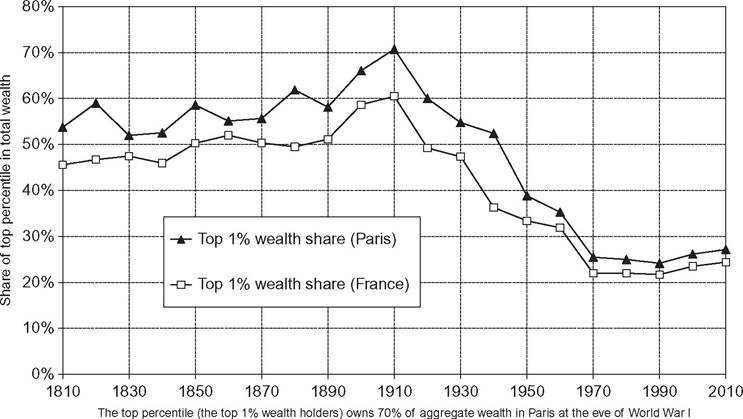
Figure 15.12 Wealth inequality: Paris versus France, 1810-2010.
Looking at Figures 15.11 and 15.12, one naturally wonders whether wealth concentration would have kept increasing without the 1914—1945 shocks. It might have stabilized at a very high level, but it could also have started to decline at some point. In any case, it is clear that the war shocks induced a violent regime change.
The other interesting fact is that wealth concentration has started to increase again in France since the 1970s-1980s—but it is still much lower than on the eve of World War I. According to the most recent data, the top 10% wealth share is slightly above 60%. Given the relatively low quality of today’s wealth data, especially regarding top global wealth holders, one should be cautious about this estimate. It could well be that we somewhat underestimate the recent rise and the current level of wealth concentration.[37] In any case, a share of 60% for the top decile is already high, especially compared to the concentration of labor income: the top 10% of labor earners typically receive less than 30% of aggregate labor income.
15.3.2.2 Britain
Although the data sources for other countries are not as systematic and comprehensive as the French sources, existing evidence suggests that the French pattern extends to other European countries.
For the United Kingdom, on Figure 15.13, we have combined historical estimates provided by various authors—particularly Atkinson and Harrison (1978)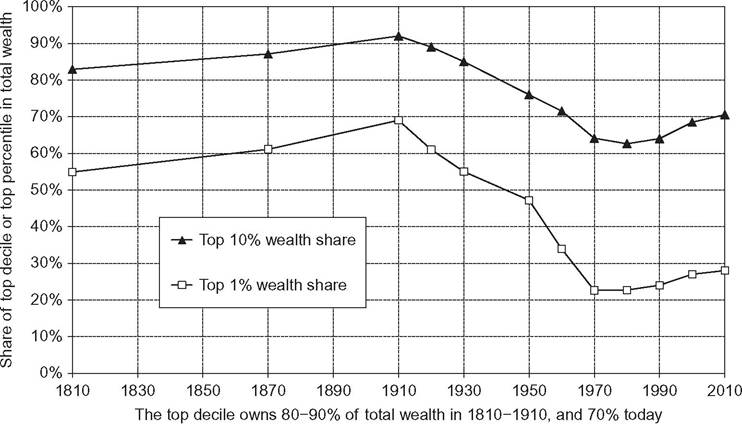
Figure 15.13 Wealth inequality in the United Kingdom, 1810-2010.
and Lindert (1986)—as well as more recent estimates using inheritance tax data. These series are not fully homogenous (in particular, the nineteenth century computations are based on samples of private probate records and are not entirely comparable to the twentieth-century inheritance tax data), but they deliver a consistent picture. Wealth concentration was high and rising during the nineteenth century up until World War I, then fell abruptly following the 1914—1945 shocks, and has been rising again since the 1980s.
According to these estimates, wealth concentration was also somewhat larger in the United Kingdom than in France in the nineteenth and early twentieth centuries. Yet the gap is much smaller than what French contemporary observers claimed. Around 1880—1910, it was very common among French republican elites to describe France as a “country of little property owners” (unpays de petits proprietaries), in contrast to aristocratic Britain. Therefore, the argument goes, there was no need to introduce progressive taxation in France (this should be left to Britain). The data show that on the eve of World War I the concentration of wealth was almost as extreme on both sides of the channel: the top 10% owns about 90% of wealth in both countries, and the top 1% owns 70% of wealth in Britain, versus 60% in France. It is true that aristocratic landed estates were more present in the United Kingdom (and to some extent still are today). But given that the share of agricultural land in national wealth dropped to low levels during the nineteenth century (see Figures 15.1 and 15.2), this does not matter much. At the end of the day, whether the country is a republic or a monarchy seems to have little impact on wealth concentration in the long run.
15.3.2.3 Sweden
Although widely regarded as an egalitarian haven today, Sweden was just as unequal as France and Britain in the nineteenth and early twentieth centuries. This is illustrated by Figure 15.13, where we plot some of the estimates constructed by Roine and Waldenstrom (2009) and Waldenstrom (2009).
The concentration of wealth is quite similar across European countries, both for the more ancient and the more recent estimates. Beyond national specificities, a European pattern emerges: the top 10% wealth share went from about 90% around 1900—1910 to about 60-70% in 2000-2010, with a recent rebound. In other words, about 20-30% of national wealth has been redistributed away from the top 10% to the bottom 90%. Since most of this redistribution benefited the middle 40% (the bottom 50% still hardly owns any wealth), this evolution can be described as the rise of a patrimonial middle class (Figure 15.14).
In the case of Sweden, Roine and Waldenstrom (2009) have also computed a corrected top 1% of wealth shares using estimates of offshore wealth held abroad by rich Swedes. They find that under plausible assumptions the top 1% share would shift from about 20% of aggregate wealth to over 30% (i.e., approximately the levels observed in the United Kingdom, and not too far away from the level observed in the United States). This illustrates the limitations of our ability to measure recent trends and levels, given the rising importance of tax havens.
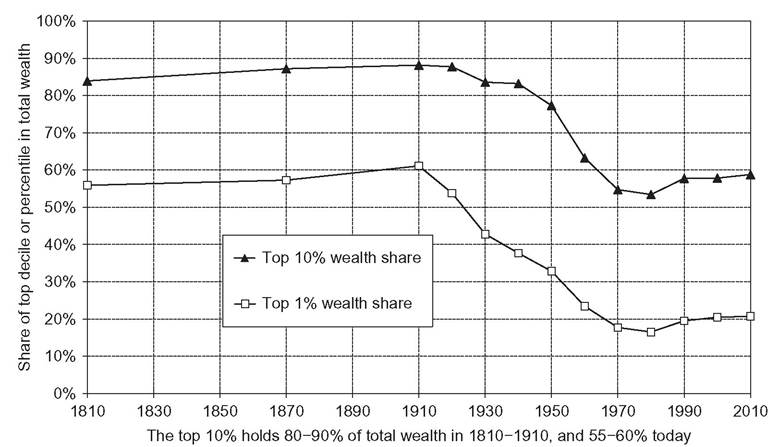
Figure 15.14 Wealth inequality in Sweden, 1810-2010.
15.3.3 The Great Inequality Reversal: Europe Versus the United States, 1810-2010
Comparing wealth concentration in Europe and the United States, the main finding is a fairly spectacular reversal. In the nineteenth century, the United States was to some extent the land of equality (at least for white men): the concentration of wealth was much less extreme than in Europe (except in the South). Over the course of the twentieth century, this ordering was reversed: wealth concentration has become significantly higher in the United States. This is illustrated by Figure 15.15, where we combine the estimates due to Lindert (2000) for the nineteenth century with those of Saez and Zucman (2014) for the twentieth and twenty-first centuries to form long-run U.S. series, and by Figure 15.16, where we compare the United States to Europe (defined as the arithmetic average of France, Britain, and Sweden).
The reversal comes from the fact that Europe has become significantly less unequal over the course of the twentieth century, whereas the United States has not. The United States has almost returned to its early twentieth-century wealth concentration level: at its peak in the late 1920s, the 10% wealth share was about 80%, in 2012 it is about 75%; similarly the top 1% share peaked at about 45% and is back to around 40% today. Note, however, that the United States never reached the extreme level of wealth concentration of nineteenth- and early twentieth-century Europe (with a top decile of 90% or more). The United States has always had a patrimonial middle class, although one of varying importance. The share of wealth held by the middle class appears to have been shrinking since the 1980s.
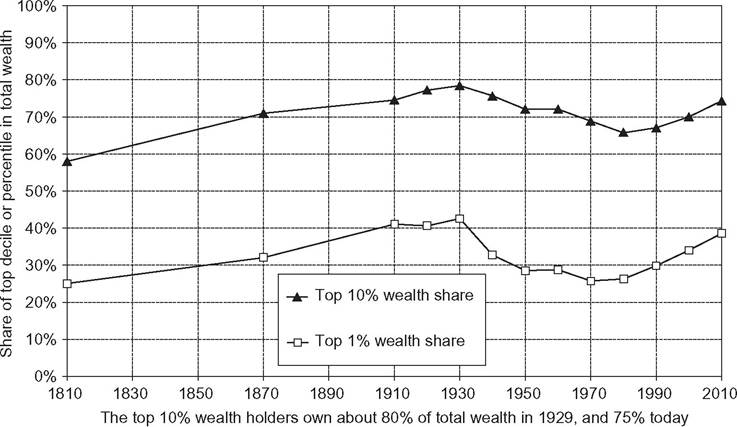
Figure 15.15 Wealth inequality in the United States, 1810-2010.
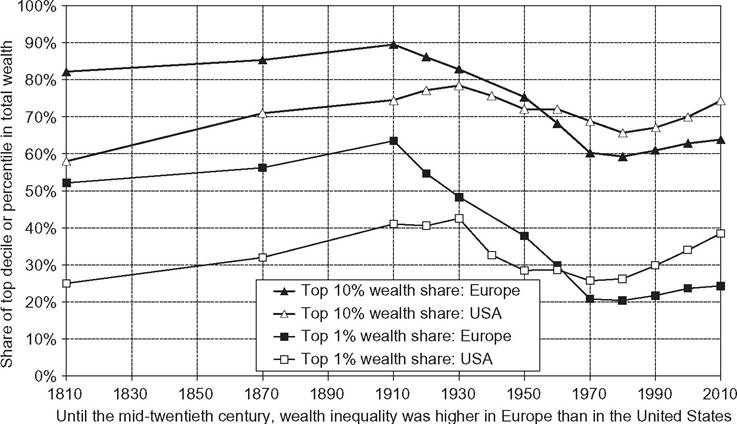
Figure 15.16 Wealth inequality: Europe and the United States, 1810-2010.
U.S. economists of the early twentieth century were very concerned about the possibility that their country becomes as unequal as Old Europe. Irving Fisher, then president of the American Economic Association, gave his presidential address in 1919 on this topic. He argued that the concentration of income and wealth was becoming as dangerously excessive in America as it had been for a long time in Europe. He called for steep tax progressivity to counteract this tendency. Fisher was particularly concerned about the fact that as much as half of U.S. wealth was owned by just 2% of U.S. population, a situation that he viewed as “undemocratic” (see Fisher, 1920). One can indeed interpret the spectacular rise of tax progressivity that occurred in the United States during the first half of the twentieth century as an attempt to preserve the egalitarian, democratic American ethos (celebrated a century before by Tocqueville and others). Attitudes toward inequality are dramatically different today. Many U.S. observers now view Europe as excessively egalitarian (and many European observers view the United States as excessively nonegalitarian).
15.4.