THE LONG-RUN EVOLUTION OF THE SHARE OF INHERITED WEALTH
15.4.1 Concepts, Data Sources, and Methods
We now turn to our third ratio of interest, the share of inherited wealth in aggregate wealth. We should make clear at the outset that this is an area where available evidence is scarce and incomplete.
Measuring the share of inherited wealth requires a lot more data than the measurement of aggregate wealth-income ratios or even wealth concentration. It is also an area where it is important to be particularly careful about concepts and definitions. Purely definitional conflicts have caused substantial confusion in the past. Therefore it is critical to start from there.15.4.1.1 Basic Notions and Definitions
The most natural way to define the share of inherited wealth in aggregate wealth is to cumulate past inheritance flows. That is, assume that we observe the aggregate wealth stock Wt at time t in a given country, andthat we would like to define and estimate the aggregate inherited wealth stock (and conversely aggregate self-made
wealth, which we simply define as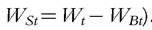 Assume that we observe the annual
flow of inheritance Bs that occurred in any year s ≤ t. At first sight, it might seem natural to define the stock of inherited wealth WBt as the sum of past inheritance flows:
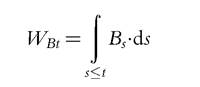
However, there are several practical and conceptual difficulties with this ambiguous definition, which need to be addressed before the formula can be applied to actual data. First, it is critical to include in this sum not only past bequest flows Bs (wealth transmissions at death) but also inter vivos gift flows Vs (wealth transmissions inter vivos).
That is, one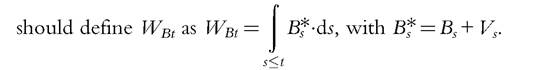
Alternatively, if one cannot observe directly the gift flow Vs, one should replace the observed bequest flow Bs by some gross level is an esti
mate of the gift/bequest flow ratio. In countries where adequate data is available, the giftbequest ratio is at least 10-20%, and is often higher than 50%, especially in the recent period.[38] It is thus critical to include gifts in one way or another. In countries where fiscal data on gifts are insufficient, one should at least try to estimate 1+ υs using surveys (which often suffers from severe downward biases) and harder administrative evidence from other countries.
Next, to properly apply this definition, one should only take into account the fraction of the aggregate inheritance flow Bst ≤ Bs that was received at time s by individuals who are still alive at time t. The problem is that doing so properly requires very detailed individual-level information. At any time t, there are always individuals who received inheritance a very long time ago (say, 60 years ago) but who are still alive (because they inherited at a very young age and/or are enjoying a very long life). Conversely, a fraction of the inheritance flow received a short time ago (say, 10 years ago) should not be counted (because the relevant inheritors are already dead, e.g., they inherited at an old age or died young). In practice, however, such unusual events tend to balance each other, so that a standard simplifying assumption is to cumulate the full inheritance flows observed the previous H years, where H is the average generation length, that is, the average age at which parents have children (typically H = 30 years). Therefore we obtain the following simplified definition: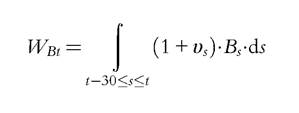
15.4.1.2 The Kotlikoff-Summers-Modigliani Controversy
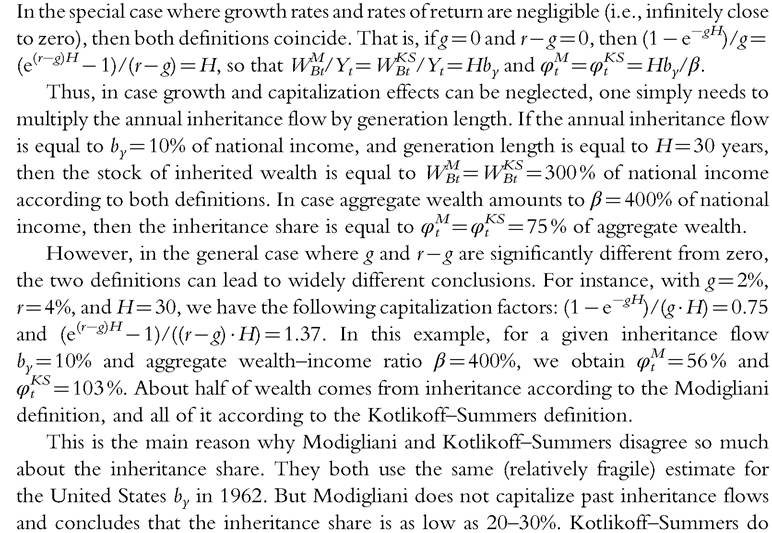
Assume now that these two difficulties can be addressed (i.e., that we can properly estimate the factor 1 + υs and the average generation length H).
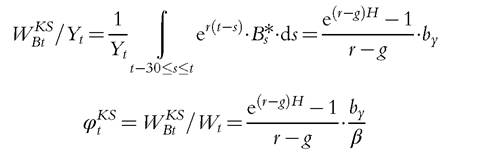
There are more substantial difficulties ahead. First, to properly compute WBt, one needs to be able to observe inheritance flows B* over a relatively long time period (typically, the previous 30 years). In the famous Kotlikoff-Summers-Modigliani (KSM) controversy, both Kotlikoff and Summers (1981) and Modigliani (1986,1988) used estimates of the U.S. inheritance flow for only 1 year (and a relatively ancient year: 1962), see also Kotlikoff (1988). They simply assumed that this estimate could be used for other years. Namely, they assumed that the inheritance flow-national income ratio (which we note bys = B*∕Ys) is stable over time. One problem with this assumption is that it might not be verified. As we shall see below, extensive historical data on inheritances recently collected in France show that the bys ratio has changed tremendously over the past two centuries, from about 20-25% of national income in the nineteenth and early twentieth centuries, down to less than 5% at mid-twentieth century, back to about 15% in the early twenty-first century (Piketty, 2011). So one cannot simply use one year of data and assume that we are in a steady state: One needs a long-run time series on the inheritance flow in order to estimate the aggregate stock of inherited wealth.Next, one needs to decide the extent to which past inheritance flows need to be upgraded or capitalized. This is the main source of disagreement and confusion in the KSM controversy.
Modigliani (1986, 1988)chooses zero capitalization. That is, he simply defines the stock of inherited wealth as the raw sum of past inheritance flows with no adjustment whatsoever (except for the GDP price index):
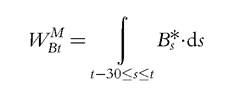
Assume a fixed inheritance flow-national income ratio growth rate g (so that
 generation length H, and aggregate private wealth-national income ratio
In contrast, Kotlikoff and Summers (1981, 1988) choose to capitalize past inheritance flows by using the economy’s average rate of return to wealth (assuming it is constant and equal to r).
Following the Kotlikoff-Summers definition, the steady-state formulas for the stock of inherited wealth relative to national income and for the share of
 inherited wealth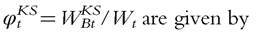
capitalize the same flows and conclude that the inheritance share is as large as 80-90% (or even larger than 100%). Both sides also disagree somewhat about the measurement of by, but the main source of disagreement comes from this capitalization effect.[39]
15.4.1.3 The Limitations of KSM Definitions
Which of the two definitions is most justified? In our view, both are problematic. It is wholly inappropriate not to capitalize at all past inheritance flows. But full capitalization is also inadequate.
The key problem with the KSM representative-agent approach is that it fails to recognize that the wealth accumulation process always involves two different kinds of people and wealth trajectories. In every economy, there are inheritors (people who typically consume part of the return to their inherited wealth) and there are savers (people who do not inherit much but do accumulate wealth through labor income savings). This is an important feature of the real world that must be taken into account for a proper understanding of the aggregate wealth accumulation process.
The Modigliani definition is particularly problematic as it simply fails to recognize that inherited wealth produces flow returns. This mechanically leads to artificially low numbers for the inheritance share (as low as 20-40%), and to artificially high numbers for the life-cycle share in wealth accumulation, which Modigliani defines as
 (up
(up
to 60-80%).
As Blinder (1988) argues, “a Rockefeller with zero lifetime labor income and consuming only part of his inherited wealth income would appear to be a life-cycle saver in Modigliani’s definition, which seems weird to me.” One can easily construct illustrative examples of economies where all wealth comes from inheritance (with dynasties of the sort described by Blinder), but where Modigliani would still find an inheritance share well below 50%, simply because of his definition. This makes little sense.[40]The Kotlikoff-Summers definition is conceptually more satisfactory than Modigliani’s. But it suffers from the opposite drawback in the sense that it mechanically leads to artificially high numbers for the inheritance share . In particular,
 can easily be larger than 100%, even though there are life-cycle savers and self-made wealth accumulators in the economy, and a significant fraction of aggregate wealth accumulation comes from them. This will arise whenever the cumulated return to inherited wealth
consumed by inheritors exceeds the savers’ wealth accumulation from their labor savings. In the real world, this condition seems to hold not only in prototype rentier societies such as Paris 1872-1937 (see Piketty et al., 2013), but also in countries and time periods when aggregate inheritance flow is relatively low. For instance, aggregate French series show that the capitalized bequest share φκ has been larger than 100% throughout the twentieth century, including in the 1950s-1970s, a period where a very significant amount of new self-made wealth was accumulated (Piketty, 2011).
In sum, the Modigliani definition leads to estimates of the inheritance share that are artificially close to 0%, whereas the Kotlikoff-Summers leads to inheritance shares that tend to be structurally above 100%.
Neither of them offers an adequate way to look at the data.15.4.1.4 ThePPVRDefinition
In an ideal world with perfect data, the conceptually consistent way to define the share of inherited wealth in aggregate wealth is the following. It has first been formalized and applied to Parisian wealth data by Piketty et al. (2013), so we refer to it as the PPVR definition.
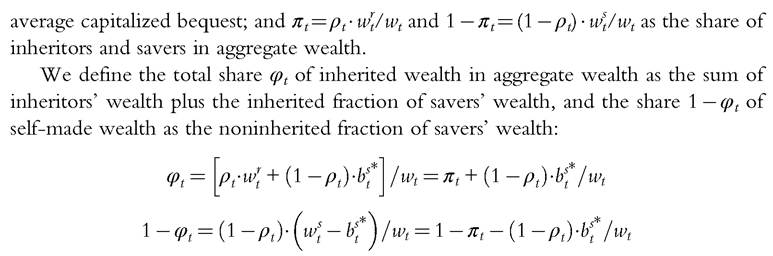
The basic idea is to split the population into two groups. First, there are “inheritors” (or “rentiers”), whose assets are worth less than the capitalized value of the wealth they inherited (over time they consume more than their labor income). The second group is composed of “savers” (or “self-made individuals”), whose assets are worth more than the capitalized value of the wealth they inherited (they consume less than their labor income). Aggregate inherited wealth can then be defined as the sum of inheritors’ wealth plus the inherited fraction of savers’ wealth, and self-made wealth as the noninherited fraction of savers’ wealth. By construction, inherited and self-made wealth are less than 100% and sum to aggregate wealth, which is certainly a desirable property. Although the definition is fairly straightforward, it differs considerably from the standard KSM definitions based on representative agent models. The PPVR definition is conceptually more consistent and provides a more meaningful way to look at the data and to analyze the structure of wealth accumulation processes. In effect, it amounts to defining inherited wealth at the individual level as the minimum between current wealth and capitalized inheritance. 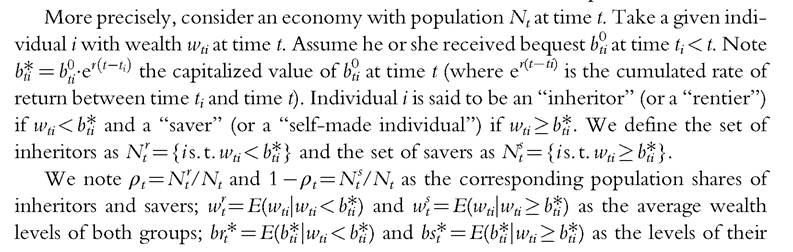
The downside of this definition is that it is more demanding in terms of data availability. Although Modigliani and Kotlikoff-Summers could compute inheritance shares in aggregate wealth by using aggregate data only, the PPVR definition requires micro data. 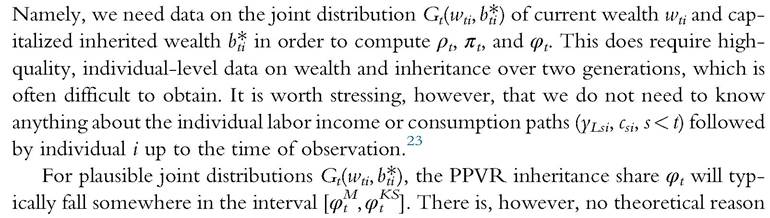 why it should be so in general. Imagine, for instance, an economy where inheritors consume their bequests the very day they receive them, and never save afterward, so that wealth accumulation entirely comes from the savers, who never received any bequest (or negligible amounts) and who patiently accumulate savings from their labor income. Then with our definition φt = 0%: in this economy, 100% of wealth accumulation comes from savings, and nothing at all comes from inheritance.
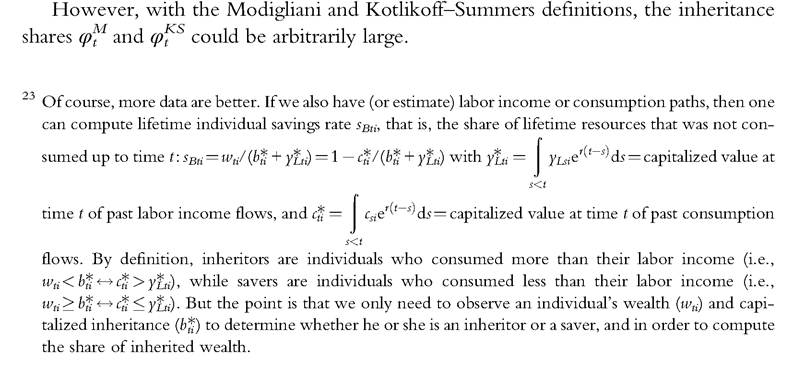
15.4.1.5 A Simplified Definition: Inheritance Flows versus Saving Flows
When available micro data is not sufficient to apply the PPVR definition, one can also use a simplified, approximate definition based on the comparison between inheritance flows and saving flows.
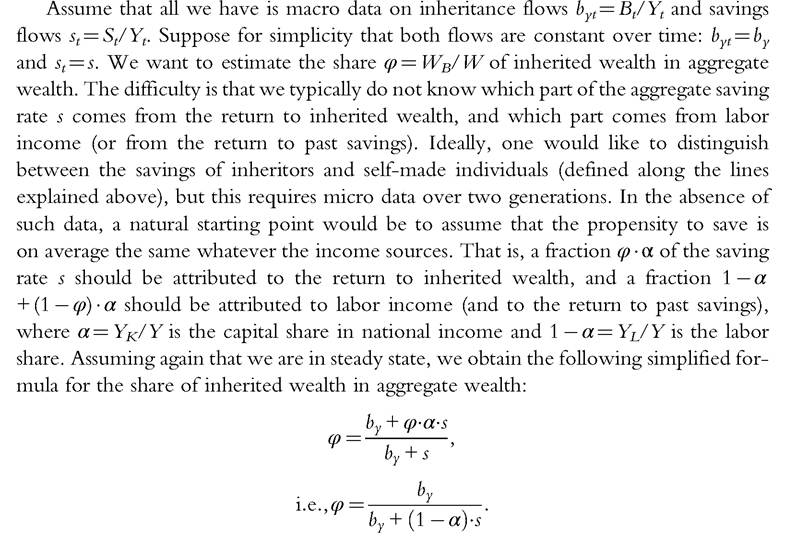
Intuitively, this formula simply compares the size of the inheritance and saving flows. Because all wealth must originate from one of the two flows, it is the most natural way to estimate the share of inherited wealth in total wealth.[41]
There are a number of caveats with this simplified formula. First, real-world economies are generally out of steady state, so it is important to compute average values of by, s, and α over relatively long periods of time (typically over the past H years, with H = 30 years). If one has time-series estimates of the inheritance flow bys, capital share αs, and saving rate ss, then one can use the following full formula, which capitalizes past inheritance and savings flows at rate r—g:
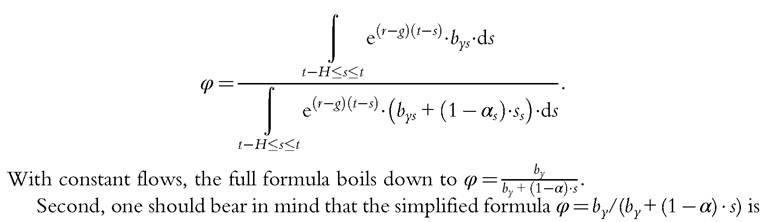
an approximate formula. In general, as we show below, it tends to underestimate the true share of inheritance, as computed from micro data using the PPVR definition. The reason is that individuals who have only labor income tend to save less (in proportion to their total income) than those who have large inherited wealth and capital income, which. in turn, seems to be related to the fact that wealth (and particularly inherited wealth) is more concentrated than labor income.
On the positive side, simplified estimates of φ seem to follow micro-based estimates relatively closely (much more closely than KSM estimates, which are either far too small or far too large), and they are much less demanding in terms of data. One only needs to estimate macro flows. Another key advantage of the simplified definition over KSM definitions is that it does not depend upon the sensitive choice of the rate of return or the rate of capital gains or losses. Whatever these rates might be, they should apply equally to inherited and self-made wealth (at least as a first approximation), so one can simply compare inheritance and saving flows.
15.4.2 The Long-Run Evolution of Inheritance in France 1820-2010
15.4.2.1 The Inheritance Flow-National Income Ratio byt
What do we empirically know about the historical evolution of inheritance? We start by presenting the evidence on the dynamics of the inheritance to national income ratio byt in France, a country for which, as we have seen in Section 15.3, historical data sources are exceptionally good (Piketty, 2011). The main conclusion is that byt has followed a spectacular U-shaped pattern over the twentieth century. The inheritance flow was relatively stable, around 20-25% of national income throughout the 1820-1910 period (with a slight upward trend), before being divided by a factor of about 5-6 between 1910 and the 1950s, and then multiplied by a factor of about 3-4 between the 1950s and the 2000s (see Figure 15.17).
These are enormous historical variations, but they appear to be well-founded empirically. In particular, the patterns for byt are similar with two independent measures of the inheritance flow. The first, what we call the fiscal flow, uses bequest and gift tax data and makes allowances for tax-exempt assets such as life insurance. The second measure, what we call the economic flow, combines estimates of private wealth Wt, mortality tables, and observed age-wealth profile, using the following accounting equation:
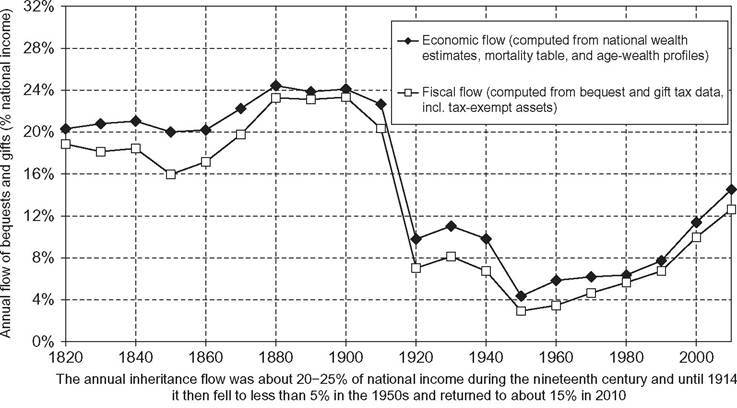
Figure 15.17 The annual inheritance flow as a fraction of national income, France 1820-2010.
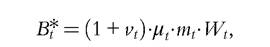
where mt = mortality rate (number of adult decedents divided by total adult population), μt = ratio between average adult wealth at death and average adult wealth for the entire population, and υt = V/Bt = estimate of the gift/bequest flow ratio.
The gap between the fiscal and economic flows can be interpreted as capturing tax evasion and other measurement errors. It is approximately constant over time and relatively small, so that the two series deliver consistent long-run patterns (see Figure 15.17).
The economic flow series allow—by construction—for a straightforward decomposition of the various effects at play in the evolution of byt. In the above equation, dividing both terms by Yt we get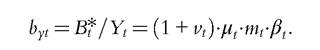
Similarly, dividing by Wt we can define the rate of wealth transmission bwt as 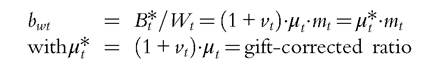
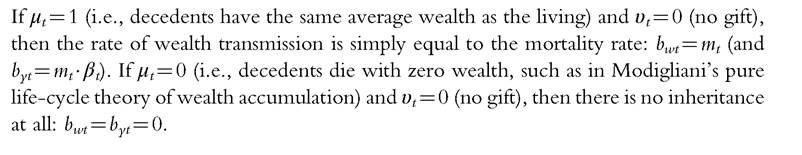
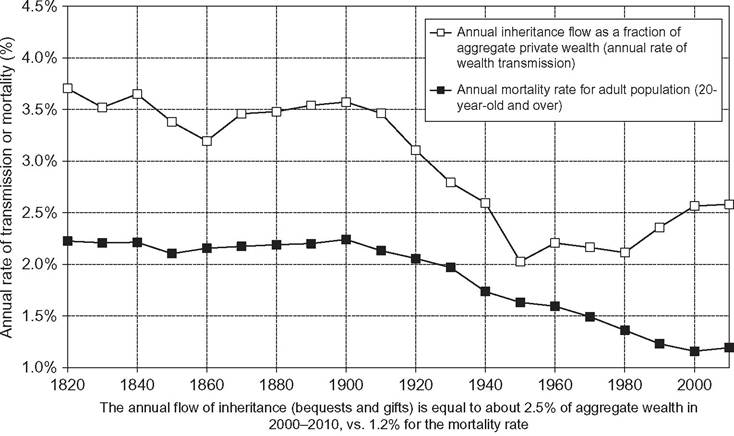
Figure 15.18 Inheritance flow versus mortality rate, France 1820-2010.
Using these accounting equations, we can see that the U-shaped pattern followed by the French inheritance-income ratio byt is the product of two U-shaped evolutions. First, it partly comes from the U-shaped evolution of the private wealth-income ratio βt. The U-shaped evolution of byt, however, is almost twice as marked at that ofβt. The wealthincome ratio was divided by a factor of about 2-3 between 1910 and 1950 (from 600-700% to 200-300%, see Figure 15.2), whereas the inheritance flow was divided by a factor around 5-6 (from 20-25% to about 4%, see Figure 15.17). The explanation is that the rate of wealth transmission ∙ mt has also been following a U-shaped
pattern: it was almost divided by 2 between 1910 and 1950 (from over 3.5% to just 2%), and it has been rising again to about 2.5% in 2010 (see Figure 15.18).
The U-shaped pattern followed by bwt, in turn, entirely comes from . The relative wealth of decedents was at its lowest historical level in the aftermath of World War II (which, as we shall see below, is largely due to the fact that it was too late for older cohorts to recover from the shocks and reaccumulate wealth after the war). Given that aggregate wealth was also at its lowest historical level, the combination of these two factors explains the exceptionally low level of the inheritance flow in the 1950s-1960s. By contrast, the mortality rate mt has been constantly diminishing: this long-run downward trend is the mechanical consequence of the rise in life expectancy (for a given cohort size).25
25 The mortality rate, however, is about to rise somewhat in coming decades in France owing to the aging of the baby boomers (see Piketty, 2011). This effect will be even stronger in countries where cohort size has declined in recent decades (such as Germany orJapan) andwill tend to push inheritance flows toward even higher levels.
Figure 15.19 The ratio between average wealth at death and average wealth of the living, France 1820-2010.
In the recent decades, a very large part of the rise in μ* = (1+ υt) ∙ μt comes from the rise in the gift-bequest ratio υt, which used to be about 20% during most of the nineteenth to twentieth centuries, and has gradually risen to as much as 80% in recent decades (see Figure 15.19). That is, the gift flow is currently almost as large as the bequest flow.
Although there is still much uncertainty about the reasons behind the rise in gifts, the evidence suggests that it started before the introduction of new tax incentives for gifts in the 1990s-2000s, and has more to do with the growing awareness by wealthy parents that they will die old and that they ought to transmit part of their wealth inter-vivos if they want their children to fully benefit from it.
In any case, one should not underestimate the importance of gifts. In particular, one should not infer from a declining age-wealth profile at old ages or a relatively low relative wealth of decedents that inheritance is unimportant: this could simply reflect the fact that decedents have already given away a large part of their wealth.
15.4.2.2 The Inheritance Stock-Aggregate Wealth Ratio φt
How do the annual inheritance flows transmit into cumulated inheritance stocks? Given the data limitations we face, we show on Figure 15.20 two alternative estimates for the share φt of total inherited wealth in aggregate French wealth between 1850 and 2010. According to both measures, there is again a clear U-shaped pattern. The share of inherited wealth φt was as large as 80-90% of aggregate wealth in 1850-1910, down to as little as 35-45% around 1970, and back up to 65-75% by 2010.
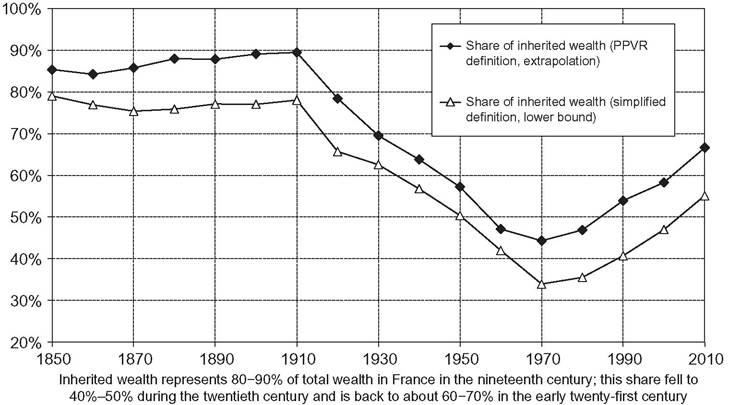
Figure 15.20 The cumulated stock of inherited wealth as a fraction of aggregate private wealth, France 1850-2010.
The higher series, which we see as the most reliable, was obtained by applying the micro-based PPVR definition (see Section 15.4.1.4). The limitation here is that the set of micro data on wealth over two generations that has been collected in French historical archives is more complete for Paris than for the rest of France (see Piketty et al., 2006, 2013). For years with missing data for the rest of France, the estimates reported on Figure 15.20 were extrapolated on the basis of the Parisian data. Ongoing data collection suggests that the final estimates will not be too different from the approximate estimates reported here.
The lower series, which we see as a lower bound, comes from the simplified definition based on the comparison of inheritance and saving flows (see Section 15.4.1.5).26 The key advantage of this simplified definition is that it requires much less data: it can readily be computed from the inheritance flow series byt that were reported above. It delivers estimates of the inheritance share φt that are always somewhat below the micro-based estimates, with a gap that appears to be approximately constant. The gap seems to be due to the fact that the simplified definition attributes too much saving to pure labor earners with little inheritance.
In both series, the share φt of total inherited wealth in aggregate wealth reaches its lowest historical point in the 1970s, whereas the inheritance flow byt reaches its lowest point in the immediate aftermath of World War II. The reason is that the stock of 
inherited wealth comes from cumulating the inheritance flows of the previous decades— hence the time lag.
15.4.3 Evidence from Other Countries
What do we know about the importance of inheritance in countries other than France? A recent wave of research attempts to construct estimates of the inheritance flownational income ratio byt in a number of European countries. The series constructed by Atkinson (2013) for Britain and Schinke (2013) for Germany show that byt has also followed a U-shaped pattern in these two countries over the past century (see Figure 15.21). Data limitations, however, make it difficult at this stage to make precise comparisons between countries.
For Britain, the inheritance flow byt of the late nineteenth to early twentieth centuries seems to be similar to that of France, namely about 20-25% of national income. The flow then falls following the 1914-1945 shocks, albeit less spectacularly than in France, and recovers in recent decades. Karagiannaki (2011), in a study of inheritance in the United Kingdom from 1984 to 2005, also finds a marked increase in that period. The rebound, however, seems to be less strong in Britain than in France, so that the inheritance flow appears smaller than in France today. We do not know yet whether this finding is robust. Available British series are pure “fiscal flow” series (as opposed to French series, for which we have both an “economic” and a “fiscal” estimate). Aspointed out by Atkinson (2013), the main reason for the weaker British rebound in recent decades is that the gift-bequest ratio vt has not increased at all according to fiscal data (υt has remained relatively flat at a
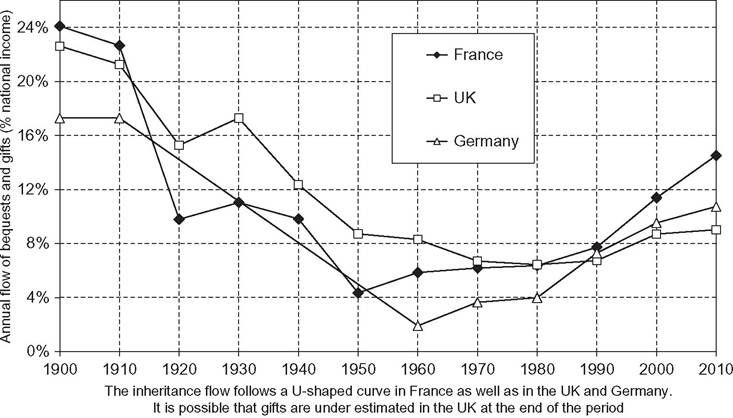
Figure 15.21 The inheritance flow in Europe, 1900-2010.
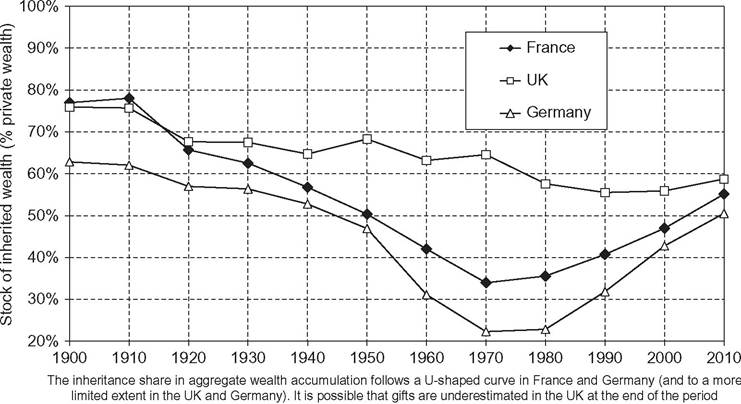
Figure 15.22 The inheritance stock in Europe, 1900-2010.
low level, around 10-20%). According to Atkinson, this could be due to substantial underreporting of gifts to tax authorities.
Germany also exhibits a U-shaped pattern of inheritance flow byt that seems to be broadly as sharp as in France. In particular, just as in France, the strong German rebound in recent decades comes with a large rise in the gift-bequest ratio vt during the 1990s- 2000s (υt is above 50-60% in the 2000s). The overall levels of byt are generally lower in Germany than in France, which given the lower aggregate wealth-income ratio βt is not surprising. Shouldwe compare the rates ofwealth transmission (i.e., bwt = byt∕βt), then the levels would be roughly the same in both countries in 2000-2010.
We report on Figure 15.22 the corresponding estimates for the share φt of total inherited wealth in aggregate wealth, using the simplified definition φ = by∕(by +(1 — α)s). For Germany, the inheritance share φt appears to be generally smaller than in France. In particular, it reaches very low levels in the 1960s-1970s, owing to the extremely low inheritance flows in Germany in the immediate postwar period, and to large saving rates. In recent decades, the German φt has been rising fast and seems to catch up with France’s. In the United Kingdom, the inheritance share φt apparently never fell to the low levels observed in France and Germany in the 1950s, and seems to be always higher than on the Continent. The reason, for the recent period, is that the United Kingdom has had relatively low saving rates since the 1970s.[42]
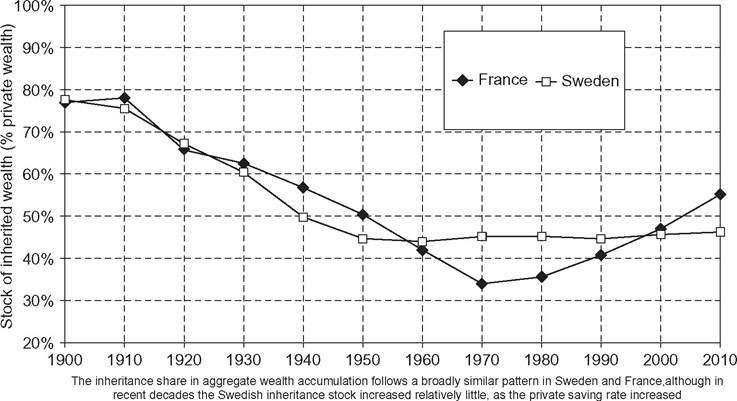
Figure 15.23 The inheritance stock in France and Sweden, 1900-2010.
Recent historical research suggests that inheritance flows have also followed U-shaped patterns in Sweden (see Ohlsson et al., 2013). Here byt appears to be smaller than in France, but this again seems largely due to lower βt ratios. When we look at the implied bwt and φt ratios, which in a way are the most meaningful ratios to study, then both the levels and shape are relatively similar across European countries. As shown by Figure 15.23, the share of inherited wealth followed the same evolution in Sweden and France in the twentieth century (the main difference is that it seems to have increased a bit less in Sweden than in France in recent decades, because of a rise in the private saving rate). We stress again, however, that a lot more data needs to be collected—and to some extent is currently being collected—on the historical evolution of inheritance before we can make proper international comparisons.
Prior to the recent inheritance flow estimates surveyed above, a first wave of research, surveyed by Davies and Shorrocks (1999), mostly focused on the United States, with conflicting results—the famous Modigliani-Kotlikoff-Summers controversy. More recently, Kopczuk and Edlund (2009) observe that in estate tax data, the share of women among the very wealthy in the United States peaked in the late 1960s (at nearly one-half) and then declined to about one-third. They argue that this pattern reflects changes in the importance of inheritance, as women are less likely to be entrepreneurs. Wolff and Gittleman (2013) analyze Survey of Consumer Finances (SCF) data and find little evidence of a rise in inheritances since the late 1980s. Looking at Forbes’ data, Kaplan and Rauh (2013) find that Americans in the Forbes 400 are less likely to have inherited their wealth today than in the 1980s. It is unclear, however, whether this result reflects a true economic phenomenon or illustrates the limits of Forbes and other wealth rankings.
Inherited wealth holdings are probably harder to spot than self-made wealth, first because inheritors’ portfolios tend to be more diversified, and also because inheritors may not like to be in the press, while entrepreneurs usually enjoy it and do not attempt to dissimulate their wealth nearly as much. The conclusions about the relative importance of inherited versus self-made wealth obtained by analyzing Forbes list data may thus be relatively fragile.
In the end, there remain important uncertainties about the historical evolution of inheritance in the United States. There are reasons to believe that inheritance has historically been less important in the United States than in Europe, because population growth has been much larger (more on this below). It is unclear whether this still applies today, however. Given the relatively low U.S. saving rates in recent decades, it is possible that even moderate inheritance flows imply a relatively large share φt of total inherited wealth in aggregate wealth (at least according to the simplified definition of φ based on the comparison between by and s).
One difficulty is that U.S. fiscal data on bequests and gifts are relatively low quality (in particular because the federal estate tax only covers few decedents; in 2012 only about 1 decedent out of 1000 pays the estate tax). One can use survey data (e.g., from the SCF) to estimate the relative wealth of decedents μt and compute the economic inheritance flow byt = (1 + υt) ■ μt ■ βt. One key problem is that one needs to find ways to estimate the gift-bequest ratio υt, which is not easy to do in the absence of high-quality fiscal data. Self-reported retrospective data on bequest and gift receipts usually suffer from large downward biases and should be treated with caution. In countries where there exists exhaustive administrative data on bequests and gifts (such as France, and to some extent Germany), survey-based self-reported flows appear to be less than 50% of fiscal flows. This may contribute to explain the low level of inheritance receipts found by Wolff and Gittleman (2013).[43]
15.5.
More on the topic THE LONG-RUN EVOLUTION OF THE SHARE OF INHERITED WEALTH:
- Contents
- CONCLUDING COMMENTS AND RESEARCH PROSPECTS
- Chinese Religions on Gender and Identity
- I The Oldest Ocean
- POLITICAL ELITES IN THE NEW STATES
- Reform and Counter-Reform
- I SOURCES INDEPENDENT OF JUSTINIAN