Theory of the firm
2 Financial reports as a source of corporate information 31
3 Firm objectives and firm behaviour 46
4 Entrepreneurship and small/ medium-sized enterprises (SMEs) 63
5 Mergers and acquisitions in the growth of the firm 80
6 Oligopoly in theory and practice 107
7 The multinational corporation 124
8 Privatization and deregulation 147
9 Beyond markets: critical approaches to microeconomics 164
Financial reports as a source of corporate information
Companies in the UK are required to publish information (annually and, for many large companies, biannually) in compliance with statutes and with the rules laid down by various financial regulators.
This chapter examines the content and presentation of annual reports, and identifies a range of useful financial measures that can be calculated. The 2010 accounts of Tesco plc have been used for illustration. Tesco is the world's third-largest food retailer, with 4,811 stores in 13 countries. The chapter concludes with a detailed analysis of the Financial Times Share Information Service, and the indices and ratios it contains. Being familiar with ways of analysing and interpreting published information of the kind in this chapter is important for both internal and external stakeholders of the organization. Changes in the various financial measures can give early warning of the need for policy adjustments and new strategic directions, both to decisionmakers within the organization and to those external stakeholders with a financial interest in the future performance of the organisation. Chapters 3 and 15 pay further attention to the ways in which objectives are set and implemented within organizations and to their ethical and social responsibilities, both formal and informal.Financial reports and the assessment of company performance
In the past 20 years, companies have been subject to ever more complex regulations that detail the minimum requirements of disclosure in published financial reports.
These reports enable various user groups to take informed decisions concerning their financial relationship with the company.However, the separation of ownership and control in the majority of public companies (plcs)1 might be thought to encourage management (controllers) to present to shareholders (owners) as favourable a picture as possible of the company’s activities. Fear of the effects of competition and of adverse investor reaction might also mean that companies seek to give away as little information as possible - usually by disclosing only the legal minimum of requirements. Even so, most plcs regard the presentation of their published financial reports as a matter of corporate pride, and pay great attention to the quality and relevance of the documents.
An examination of the typical elements that make up a company report reveals a mixture of statutory items (i.e. those required by company law), requirements of the accounting profession, additional Stock Exchange regulations (for ‘listed’ companies) and voluntary disclosures. Major components of these reports are:
1 Business review
2 Directors’ report
3 Balance sheet
4 Income statement
5 Statement of changes in equity
6 Notes to the financial statements (including statement of accounting policies)
7 Cash flow statement
8 Auditors’ report.
Each of these is summarized below. Since 2005 there has also been a requirement for companies listed on European Stock Exchanges to implement International Financial Reporting Standards, which has resulted in a number of changes in terminology compared with that used in the UK in previous years, including:
■ the ‘Profit and loss account’ is now referred to as the ‘Income statement’;
■ ‘Fixed assets’ are now referred to as ‘Non-current assets’;
■ ‘Stock of unsold goods and materials’ is now referred to as ‘Inventories’;
■ ‘Debtors’ are now referred to as ‘Receivables’;
■ ‘Creditors’ are now referred to as ‘Payables’.
Business review
While there is currently no statutory requirement for a business review, it is regarded as ‘best practice’ that it be included in the annual reports of large companies. The business review has become an important feature of corporate reporting, providing an opportunity for directors to set out a clear and objective analysis of a company’s development, performance, position and prospects. A typical business review includes:
■ commentary on the operating results;
■ review of the group’s financial needs and resources;
■ commentary on risks and uncertainties.
For example, Tesco’s Business Review in 2010 included the following statement on its business strategy:
To ensure the Group continues to pursue the right strategy, the Board discusses strategic issues at every Board meeting and dedicates two full days a year to reviewing the Group’s strategy. The Executive Committee also discusses strategy on a regular basis. We have structured programmes for engaging with all our stakeholders including customers, employees, investors, suppliers, government, media and non-governmental organisations. We also invest significant resources in ensuring our strategy is communicated well and understood by the parties who are key to delivering it. The business operates a Steering Wheel (a balanced scorecard process whereby we set goals for different areas of the business and assess our overall progress on a quarterly basis) in all countries and significant business units to help manage performance and deliver business strategy. (Tesco 2010)
In addition, there is likely to be a Chairman’s report, which is a reflective, personal appraisal of company performance. Tesco’s chairman, David Reid, started his 2010 report on the encouraging note:
I am pleased to report that the Tesco team has once again delivered a good set of results - guided by experienced management who have steered the business through recessions before. As markets around the world are emerging from this recession each part of our business is well positioned to pursue our strategy for growth.
(David Reid, Tesco Chairman, 2010)Directors' report
This includes a statement of the principal activities of the company and of any significant changes that have taken place in the holding of non-current assets (e.g. property sales or the acquisition of subsidiaries). Details of the directors and their shareholdings in the company are also mentioned, as any significant change in their holdings may reflect their view of the company’s future prospects.
Balance sheet
Also known as a Statement of Financial Position, this shows the net assets of the company at its financial year-end, often 31 December, but for a retailer like Tesco, the relatively ‘quiet’ date of the last Saturday in February (27th) was used. It details the assets of the business and balances them against its liabilities; in other words, what the company owns (assets) is compared to what it owes (liabilities). The excess of assets over liabilities (net assets) equals the total equity invested by the company’s ordinary shareholders and the company’s reserves (including its profits) built up over time.
Assets are divided between non-current and current. Non-current assets are those that are expected to be retained by the business and are of significant value, e.g. land, machinery and vehicles. Current assets are those expected to be used in the normal operating cycle, e.g. inventory, trade receivables and bank balances.
Some non-current assets might be intangible (i.e. not ‘physical’), such as the price paid for the reputation (goodwill) of a business that has been taken over by the reporting company. Most non-current assets are depreciated, which ensures that a reasonable amount is included in the company’s total operating expenses to recognize loss in value due to wear and tear, obsolescence, etc.
An increasingly important aspect of a company’s balance sheet is the health of its pension scheme. Factors including the volatility of stock markets, low-yielding investments and increased longevity may cause material imbalances between the obligations of a company under the scheme and the underlying assets available to meet those obligations.
For Tesco, the non-current liabilities of £15,327m shown on the balance sheet (Fig. 2.1) include a pension deficit of £1,840m, an increase of £346m in the year. However, pension liabilities stretch over a long period, and it is assumed - under an accounting convention known as ‘going concern’ - that the company will continue for many years and is willing and able to provide the support necessary to meet its pension obligations.Financial ratios
The construction of several simple ratios from the information contained within the balance sheet can give a clear assessment of the company’s performance by making the following comparisons:
■ with its own performance in previous time periods;
■ with that of other companies in the same sector;
■ with accepted standards of performance, i.e. with particular values (‘norms’) for each ratio.
Figure 2.1 shows the 2010 balance sheet for Tesco plc. Several accounting ratios have been calculated by extracting the 2010 figures from the table and comparing them with the corresponding annual sales revenue (£56,910m for Group sales to outside customers - see the income statement of Fig. 2.2 below). For comparative purposes, the same ratios have been calculated for Kingfisher plc, in a different retailing sector - mainly ‘do it yourself’ materials and services (B & Q, Screwfix, etc.) - and, by way of contrast, from Alumasc plc, a building materials manufacturer.
Gearing ratio
This reflects the financial risk to which the company is subject, by measuring the capital structure of the company and the degree to which it relies on external borrowings. Gearing (also known as leverage) can be calculated in various ways, including:
| Group Balance Sheet 27 February 2010 | 2010 £m | 2009 £m |
| Non-current assets | ||
| Goodwill and intangible assets | 4,177 | 4,076 |
| Property, plant and equipment | 23,203 | 23,152 |
| Investment property | 2,731 | 1,539 |
| Other investments | 4,147 | 3,318 |
| 34,258 | 32,085 | |
| Current assets | ||
| Inventories | 2,729 | 2,669 |
| Trade and other receivables | 1,888 | 1,820 |
| Loans and Derivative financial instruments | 2,642 | 1,820 |
| Short-term investments and Cash and cash equivalents | 2,819 | 3,509 |
| 11,392 | 13,081 | |
| Other assets held for sale | 373 | 398 |
| 11,765 | 13,479 | |
| Current liabilities1 | ||
| Trade and other payables | (9,442) | (8,665) |
| Other current liabilities | (6,573) | (8,930) |
| (16,015) | (17,595) | |
| Net current liabilities | (4,250) | (4,116) |
| Non-current liabilities2 | (15,327) | (15,063) |
| Net assets | 14,681 | 12,906 |
| Equity | ||
| Share capital | 399 | 395 |
| Share premium account | 4,801 | 4,638 |
| Other reserves | 40 | 40 |
| Retained earnings | 9,356 | 7,776 |
| 14,596 | 12,849 | |
| Minority interests | 85 | 57 |
| Total equity | 14,681 | 12,906 |
| 1Includes £575m bank loans and overdraft. | ||
| 2Includes £12,250m loans. |
Fig.
2.1 Tesco plc Group Balance Sheet. Source: Tesco plc Annual Report2010 (adapted).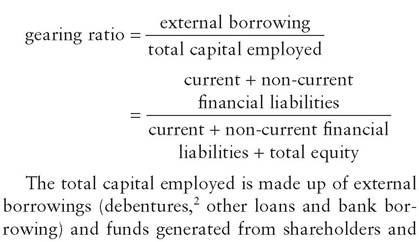
retained from profits (ordinary shares and reserves). The cost of external borrowing is loan interest payments, whilst that for ‘internal’ funds is the dividend return to shareholders.
The gearing ratio shows the proportion of total capital that is provided externally and gives an indication of the burden of interest payments to which the company is committed irrespective of its profitability. A gearing ratio of up to one-third is usually regarded as acceptable for a company, suggesting that
it is not over-reliant on external borrowing. A figure in excess of this indicates a higher-geared company. High gearing ratios are most suitable to those companies with steady and reliable profits, whose earnings are sufficient to cover interest payments and where total dividends are low. However, wide fluctuations in profitability - as in the current recession - would make a highly geared company extremely vulnerable to a downturn in market conditions - profits may be so low that interest payments cannot be covered, leading to financial difficulties. The 2010 accounts of Tesco plc reveal a gearing ratio of 49.16% for Tesco, i.e. (1,675 + 12,520)/(1,675 + 12,520 + 14,681), a value considerably higher than the 28% of Alumasc and Kingfisher’s 24%. Tesco had £2,819m investments and cash at bank and in hand at the balance sheet date which, when offset against its financial liabilities, effectively reduces its gearing level to just under 40%.
A drawback of the ratio is that it is concerned only with borrowings on which interest charges are incurred. It ignores completely liabilities that effectively constitute interest-free loans. One such major item is that of ‘trade payables’ - money that is owed by the company to its suppliers. The ratio tends to understate the dependence of companies on external borrowings, so it is useful to consider all liabilities. The numerator would then become ‘current and noncurrent liabilities’ and produce a ratio that is a more realistic basis for comparison when linked with ‘total equity’. The ratios for the three companies are: Tesco 109%; Alumasc 104%; Kingfisher 75%.
Operating ratios
These can be used to gauge the efficiency with which various aspects of the company’s trading are managed.
Inventory turnover ratio
The holding of inventory, in the form of unsold finished and partly finished goods, is an expensive activity for companies due to storage, security and insurance costs, so that considerable attention is paid to the inventory turnover ratio:
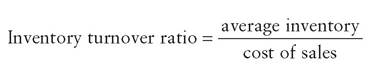
This ratio reflects the level of inventory used to support sales (see Fig. 2.2 below). We would expect companies to carry the minimum level of inventory consistent with the efficient running of the business. The figure will vary widely according to the industrial sector involved. Tesco’s ratio is only 5.16%, i.e. ((2,669 + 2,729)/2)/52,303, a figure which reflects the extremely fast throughput of its inventory, on average being sold every 18.9 days (i.e. 5.16% of 365 days). Kingfisher’s ratio, reflecting very high-value inventories, was 25% (91 days) whilst Alumasc had a ratio of 17% (63 days).
Trade receivables ratio
This ratio can be used to monitor a company’s credit control procedures, by comparing the amount owed to it at the balance sheet date by customers, credit card companies, etc. with its total sales revenue:
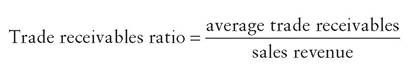
Businesses like retail supermarkets are run almost exclusively on a cash-and-carry basis so will have relatively little owed directly by customers. There will, however, be amounts owing by credit card companies at the balance sheet date. For other businesses an average credit period might be six weeks, equivalent to a trade receivables ratio of around 12%. Retailers Tesco and Kingfisher showed figures of 3.3%, i.e. ((1,820 + 1,888)/2)/56,910 (11.9 days’ sales), and 4.8% (17 days’ sales) respectively, though Alumasc (with very few ‘cash’ sales) had a ratio of 23% (82 days’ sales).
Trade payables ratio
This ratio indicates the size and period of credit a company receives from its suppliers, by comparing its sales with the total amount the company owes to its trade creditors:
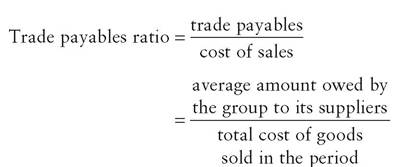
It is in the company’s interests to take full advantage of the credit period offered by its suppliers. Tesco showsafigureof17.3%,i.e. ((8,665 + 9,442)/2)/52,303 (63 days), which is a typical credit period. Kingfisher (35% or 129 days) and Alumasc (30% or 109 days) show how the recession has significantly lengthened the time taken for companies to pay their suppliers. Previously, 40-60 days would be considered typical.
Liquidity ratios
These give an indication of the company’s short-term financial position, in other words, the availability of cash or marketable assets with which to meet current liabilities.
Current ratio
The current ratio measures the extent to which currently available assets cover current liabilities, i.e. those requiring repayment within one year:
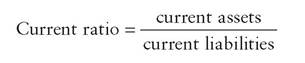
Current assets include inventory, trade receivables and cash. Current liabilities include trade payables, taxation and short-term borrowing.
There is no ideal ratio to which every company should aspire, but analysts may become nervous if current liabilities significantly exceed current assets. A strong ratio (e.g. more than 1.5:1) is not necessarily a sign of strength, since it may mean excessive inventories or receivables, or excess cash resources that lie uninvested.
Supermarket chains are unusual in that their rapid turnovers, together with the cash-and-carry nature of their business, will give relatively low inventory and trade receivables figures. For this reason ‘current assets’ will be relatively small, and so a very low current ratio is to be expected. Tesco’s 2010 figure of 0.73 (11,765/16,015) must be viewed in this context. By comparison, Alumasc’s 1.9 reflects the high level of inventories which manufacturers carry. Kingfisher’s ratio of 0.99 is typical of a predominantly ‘non-food’ retailer.
Quick assets ratio (acid test)
This ratio provides a better indication of short-term liquidity by ignoring inventory (which could prove hard to sell in a liquidity crisis) and concentrating on those assets which are more easily convertible into cash:
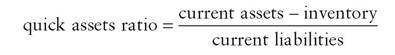
A yardstick of 1.0 is usually sought, indicating that sufficient cash would be available in a crisis to pay off all the company’s current liabilities. Alumasc is just above this, with a ratio of 1.16.
Traders with a rapid turnover of cash sales will have a lower level of current assets, and often a very low quick assets ratio. This is the case with Tesco’s ratio of only 0.56 ((11,765 - 2,729)/16,015) for 2010. Kingfisher’s ratio is only slightly weaker at 0.54.
The current and quick assets ratios are two of the most widely used ratios, as they give a ‘snapshot’ indication of the day-to-day financial strength of the business.
The calculation of the above six ratios from balance sheet information, i.e. (a) gearing ratio, (b) operating ratios (inventory turnover, trade receivables ratio, trade payables ratio) and (c) liquidity ratios (current ratio, quick assets ratio), permits an assessment of a company’s performance with regard to accepted standards across a given sector. This assessment is further improved by considering the information provided by the income statement (see Fig. 2.2).
Income statement
This is a summary of transactions for a stated period, usually a year, and sets revenues against costs in order to show the company’s profit or loss (in smaller companies, the income statement is still known as the ‘profit and loss account’). The statement discloses summarized figures for the expenses of the business (e.g. the cost of sales), but makes no evaluation of the risks incurred in order to earn the given profit levels. Neither is there any indication of the degree to which the given profit level conforms to the company’s objectives. Key information on such aspects can be found in the Business Review section: see p. 32.
Figure 2.2 shows the income statement of Tesco plc for 2010 and indicates the various deductions that take place from sales revenue to derive profit or loss. Part of the profit is distributed to shareholders in the form of dividends (see Fig. 2.4 below), with the balance being retained by the company to boost reserves. Dividends may still be paid to shareholders even when losses have been incurred, if profits were set aside for this purpose in previous years.
The profit figure remains the single most important figure in the company accounts and various profitability measures can be employed to assess relative performance.
| Group Income Statement | ||
| Year ended 27 February 2010 | ||
| 2010 | 2009 | |
| £m | £m | |
| Revenue (Sales excluding VAT) | 56,910 | 53,898 |
| Cost of sales | (52,303) | (49,713) |
| Gross profit | 4,607 | 4,185 |
| Administrative expenses | (1,527) | (1,252) |
| Profit arising on property-related items | 377 | 236 |
| Operating profit | 3,457 | 3,169 |
| Share of post-tax profits of joint ventures and associates | 33 | 110 |
| Finance income | 265 | 116 |
| Finance costs | (579) | (478) |
| Profit before tax | 3,176 | 2,917 |
| Taxation | (840) | (779) |
| Profit for the year | 2,336 | 2,138 |
| Minority interests1 | (9) | (5) |
| Profit attributable to owners of the parent2 | 2,327 | 2,133 |
| Earnings per share from continuing and discontinued operations | Pence | Pence |
| Basic | 29.33 | 27.14 |
| Diluted | 29.19 | 26.96 |
| 1Minority interests relate to the proportion of profits attributable to those shares held in one or more of Tesco's subsidiary companies that are not owned by the parent company. For example, Tesco owns only 70% of Tesco's Malaysian subsidiary. 2Remaining profit after adjustment for the minority interest (see note 1) is transferred to the equity shareholders of Tesco plc. Tesco has a controlling interest in over twenty subsidiary companies, and is thus referred to as the ‘parent' of those companies. | ||
Fig. 2.2 Tesco plc Group Income Statement. Source: Tesco plc Annual Report 2010 (adapted).
Profit margins
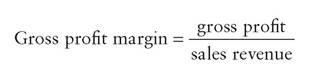
The gross profit margin (also called the ‘gross margin’) shows the profit earned before administrative and other general overheads are deducted. In highly competitive businesses such as supermarket chains, cost cutting to win sales from rivals results in ultraslim gross margins - but with turnover measured in £billions, even a fraction of a percentage point up or down can have a dramatic effect on a company’s fortunes. Tesco’s gross margin in 2010 was a slender 8.10% (4,607/56,910), compared with Alumasc’s 33% and Kingfisher’s 36%:
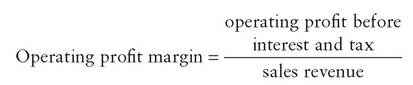
The operating profit margin is the ratio of profit, after the deduction of trading expenses but before the payment of interest on borrowings (financing charges) and corporation tax, to sales revenue. A figure of 6-8% would be typical for manufacturing industry, but supermarket chains, with high volumes and very competitive prices, might expect a ratio around 4%, which might still yield high absolute levels of operating profit. In fact, Tesco exhibited an encouraging result with a ratio of 6% (3,457/56,910). Kingfisher earned a similar percentage, whilst Alumasc, operating in the struggling housebuilding sector, only recorded 3%.
Return on capital employed (ROCE) and return on assets (ROA)
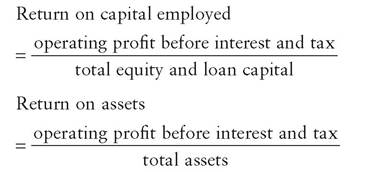
These two measures, known as ROCE and ROA respectively, are key indicators of company performance as measured by the profitability generated by, firstly, the company’s total value invested, whether by shareholders or long-term lenders, and, secondly, the total assets utilized in the period.
Measurement of the return on capital employed is a vital overall benchmark of company performance and is one of Tesco plc’s key indicators used internally to gauge progress from one year to the next. On this basis, the Tesco figure is 11.5%, i.e. 3,457/ (15,327 + 14,681), whereas Alumasc yields 5.8% and Kingfisher 9.7%.
Measurement of the rate of return on total assets offers a popular alternative assessment of profitability, particularly as it tests whether continual expansion (e.g. in opening new supermarkets in more countries) is a profitable venture. On this basis, the Tesco figure is 7.5%, i.e. 3,457/(34,258 + 11,765), whereas Alumasc yields only 4% and Kingfisher 6%.
Calculations of return on assets will clearly vary, sometimes substantially, with the basis used for measurement of those assets. This is a strong argument for using a standard approach and accountants are expected, under International Accounting Standard (IAS) 16 Measurement of property, plant & equipment and other standards, to reassess the value of non-current assets at regular intervals to avoid the use of outdated valuations.
A consideration of these profitability ratios, together with earlier information on gearing, operating and liquidity ratios, can give an overall impression of Tesco’s financial position in 2010. The company has maintained a relatively high profit margin and return on capital employed, whilst having a low gearing ratio. Its working capital situation would cause alarm in a different type of business, but the very fast throughput of inventory ensures that the cash flow (see Fig. 2.3) is more than adequate to meet liabilities as they fall due.
Cash flow statement
The usual accounting convention followed when preparing an income statement is that all relevant income and expenditure must be included, whether or not it resulted in a cash inflow or outflow in that period. Hence, sales revenue will include sales invoiced but not yet paid for (known as ‘receivables’) whilst cost of sales and other overheads include goods and services received from suppliers which are owing at the end of the financial year (‘payables’). Some expenses, notably depreciation, do not result in a cash flow. Also, a company might have major cash flows which are not reflected in the income statement - for example, loans might be issued or repaid in the period, share capital might be issued and non-current assets bought or sold. Profitability alone is not sufficient to ensure the survival of a company - its cash resources must be adequate to ensure that it can meet its liabilities when they fall due and take investment opportunities as they occur. Aggressive companies such as Tesco often show an overall cash flow that is considerably less than their profit (sometimes having an overall net cash outflow), as continuing expansion soaks up and possibly exceeds the net cash generated from trading.
Figure 2.3 shows Tesco’s cash flow statement for 2010. It shows an overall decrease in cash of £739m. Compare this with the retained profit for the same period of £2,327m as shown in its income statement. Operating activities generated over £4.7bn of cash, but interest payments (£690m), taxation (£512m), payment of dividends (£970m) and, most significantly, the repayment of borrowings (£3,601m) reduced the overall cash flow significantly.
Statement of changes in equity
This gives an overview of the various reasons (including the payment of dividends) for the changes in the ‘total equity’ as shown in the opening and closing balance sheets, and cuts through much of the fine detail presented elsewhere in the annual report. Equity represents the overall worth of the company as recorded in its accounting records at the balance sheet date, and is used in the ROCE calculation referred to previously.
Figure 2.4 shows Tesco plc’s statement, which, for 2010, indicates that the company’s total equity
Group Cash Flow Statement
| Year ended 27 February 2010 | 2010 | 2009 |
| £m | £m | |
| Cash flows from operating activities | 5,947 | 4,978 |
| Interest paid | (690) | (562) |
| Corporation tax paid | (512) | (456) |
| Net cash flow from operating activities | 4,745 | 3,960 |
| Cash flows from investing activities | ||
| Acquisition of subsidiaries, net of cash acquired | (65) | (1,275) |
| Proceeds from sale of property, plant and equipment | 1,820 | 994 |
| Purchase of property, plant and equipment and investment properties | (2,855) | (4,487) |
| Purchase of intangible assets | (159) | (220) |
| Net increase in loans to joint ventures | (49) | (272) |
| Investments in short-term and other investments | (1,918) | (1,233) |
| Proceeds from sale of short-term investments | 1,233 | 360 |
| Dividends received | 35 | 69 |
| Interest received | 81 | 90 |
| Net cash used in investing activities | (1,877) | (5,974) |
| Cash flows from financing activities | ||
| Proceeds from issue of ordinary share capital | 167 | 130 |
| Increase in borrowings | 862 | 7,387 |
| Repayments of borrowings | (3,601) | (2,733) |
| Repayments of obligations under finance leases | (41) | (18) |
| Dividends paid | (970) | (886) |
| Own shares purchased | (24) | (265) |
| Net cash from financing activities | (3,607) | (3,615) |
| Net (decrease) increase in cash and cash equivalents | (739) | 1,601 |
| Cash and cash equivalents at beginning of year | 3,509 | 1,788 |
| Effect of foreign exchange rate changes | 49 | 120 |
| Cash and cash equivalents at end of year | 2,819 | 3,509 |
Fig. 2.3 Group cash flow statement. Source: Tesco plc Annual Report 2010 (adapted).
Statement of Changes in Equity
| Issued share | Share | Retained | |||
| £m | capital | premium | earnings | Other | Total |
| At 28 February 2009 | 395 | 4,638 | 7,644 | 229 | 12,906 |
| Issue of shares | 4 | 163 | 167 | ||
| Profit for the year | 2,336 | 2,336 | |||
| Equity dividends authorised | (970) | (970) | |||
| Other adjustments | 38 | 204 | 242 | ||
| At 27 February 2010 | 399 | 4,801 | 9,048 | 433 | 14,681 |
Fig. 2.4 Tesco plc Statement of changes in equity. Source: Tesco plc Annual Report 2010 (adapted).
increased from £12,906m to £14,681m, mainly as a result of the year’s profit of £2,336m, less dividends of £970m.
Notes to the financial statements (including statement of accounting policies)
There is far more information contained in notes to the financial statements than within the balance sheet, income statement and cash flow statement. The notes always commence with a statement of the accounting policies adopted by the company (a short extract is shown in Fig. 2.5), and there then follow many pages of detailed information needed to comply with either relevant accounting standards and/or statutes (45 pages in Tesco’s 2010 Report). It is unusual for companies to give more than the minimum requirements (as that might be to a competitor’s advantage), but the auditors’ report (see Fig. 2.6 below) will confirm whether or not these minimum requirements have been met.
Auditors’ report
The auditors are required to report to shareholders (‘the members’) on whether the group accounts have been properly prepared, in accordance with accounting standards and relevant legislation, and whether they give a true and fair view of the activities of the company. Figure 2.6 shows Tesco plc’s report. The auditors may qualify their approval of the accounts if they feel that the records have not been well kept or if all the information they require is not available. Such qualifications usually fall into two categories: (1) those relating to accounting policy, and (2) those relating to unsatisfactory levels of information.
External sources of financial information
Of the various elements in the company accounts, the Business Review is probably the most widely read by non-specialists. None of the other elements, other than the year’s profit figure, despite the importance of the information contained, receives more than the passing attention of the average reader. Users of financial information still often prefer to use secondary sources of information, including those provided by the financial press and other external agencies. Two specific features are considered in detail below: the FTSE All-Share Index and data on individual share price movements.
FTSE All-Share Index: sector share movements
The FTSE All-Share Index3 integrates the movements of some 615 constituent shares, covering 10 sector groups (e.g. Telecommunications) and 39 individual sectors (e.g. Mobile Telecommunications). Figure 2.7 shows a small extract of the information provided. Various other indices and trends are published separately for each sector group, as well as for selected subsectors within those groups. The Index can be found in the ‘Companies and Markets’ section of the Financial Times, as part of that paper’s daily Share Service.
A comparison of sector index numbers with that for the All-Share Index allows the buoyant and depressed sectors to be quickly and clearly identified. For instance, of the sectors shown in the extract, mining companies have done extremely well (20,930.2) when compared with the depressed media sector, at only 3,955.8.
FT data on individual share movements
The individual company Share Information Service - of which Fig. 2.8 is an abstract - can usefully be viewed in conjunction with the All-Share Index. The performance of an individual company can then be assessed in the context of the performance of the industrial sector in which it operates.
Share (equity) price movements are published daily, with shares ordered alphabetically within particular industrial sectors. The price quoted is the middle price, i.e. midway between the buy and sell prices at the close of the market on the previous day. Figure 2.8 shows the specific information provided for Tesco plc in the food and drug retailers sector.
TESCO PLC
Note 1 Accounting Policies
GENERAL INFORMATION
Tesco PLC is a public limited company incorporated and domiciled in the United Kingdom under the Companies Act 2006 (Registration number 445790). The address of the registered office is Tesco House, Delamare Road, Cheshunt, Hertfordshire, EN8 9SL, UK. As described in the report of the Directors, the main activity of the Group is that of retailing, retailing services and financial services.
STATEMENT OF COMPLIANCE
The consolidated financial statements have been prepared in accordance with International Financial Reporting Standards (IFRS) and International Financial Reporting Interpretation Committee (IFRIC) interpretations as endorsed by the European Union, and those parts of the Companies Act applicable to companies reporting under IFRS.
BASIS OF PREPARATION
The financial statements are presented in Pounds Sterling, generally rounded to the nearest million. They are prepared on the historical cost basis except for certain financial instruments, share-based payments, customer loyalty programmes and pensions that have been measured at fair value. The accounting policies set out below have been applied consistently to all periods presented in these consolidated financial statements.
BASIS OF CONSOLIDATION
The Group financial statements consist of the financial statements of the ultimate parent Company (Tesco PLC), all entities controlled by the Company (its subsidiaries) and the Group's share of its interests in joint ventures and associates. Where necessary, adjustments are made to the financial statements of subsidiaries, joint ventures and associates to bring the accounting policies used into line with those of the Group.
USE OF ASSUMPTIONS AND ESTIMATES
The preparation of the consolidated financial statements requires management to make judgements, estimates and assumptions that affect the application of policies and reported amounts of assets and liabilities, income and expenses. The estimates and associated assumptions are based on historical experience and various other factors that are believed to be reasonable under the circumstances, the results of which form the basis of making judgements about carrying values of assets and liabilities that are not readily apparent from other sources. Actual results may differ from these estimates. The estimates and underlying assumptions are reviewed on an ongoing basis. Revisions to accounting estimates are recognised in the period in which the estimate is revised if the revision affects only that period, or in the period of the revision and future periods if the revision affects both current and future periods.
OPERATING PROFIT
Operating profit is stated after profit arising from property related items but before the share of results of joint ventures and associates, finance income and finance costs.
PROPERTY, PLANT AND EQUIPMENT
Property, plant and equipment assets are carried at cost less accumulated depreciation and any recognised impairment in value. Depreciation is provided on a straight-line basis to their residual value over the anticipated useful economic lives. The following depreciation rates are applied for the Group:
■ Freehold and leasehold buildings with greater than 40 years unexpired - at 2.5% of cost
■ Leasehold properties with less than 40 years unexpired are depreciated by equal annual instalments over the unexpired period of the lease
■ Plant, equipment, fixtures and fittings and motor vehicles - at rates varying from 9% to 50%.
Fig. 2.5 Notes to the financial statements: accounting policies.
Source: Tesco plc Annual Report2010 (adapted).
Independent auditors’ report to the members of Tesco PLC
We have audited the Group financial statements of Tesco PLC for the 52 weeks ended 27 February 2010 which comprise the Group Income Statement, the Group Statement of Comprehensive Income, the Group Balance Sheet, the Group Cash Flow Statement, the Group Statement of Changes in Equity and the related notes. The financial reporting framework that has been applied in their preparation is applicable law and International Financial Reporting Standards (IFRSs) as adopted by the European Union.
RESPECTIVE RESPONSIBILITIES OF DIRECTORS AND AUDITORS
As explained more fully in the Statement of Directors’ responsibilities set out on page 68, the Directors are responsible for the preparation of the Group financial statements and for being satisfied that they give a true and fair view. Our responsibility is to audit the Group financial statements in accordance with applicable law and International Standards on Auditing (UK and Ireland). Those standards require us to comply with the Auditing Practices Board’s Ethical Standards for Auditors.
This report, including the opinions, has been prepared for and only for the Company’s members as a body in accordance with Chapter 3 of Part 16 of the Companies Act 2006 and for no other purpose. We do not, in giving these opinions, accept or assume responsibility for any other purpose or to any other person to whom this report is shown or into whose hands it may come save where expressly agreed by our prior consent in writing.
SCOPE OF THE AUDIT OF THE FINANCIAL STATEMENTS
An audit involves obtaining evidence about the amounts and disclosures in the financial statements sufficient to give reasonable assurance that the financial statements are free from material misstatement, whether caused by fraud or error. This includes an assessment of: whether the accounting policies are appropriate to the Group’s circumstances and have been consistently applied and adequately disclosed; the reasonableness of significant accounting estimates made by the Directors; and the overall presentation of the financial statements.
OPINION ON FINANCIAL STATEMENTS
In our opinion the Group financial statements:
■ give a true and fair view of the state of the Group’s affairs as at 27 February 2010 and of its profit and cash flows for the 52 weeks then ended;
■ have been properly prepared in accordance with IFRSs as adopted by the European Union; and
■ have been prepared in accordance with the requirements of the Companies Act 2006 and Article 4 of the IAS Regulation.
Richard Winter (Senior Statutory Auditor)
for and on behalf of PricewaterhouseCoopers LLP
Chartered Accountants and Statutory Auditors
London
5 May 2010
Fig. 2.6 Tesco plc Auditors’ report.
Source: Tesco plc Annual Report2010 (adapted).
The FT of Friday 10 September (see Fig. 2.8) revealed that at the close of the previous day’s trading the Tesco share price stood at 417.95p, up 3.2 on that day. We can make a more thorough assessment of Tesco’s current position if we examine some of the technical headings of Figs 2.7 and 2.8, in conjunction with Tesco’s own annual report.
Price/earnings ratio: Tesco 16.1, sector 15.02, All-Share 14.22
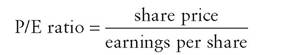
where earnings per share is profit after tax divided by the number of ordinary shares in issue. The price/
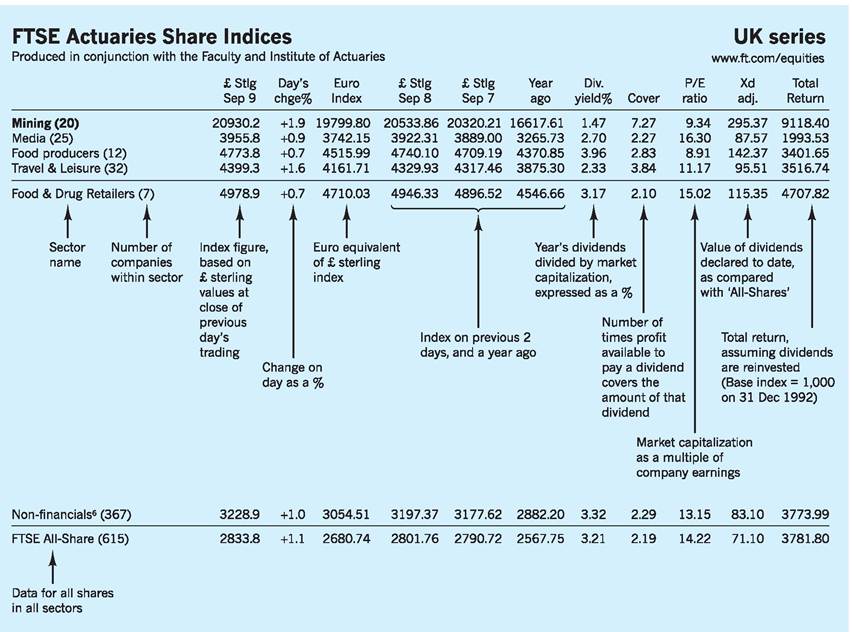
Fig. 2.7 (Extract from) FTSE actuaries share indices.
Source: Adapted from FTSE actuaries share indices, Financial Times, 10/09/2010.
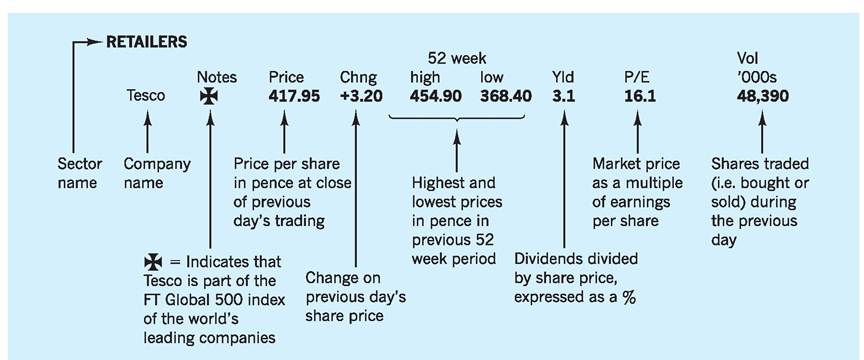
Fig. 2.8 FT Share Information Service.
Source: Adapted from FT Share Information Service, Financial Times, 10/09/2010.
earnings (P/E) ratio is the most important single measure of how the stock market views the company, and is the most common means of comparing the market values of different shares. The P/E ratio tells us the number of times the market price exceeds the last reported earnings. The more highly regarded the company, the higher its P/E ratio, with the market anticipating a sustained earnings performance over a lengthy future period. The P/E ratio will depend in part upon the company’s past record, but also upon that of the industrial sector of which it is a part, and upon the overall level of the stock market.
The sector figure of 15.02 for food retailers (see Fig. 2.7) is itself higher than the All-Share average (14.22), whilst Tesco’s own P/E ratio of 16.1 probably indicates market sentiment regarding Tesco’s dominant place within the sector whilst recognizing the intense competition from other retailers such as J. Sainsbury and Asda. Changes in future expectations will affect both share price and the P/E ratio, of which the share price is the numerator.
Dividend yield: Tesco 3.1%, sector 3.17%, All-Share 3.21%
This shows the return on the investment as a percentage of the share price:
The sector, the All-Share and Tesco’s yield are similar. This reflects the fact that the share prices of food retailers have kept broadly in line with the market as a whole. Therefore dividends as a percentage of the price to be paid for shares in such companies (the yield) are similar to companies in the same and other sectores.
These technical figures, particularly the P/E ratio and the dividend yield, provide an excellent indication of current company performance and prospects. If this FT information is used alongside the information contained within the annual report and information published in the financial press, then the shareholders will be better able to assess the management of their investment.
Conclusion
Various accounting ratios, properly understood, give useful insights into specific aspects of company performance. Taken together they can also provide a more general guide to overall company prospects. The content of the published accounts, together with external sources, notably the FT Share Information Service, provide an excellent basis for the assessment of company performance and the evaluation of investments.
Key points
■ All limited companies in the UK have to publish financial information.
■ All plcs have to appoint an independent auditor to report to the shareholders on the truth and fairness of the financial statements.
■ The majority of the financial information contained within the annual report is required by either legislation, Stock Exchange regulations or accounting standards.
■ There are three key financial statements: the balance sheet, the income statement and the cash flow statement.
■ The cash flow statement shows whether the company had a net cash inflow or outflow during the year. Even though a company may be profitable, it may fail through its inability to pay its debts or repay a loan (or loan interest).
■ The FTSE All-Share Index shows key information for nearly 40 sectors. Individual share information is found each day (except Sunday) in the Share Information Service pages of the Financial Times.
Now try the self-check questions for this chapter on the Companion Website. You will also find useful links to relevant websites.
Notes
1 Evidence suggests that in the majority of public companies, the controlling management has little or no stake in the ownership of the company. The directors of Tesco plc, for example, had beneficial ownership of only 0.17% of the company’s issued equity capital (13.3m shares out of a total issued share capital of over 7.9 billion).
2 Fixed-interest stocks issued by companies, usually redeemable at a set date, and backed by an agreement similar to a mortgage. Also known as ‘bonds’.
3 The FTSE All-Share Index is an arithmetic average of price relatives weighted to reflect the market valuation of the shares included. It represents nearly all of the UK stock market value. The index is the aggregation of the FTSE 100, FTSE 250 and FTSE Small Cap Indexes.
References and further reading
Atrill, P. and McLaney, E. (2008) Accounting and Finance for Non-specialists (6th edn), Harlow, Financial Times/Prentice Hall.
Black, G. (2009) Introduction to Accounting and Finance, Harlow, Financial Times/Prentice Hall. Financial Times (2010a) FT Share Service, 10 September, London.
Financial Times (2010b) FTSE Actuaries Share Indices, 10 September, London.
Holmes, G., Sugden, A. and Gee, P. Interpreting Company Reports, Harlow, Financial Times/ Prentice Hall.
International Accounting Standard (2005) 16: Measurement of Property, Plant & Equipment, London.
McKenzie, W. (2009) FT Guide to Using and Interpreting Company Accounts, Harlow, Financial Times/Prentice Hall.
Tesco plc (2010) Annual Report and Reviews 2010, Cheshunt.
Watson, D. and Head, A. (2010) Corporate
Finance: Principles and Practice (5th edn),
Harlow, Financial Times/Prentice Hall.
The following websites are relevant to this chapter:
Tesco plc: http://www.tesco.com/corporateinfo Kingfisher plc: http://www.kingfisher.com The Alumasc Group plc: http://www.alumasc. co.uk
FTSE: http://www.ftse.com
The International Accounting Standards Board:
http://www.iasb.co.uk