Thinking ahead about the trade impact of COVID-19
Richard Baldwin and Eiichi Tomiura
Graduate Institute, Geneva and CEPR; Hitotsubashi University
COVID-19 is a supply shock and it is a demand shock. Both aspects will impact international trade in goods and services.
This chapter is an attempt to think ahead about the trade effects using history and economic logic to guide the forward-looking effort. The key takeaway is that the virus is likely to be as ‘contagious’ economically as it is medically.A few background facts are worth keeping in mind when thinking ahead about the trade effects.
• First, previous, post-war pandemics have generally affected much less economically important nations. This one is different.
As of 2 March 2020, the nations with the most reported cases include (in order) China, Korea, Italy, Japan, US, and Germany - with the cases growing rapidly especially in the US, Italy, and Germany. These six hard-hit nations account for:
• about 55% of world supply and demand (GDP)
• about 60% of world manufacturing, and
• 50% of world manufacturing exports.
Table 1 Large economies and COVID-19 (updated 29 February 2020)
| GDP | Manufacturing | Exports | Manufactured exports | COVID-19 cases | |
| US | 24% | 16% | 8% | 8% | 0.1% |
| China | 16% | 29% | 13% | 18% | 85.2% |
| Japan | 6% | 8% | 4% | 5% | 0.3% |
| Germany | 5% | 6% | 8% | 10% | 0.2% |
| UK | 3% | 2% | 2% | 3% | 0.1% |
| France | 3% | 2% | 3% | 4% | 0.2% |
| India | 3% | 3% | 2% | 2% | 0.0% |
| Italy | 2% | 2% | 3% | 3% | 2.7% |
| Brazil | 2% | 1% | 1% | 1% | 0.0% |
| Canada | 2% | 0% | 2% | 2% |
Sources: World Bank's World DataBank, WHO.int.
Plainly, supply disruptions and demand shocks in these nations will have global repercussions.
• Second, if the virus and accompanying preventative policies induce an important aggregate demand slowdown in these six nations, world trade will slow substantially.
The effect is likely to be amplified since, in past recessions, global trade has slowed faster than global growth. This outcome was especially marked during the 2008-09 Great Trade Collapse.
• Third, in addition to being global giants, the manufacturing sectors of the six hard- hit economies are at the heart of a myriad of international supply chains; each is an important supplier of industrial inputs to each other and to third nations.
For example, industrial parts and components made in China are important to manufacturing processes in most nations in the world. Thus a supply shock in these six nations is likely - via the trade in intermediate goods - to create what might be called ‘supply chain contagion’, i.e. the supply shock in the hard-hit six will create supply shocks in in most nations - even those that are much less touched by the pandemic. This channel was shown to be important in Great Trade Collapse of ten years ago (Bems et al. 2010, Yi 2009, Alessandria et al. 2010, Altomonte et al. 2012).
Manufacturing sector gets a triple hit
An important point is that manufacturing is special. Manufactured goods are - on the whole - ‘postpone-able’ purchases. As we saw in the Great Trade Collapse of 2009, the wait-and-see demand shock impacts durable goods more than non-durable goods. In short, the manufacturing sector is likely to get a triple hit.
1. Direct supply disruptions hindering production since the disease is focused on the world’s manufacturing heartland (East Asia), and spreading fast in the other industrial giants - the US and Germany.
2. Supply-chain contagion will amplify the direct supply shocks as manufacturing sectors in less-affected nations find it harder and/or more expensive to acquire the necessary imported industrial inputs from the hard-hit nations, and subsequently from each other.
3. Demand disruptions due to (1) macroeconomic drops in aggregate demand, i.e. recessions, and (2) precautionary or wait-and-see purchase delays by consumers, and investment delays by firms.
Of course, the service sector in all affected countries are hit hard - as restaurants and movie theatres empty out - but it may well be the manufacturing that takes the biggest hit.
Supply and demand shock effects on aggregate trade flow
The gravity equation is one of economists’ most reliable empirical relationships. It models the value of exports from one nation (the origin nation) to another (the destination nation) as depending positively upon the destination’s aggregate demand (as measured by its GDP) and the origin’s aggregate supply (as measured by its GDP). The product of GDPs is divided by the bilateral distance to reflect frictions.
As distances don’t change, shocks to bilateral exports fall neatly into supply shocks (changes in the GDP of the origin nation, i.e. the seller) and demand shocks (changes in the GDP of the destination nation, i.e. the buyer). Thinking ahead, this decomposition suggests two aggregate trade implications:
1. To the extent that COVID-19 is a supply shock, exports will fall, and they will fall most in the nations that are most severely hit.
2. To the extent that COVID-19 is a demand shock, imports will fall, and they will fall most in the trade partners of the nations that are most severely hit.
Given their economic importance, sizeable demand and supply shocks in these the six hardest-hit nations are almost sure to trigger large drops in trade flows at the global level.
'Supply-side contagion' via international supply chains
As of early March 2020, the COVID-19 epidemic was very much centred in China, with over 90% of reported cases located there. The two next hardest hit nations are Japan and Korea. These observations are pertinent since China, Japan and Korea are central to the global supply chains in most manufactured goods.
China itself has become, over the past few decades, something like the ‘OPEC for industrial inputs’, i.e. a critical supplier of inputs used in industries around the world. This is illustrated in Figure 1, which focuses on textiles to take concrete examples.[28]In the diagram, the size of the bubble reflects the size of the country in terms of the trade flows considered, and the thickness of the connecting arrows show the relative importance of particular bilateral flows. Small flows are zeroed out for clarity. The diagram looks only at trade in intermediate inputs used in the textile sector.
Two features are notable when it comes to thinking about COVID-19’s supply chain contagion.
• First, China really is the workshop of the world when it comes to textile sector inputs - it is central to the entire global network of trade and production.
• Second, there is a very strong regional dimension shown. When it comes to textiles, Italy is the heart of ‘Factory Europe’; China is the heart of ‘Factory Asia’, and the US is the heart of ‘Factory North America’. There are no hubs in Africa and South America.
The second figure shows the same information for intermediate goods used in information and communication technology (ICT) goods sectors. The stark differences between Figures 1 and 2 serve as a warning to analyst who would over generalise.
Figure 1 Three interconnected hubs in the world's supply chain for textiles
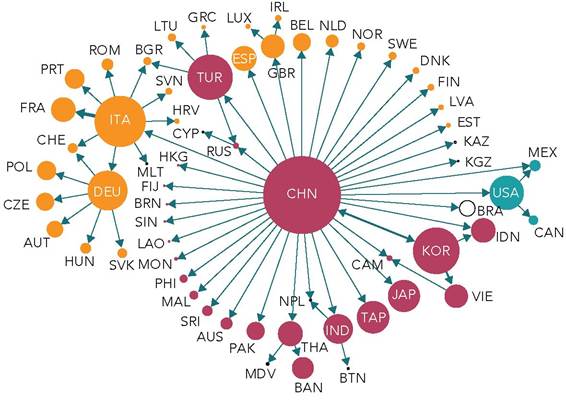
Source: WTO Global Value Chain Development Report 2019.
Figure 2 Three interconnected hubs in the world’s supply chain for ICT goods
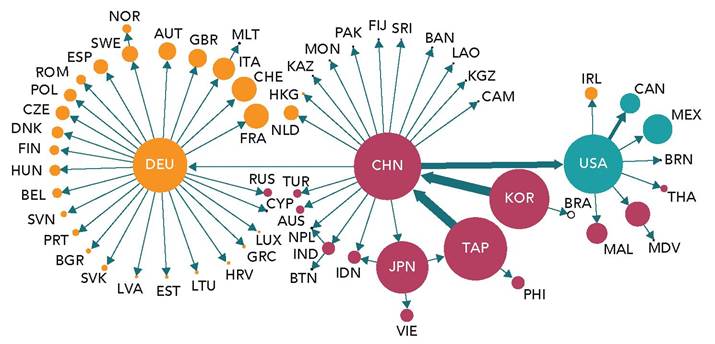
Source: WTO Global Value Chain Development Report 2019.
Supply linkages are very different in different sectors. In the ICT sector, for example, we see the centrality of China, but there are important nuances.
• Japan, Korea, Taiwan and China are basically co-hubs in ‘Factory Asia’ when it comes to ICT goods.
• The regionality of supply chains is stronger in ICT than in textiles. We note that for trade overall, the regionality is even more highly marked.
The upshot of these points is that supply-side contagion is very likely. Supply disruptions in East Asia’s manufacturing sectors are very likely to hurt manufacturing sectors of other nations all around the world.
Anecdotal evidence for such contagion already appearing is abundant. A recent article in Barron’s, for example, quotes the CEO of company that provides supply-chain software:
“In the last two decades, China became the factory of the world,” says Girish Rishi. “Consumer packaged goods, automotive, apparel, high-tech. I can’t tell you which sector is not getting impacted.”
The three hard-hit East Asian manufacturing giants, China, South Korea, and Japan, account for over 25% of US imports, and over 50% of US imports of computer and electronics products. Quoted in the same article, an analyst at the consulting firm Cowen, John Kernan, noted that apparel and footwear companies are particularly vulnerable to East Asian supply disruptions.
The Economist magazine pointed to vulnerability of the electronics industry with its practice of keeping very lean inventory levels and the lack of alternative sources for many electronic components. The optics sector is likewise highly exposed. The heart of the outbreak, Hubei province, is known as China’s ‘optics valley’ since so many firms manufacturing fibre optic components are located there (these are essential inputs for telecoms networks). Something like a quarter of the world’s optical-fibre cables and devices are in the province. Hubei is also the location of highly advanced microchipfabrication factories (these make the flash memory chips used, e.g. in smartphones). The Economist cites analysts who conjecture that the epidemic in Hubei alone could knock 10% off worldwide shipments of smartphones.[29]
The automobile sector, especially in East Asia, is already significantly disrupted by ruptures in international supply chains.
For example, a shortage of parts coming from China has forced Korean carmaker Hyundai to shut all its car plants in Korea. The Japan firm Nissan closed a factory in Japan temporarily. The shock has even reached Europe. Fiat-Chrysler has recently warned that it could soon halt production at one of its European factories. Jaguar Land Rover, a UK-based auto company, announced it might to run out of parts from the end of February. To stave this off, it has flown in emergency supplies from China in suitcases.[30]Data on supply-chain linkages
International supply-chain linkages are easy to document at the aggregate level, thanks to the OECD’s Trade in Value Added Data base. Table 2 shows the interdependence of nations when it comes to where things are made. The focus is on the source of the things that a nation buys both directly and indirectly. For instance, the US imports many things from the China - and this via three basic routes. The first is the direct import of final goods made in China. An adjustment, however, is made for the fact that some fractions of US imports from China are actually made in other nations. For instance, China may source sophisticated optical components from Japan to put into cameras it exports to the US.
The second is the import by US firms of Chinese parts and component that are then combined by US manufactures into things US firms and consumers buy. For example, China may sell electric motors US firms that incorporate them in remote-controlled gates installed on American driveways. The last route includes the Chinese parts that are incorporated into goods the US buys from third nations. For example, the Mexican car industry, which sells a lot to the US, buys lots of parts from China.
Table 2 shows the result of these calculations. What it demonstrates is that the goods and parts produced the US, Germany (DEU), China (CHN), and Japan (JPN) are massively important in the expenditure on all major nations. In all the nations listed, China’s value added accounts for no less than 3% of final expenditure. Notice that there is strong regional reliance in the numbers. Especially in North America, the US is dominant for Canada and Mexico, as are China and Japan in East Asia. The big European manufacturers, the UK, Germany, France and Italy (especially Germany), are key suppliers to other European nations.
The obvious implication is that supply disruption in the US, Germany, China, or Japan could have large effects on consumers and firms in all the major economies. The same is true, but less so, for the UK, France, Italy, and Korea.
Table 2 Where do goods come from? Source of direct and indirect value added in the purchases
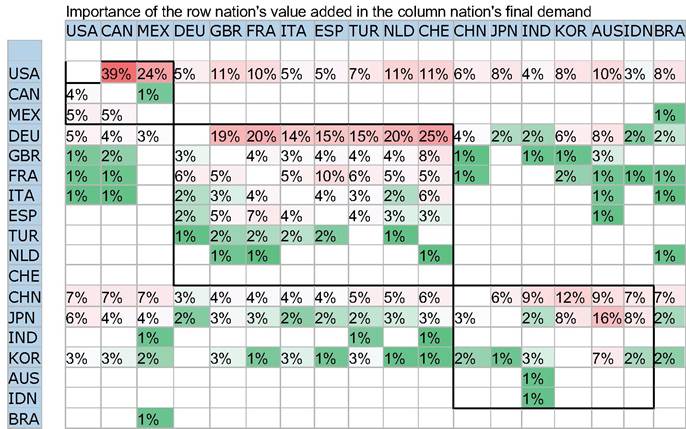
Note: USA = US, CAN = Canada, MEX = Mexico, DEU = Germany, GBR = UK, FRA = France, ITA = Italy, ESP = Spain, TUR = Turkey, NLD = Netherlands, CHE = Switzerland, CHN = China, JPN = Japan, IND = India, KOR = Korea, AUS = Australia, IDN = Indonesia, BRA = Brazil.
Trade in services
Some trade in services - like airplane travel, hotel rentals, and tourism - have already been hit hard by both the supply-side and demand-side aspects of COVID-19. Other services - say financial services and medical services - are much less like to be disrupted. Overall, it seems that the shock will encourage remote, tele-intermediated interpersonal interactions. Since these interactions are the heart and soul of many services, COVID-19 may well end up increasing trade in services.
How bad could it get? Lessons from past global trade shocks
The Global Crisis of 2008-09 produced what came to be known as the Great Trade Collapse. It occurred between the third quarter of 2008 and the second quarter of 2009. It was, and still is, the steepest fall of world trade in recorded history, and the deepest fall since the Great Depression. The drop was sudden, severe, and synchronised.
Global trade has dropped a few times since WWII, but the 2008-09 hit was by far the largest. As Figure 1 shows, global trade fell for at least three quarters during three of the worldwide recessions that have occurred since 1965 - the oil-shock recession of 1974-75, the inflation-defeating recession of 1982-83, and the Tech-Wreck recession of 2001-02.
Figure 3 Quarter-on-quarter growth, world imports volume, 1965 to 2019 Q3
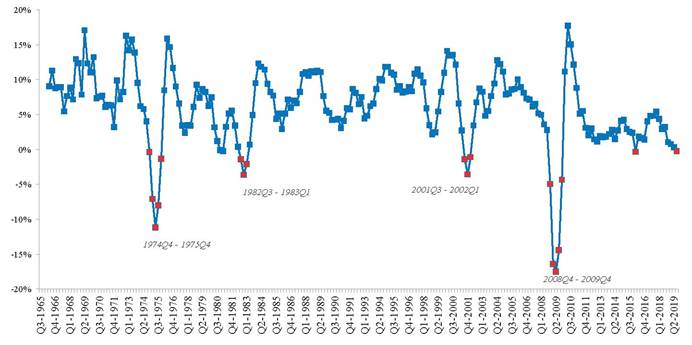
Source: Authors' elaboration on WTO online data; www.WTO.org.
Is seems at this point unlikely that COVID-19 would hit the world economy as hard and as broadly as the Global Crisis did in 2008-09, but the evidence from that experience provides an outer limit on the range of likely outcomes this time. It is also worth noting that the trade contract was sharp, but not particularly short. The global numbers stayed in negative territory for more than a year.
Another important difference was that the 2008-09 trade collapse was largely a demandside event. There was some direct supply-side damage from the financial crisis, but mostly in the banking and finance side. The industrial damage (e.g. Chrysler went bankrupt) was due to the recession rather than the crisis shock per se.
Published studies of the causes of the Great Trade Collapse provide important hints about what may unfold going forwards. There were three leading hypotheses for what may have caused the collapse as follows: (1) a decline in aggregate demand for all goods, including imports; (2) difficulties in obtaining trade finance; and (3) rising trade barriers (Crowley and Luo 2011).
The received wisdom is that the collapse was due mostly to the demand shock - especially for ‘postpone-able’ goods (Eaton et al. 2009, Benassy-Quere et al. 2009, Levchenko et al. 2009). That is, since a large fraction of trade is in durable goods, exports tend to be two to three more times volatile than GDP (Engel and Wang 2011).
On top of this, a so-called ‘bullwhip’ effect operates for intermediate good producers (Zavacka 2012). A drop in demand for final goods leads each producer in the value chain to empty their inventories before re-ordering. The result is that the demand shock gets amplified for firms further up the supply chain. The role of GVCs has also be shown to be important (Bems et al. 2010, Yi 2009). Firm-level evidence for this was presented by Alessandria et al. (2010) and Altomonte et al. (2012).
As to the supply-chain contagion, Bems et al. (2010) use a global input-output framework to quantify US and EU demand spillovers and the elasticity of world trade to GDP during the global recession of 2008-2009. They find that 20-30% of the decline in the US and EU demand was borne by foreign countries, with NAFTA, emerging Europe, and Asia hit hardest
As to the two other mechanisms, Crowley and Luo (2011) conclude that there is almost no evidence that trade policy barriers rose during the period of trade collapse and recovery. Bricongne et al. (2012), and Chor and Manova (2010) find that the overall impact of credit constraints on trade was limited.
Concluding remarks
There is a danger of permanent damage to the trade system driven by policy and firms’ reactions. The combination of the US’ ongoing trade war against all of its trading partners (but especially China) and the supply-chain disruptions that are likely to be caused by COVID-19 could lead to a push to repatriate supply chains. Since they supply chains were internationalised to improve productivity, their undoing would do the opposite. We think this would be a misthinking of the lessons.
Exclusively depending on suppliers from any one nation does not reduce risk - it increases it. In Japan, for example, it would not only escalate costs but also expose production to the risk that the next earthquake could be bigger than that of 2011; such a quake is predicted to occur with high probability sometime in the next century.
We should not misinterpret pandemic as a justification for anti-globalism. Redundant dual sourcing from multiple countries alleviates the problem of excess dependence on China, though with additional costs. Japanese multinationals have already begun diversifying the destinations of foreign direct investment away from China in recent years, not foreseeing COVID-19 but prompted by Chinese wage hikes. We hope more intensive use of ICT enables firms to more effectively coordinate global sourcing.
References
Alessandria, G, J P Kaboski and V Midrigan (2010), “The great trade collapse of 200809: An inventory adjustment?”, IMF Economic Review 58(2): 254-294.
Altomonte, C, F Di Mauro, G Ottaviano, A Rungi and V Vicard (2012), “Global value chains during the great trade collapse: a bullwhip effect?”, in Firms in the international economy: Firm heterogeneity meets international business, pp.277-308.
Baldwin, R (ed.) (2009), The Great Trade Collapse: Causes, Consequences and Prospects, CEPR Press.
Bems, R, R C Johnson and K M Yi (2010), “Demand spillovers and the collapse of trade in the global recession”, IMF Economic Review 58(2): 295-326.
Benassy-Quere, A, Y Decreux, L Fontagne and D Khoudour-Casteras (2009), Economic crisis and global supply chains.
Bricongne, J C, L Fontagne, G Gaulier, D Taglioni and V Vicard (2012), “Firms and the global crisis: French exports in the turmoil”, Journal of international Economics 87(1): 134-146.
Chor, D and K Manova (2012), “Off the cliff and back? Credit conditions and international trade during the global financial crisis”, Journal of International Economics 87(1): 117-133.
Crowley, M and X Luo (2011), “Understanding the Great Trade Collapse of 2008-09 and the subsequent trade recovery”, Economic Perspectives 35(2): 44.
Eaton, J, S Kortum, B Neiman and J Romalis (2016), “Trade and the global recession”, American Economic Review 106(11): 3401-38.
Engel, C and J Wang (2011), “International trade in durable goods: Understanding volatility, cyclicality, and elasticities”, Journal of International Economics 83(1): 3752.
Levchenko, A A, L T Lewis and L L Tesar (2010), “The collapse of international trade during the 2008-09 crisis: in search of the smoking gun”, IMF Economic Review 58(2): 214-253.
O’Rourke, K H (2018), “Two great trade collapses: the interwar period and great recession compared”, IMF Economic Review 66(3): 418-439.
Yi, K M (2009), “The collapse of global trade: the role of vertical specialization”, in The collapse of global trade, murky protectionism, and the crisis: Recommendations for the G20, pp.45-48.
Zavacka, V (2012), “The bullwhip effect and the Great Trade Collapse”, ERBD Working Paper No. 148.
About the authors
Richard Baldwin has been Professor of International Economics at the Graduate Institute in Geneva since 1991 and Editor-in-Chief of VoxEU.org since he founded it in 2007. He was President/Director of CEPR (2014-2018), and a visiting professor at Oxford (2012-2015), and MIT (2003). He has served as Managing Editor of Economic Policy (2000 to 2005), Policy Director of CEPR (2006-2014) and Programme Director of CEPR’s International Trade programme (1991 to 2001). Before moving to Switzerland in 1991, he was a Senior Staff Economist for the President’s Council of Economic Advisors in the Bush White House (1990-1991), following trade matters such as the Uruguay Round and NAFTA negotiations, as well as numerous US-Japan trade conflicts.
He has been an adviser and consultant to many international organisations and governments. He did his PhD in economics at MIT with Paul Krugman and has published a half dozen articles with him. Before that he earned an MSc at LSE (1980-81), and a BA at UW-Madison (1976-1980). The author of numerous books and articles, his research interests include international trade, WTO, globalisation, regionalism, global value chains, and European integration.
Eiichi Tomiura is a professor at the Faculty of Economics, Hitotsubashi University and a faculty fellow and program director at the Research Institute of Economy, Trade and Industry in Japan. Prior to his current position, he was formerly Dean, College of Economics at Yokohama National University. He was also served for Ministry of International Trade and Industry (MITI), Government of Japan till 2000. He earned his Ph.D. in Economics from the Massachusetts Institute of Technology in 1992 and his B.A. in Economics from University of Tokyo in 1984.His research expertise is in empirical international trade, especially offshore outsourcing with firm-level data. His articles have been published in many journals including Journal of International Economies, Review of International Economics, and Regional Science and Urban Economics. He has received Economist Award, Nikkei Prize, and Kojima Kiyoshi Prize in Japan.
6