CARROLL’S DIAGRAMS
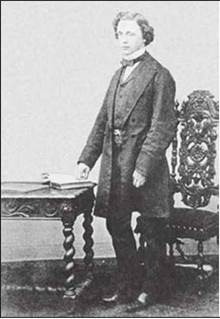
Lewis Carroll was the pen name of the Oxford professor and author Charles Dodgson (1832-98).
Although he was a logician by profession, he became internationally famous for his whimsical children’s books, Alice’s Adventures in Wonderland, Through the Looking Glass, etc. His diagrams are contained in his posthumously published Symbolic Logic, ed. W.W. Bartley III, which also contained perhaps the earliest elaboration of the idea of truth trees or semantic tableaux (see chapters 14 and 23). This portrait of Carroll is from about 1860.In the nineteenth century certain deep correspondences between mathematics and logic were discovered by thinkers familiar with abstract algebra. At around mid-century, building on pioneering work of the English logicians Augustus De Morgan and George Boole, John Venn systematized and popularized a way of presenting categorical logic by means of the diagrams now named after him. Shortly afterwards Lewis Carroll proposed a related system of diagrams that are in some respects superior to the familiar Venn diagrams, and it is a modified version of these that I shall present here.
The basic idea is that each category or predicate term, such as “foxes” or “animals of the dog family,” corresponds to a class of individuals. The individuals in question are whatever we are talking about, and they belong to an all-encompassing class, the so-called universe of discourse. This may be a somewhat larger class—in this case, say, animals—or it may be supposed to be all individuals whatsoever.
The universe of discourse, (UD), is the class of all the individuals under discussion, those to which the predicates may or may not apply.
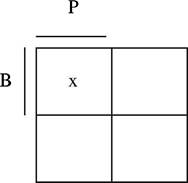
In the Carroll diagram technique, we represent the universe of discourse as a square, and then divide it into 4 distinct square regions.
The top two squares represent, say, foxes (F), and the bottom two, animals that aren’t foxes (F). Similarly, the left two squares could represent animals of the dog family (D), and the right two, animals not of the dog family (D). Thus the top Ieftrepresents foxes that are animals of the dog family (FD), the top right foxes that are not animals of the dog family (FD), the bottom left non-foxes that are animals of the dog family (FD), the bottom right animals that are neither foxes nor members of the dog family (FD):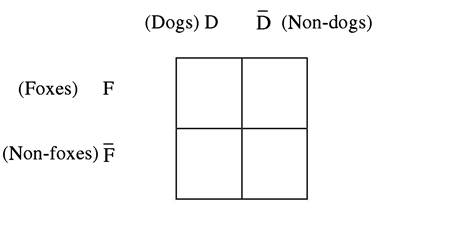
Here it should be emphasized that we do not know whether any animals exist in any of these classes, and we shall assume them all to be empty unless told otherwise. Now we can fill in information in these diagrams to represent categorical statements, proceeding as follows. If we know there is an individual in a given region, we put an x (standing for an arbitrary individual) in this region. If we know there is no individual in a given region, we put a 0 (for zero) in that region.[LXII] This gives:
A-statements
e.g., All FOXES are DOGS. To say “All foxes are dogs” is to say that there aren’t any fox/non-dogs, i.e., that the top right square FD is empty. So we put a 0 in that square:
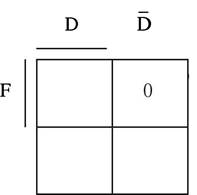
Note that this does not give us any information about non-foxes; nor does it tell us whether there are any foxes (more on this later!).
E-statements
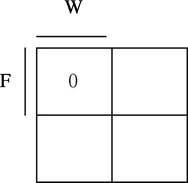
e.g., No FROGS are WARM-blooded.
To say “No frogs are warm-blooded” is to say that there aren’t any warm-blooded frogs, i.e., that the top left square is empty. So we put a 0 in that square:
!-statements
e.g., Some BACTERIA are PARASITES.
Here we are asserting that there is at least one individual that is a bacterium and a parasite, so we put an X in the BP square:
O-statements
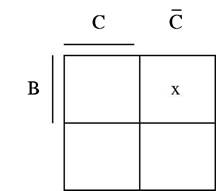
e.g., Some BAGMEN are not CROOKS.
Here we are asserting that there is at least one individual that is a bagman and not a crook, so we put an X in the BC square:
15.2.2