ILLUSTRATION 7
Directions for Questions 1 to 3: In the network diagram above, the figures represent the flow of natural gas through pipelines between major cities A, B, C, D & E (in suitable units).
Assume that supply equals demand in the network (although not on individual nodes).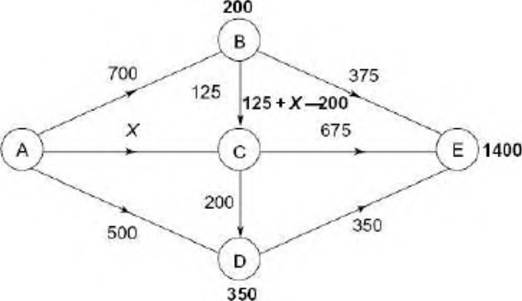
In the network diagram above, the figures represent the flow of natural gas through pipelines between major cities A, B, C, D & E (in suitable units). Assume that supply equals demand in the network (although not on individual nodes).
1. What is the number of units demanded at B?
(a) 175 (b) 200
(c) 225 (d) 250
2. If the number of units demanded in C is 225, what is the value of x?
(a) 975 (b) 875
(c) 775 (d) 950
3. What is the demand in D?
(a) 300 (b) 350
(c) 375 (d) 450
Sol. Refer to the following figure for the solution:
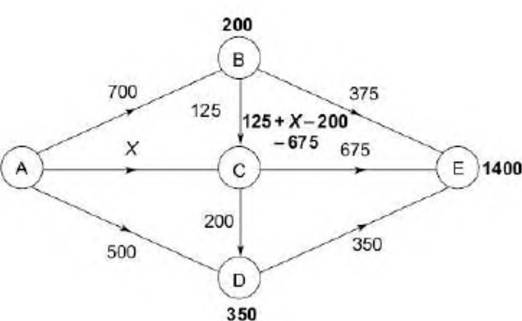
1. Fromthe figure it would be 700 - (375 + 125) = 200. Option (b) is correct.
2. 125 + X- 200 - 675 = 225 √zE X= 975. Option (a) is correct.
3. 500 + 200 - 350 = 350. Option (b) is correct.