Dynamic Simulations of a Calibrated Blanchard-Weil Model
It is illuminating to investigate further the dynamic properties of the Blanchard-Weil model and get a quantitative feel for the effects of the various parameters. To do so, let us simulate specific cases of the process of dynamic adjustment from one balanced growth path to another when there is an exogenous permanent change in specific parameters (such as the pure rate of time preference, total factor productivity, or population growth).
To simulate the model, we shall convert it from a continuous time model to a discrete time model.5.3.1 The Blanchard-Weil Model in Discrete Time
It is straigthforward to show that, in terms of efficiency units of labor, the discrete time versions of the consumption growth equation (5.43) and the capital accumulation equation (5.44) of the Blanchard-Weil model take the form

For a Cobb-Douglas production function yt = A(kt)α, these equations can be rewritten as
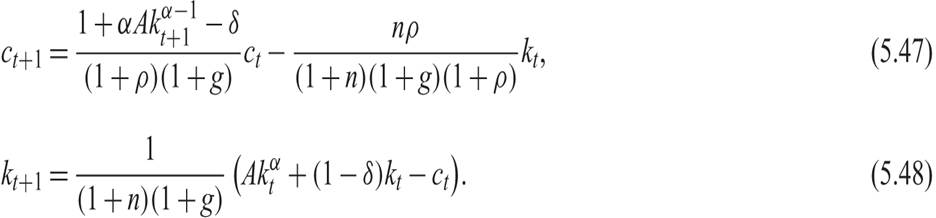
Equations (5.47) and (5.48) determine the adjustment path for consumption and capital per efficiency unit of labor. After we determine the adjustment path for these two variables, the path of real output can be calculated from the production function, and the paths of the real interest rate and the real wage are then obtained from the marginal productivity conditions for capital and labor.
5.3.2 Dynamic Simulations of the Model
The parameter values used to calibrate the model are A = 1, α = 0.333, ρ = 0.02, n = 0.01, g = 0.02, δ = 0.03. These values are the same as the ones used for the Ramsey model in chapter 4. They are also consistent with the values used for the Solow model in chapter 3 and the Diamond model in the first part of this chapter.
We consider three alternative scenarios. A permanent increase in the pure rate of time preference of the households ρ by 1% (from 0.02 to 0.0202), a permanent rise in the rate of population growth n by 1% (from 0.01 to 0.0101), and a permanent increase in total factor productivity A by 1% (from 1 to 1.01). The results of the simulations are presented in figures 5.10–5.12.
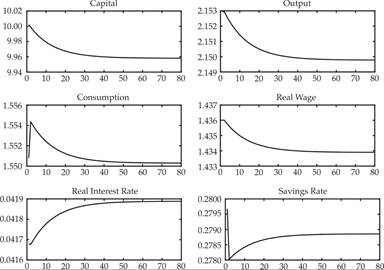
Figure 5.10 Impulse response functions for a 1% increase in the pure rate of time preference in the calibrated Blanchard-Weil model.
In the simulation shown in figure 5.10, the economy is on its original balanced growth path, and after period 1, the pure rate of time preference of households ρ rises permanently and unexpectedly by 1% (from 0.02 to 0.0202). This increase leads directly to an increase in consumption which then declines, a decline in the savings rate, a gradual decumulation of physical capital, a gradual decline in output, a gradual decline in real wages, and a gradual increase in the real interest rate. The reason for declining real wages is the gradual reduction of the marginal product of labor caused by the falling capital stock; the real interest rate increases, because the marginal product of capital gradually increases due to the decumulation of capital. The economy gradually converges to a new balanced growth path. On this new path, capital per efficiency unit of labor is lower by about 0.4%, output and real wages by 0.1%, consumption by 0.03% (due to the decline in the savings rate). The real interest rate has increased by 0.02 the same as the increase in the pure rate of time preference. The steady state savings rate, which is endogenous in this model, falls from 28.0% to 27.9%.
In the simulation shown in figure 5.11, the economy is on its original balanced growth path, and after period 1, the rate of population growth n rises permanently and unexpectedly by 1% (from 0.01 to 0.0101).
This increase leads directly to a decline in consumption; an increase in the savings rate; but a gradual decumulation of capital, as the decline in consumption is smaller than the one required to keep capital per efficiency unit of labor constant. The gradual decline in capital leads to a gradual decline in output, a gradual decline in real wages, and a gradual increase in the real interest rate. The reason for declining real wages is the gradual reduction of the marginal product of labor caused by the falling capital stock. The real interest rate increases, because the marginal product of capital gradually increases due to the decumulation of capital. The economy gradually converges to a new balanced growth path. On the new balanced growth path, capital per efficiency unit of labor is lower by about 0.03%, output and real wages by 0.01%, consumption by 0.07% (due to the increase in the savings rate), while the real interest rate has increased by 0.01 percentage points. The steady state savings rate, which is endogenous in this model, rises from 27.97% to 28.01%.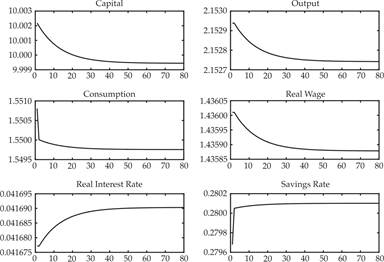
Figure 5.11 Impulse response functions for a 1% increase in the population growth rate in the calibrated Blanchard-Weil model.
In the simulation shown in figure 5.12, the economy is initially on its original balanced growth path. After period 1, total factor productivity A rates rises permanently and unexpectedly by 1% (from 1 to 1.01). This increase leads to an immediate increase in production, consumption, savings, and the marginal product of both labor (the real wage) and capital (the real interest rate). The increase in savings causes a gradual accumulation of capital, which leads to a further gradual increase in production and consumption, a further gradual increase in the real wage, but a gradual fall in real interest rates. The reason for the falling real interest rate is the gradual reduction of the marginal product of capital caused by the accumulation of capital.
The economy gradually converges to a new balanced growth path. On this path, capital per efficiency unit of labor has increased by about 1.5%, output, consumption, and real wages are also higher by 1.5%, while the real interest rate has returned to a level very near its original equilibrium. The increase in total factor productivity by 1% leads to an increase in real income by 1.5% (i.e., more than 1%), because productivity growth causes a temporary increase in the savings rate and capital accumulation, which in turn causes additional induced increases in real incomes and consumption.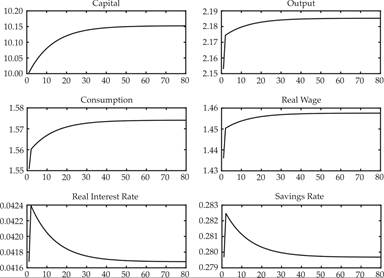
Figure 5.12 Impulse response functions for a 1% increase in total factor productivity in the calibrated Blanchard-Weil model.
The dynamic behavior of the OLG model of Blanchard and Weil is similar to the dynamic behavior of the representative household model and the Diamond OLG model.
However, note that, as the theoretical analysis suggests, the savings rate in the OLG model is lower than that in the corresponding representative household model. For exactly the same parameter values, the steady state savings rate in the perpetual youth model is 28%, whereas the corresponding savings rate in the representative household model of chapter 4 is equal to 28.5.
The higher savings rate in the representative household Ramsey model results in a higher steady state capital stock, real output, consumption, and real wages, compared to the Blanchard-Weil OLG model. In contrast, the steady state real interest rate is lower in the representative household model.
For the initial values of the parameters used in the simulations, capital per efficiency unit of labor on the balanced growth path is equal to 10.275 in the representative household model and only 10.002 in the corresponding OLG model (higher by 2.73%). Real income per efficiency unit of labor is equal to 2.172 in the representative household model, compared to 2.153 in the corresponding OLG model (higher by 0.9%).
The same applies to steady state real wages, which are higher by 0.9% in the representative household model. The difference in consumption is 0.2% for the model of the representative household because of the higher savings rate. Finally, due to the lower capital stock per efficiency unit of labor, the real interest rate on the balanced growth path is 4.2% in the OLG model, compared to 4% in the corresponding representative household model.As we see from these simulations, the dynamic behavior of the Blanchard-Weil OLG model is qualitatively similar to the dynamic behavior of the Ramsey and Diamond models. In addition, despite the prediction that the savings rate is not constant along the adjustment path (as assumed in the Solow model), in all other respects, the predictions of the Blanchard-Weil model about the adjustment path are very similar to the predictions of the Solow model.
5.4