Key Facts about Long-Run Economic Growth
To examine the key facts about long-run economic growth, we first review current cross-country differences in living standards and then survey the evolution of living standards over time for some economies.25
Living standards are usually measured by annual gross national income (GNI) per capita or annual gross domestic product (GDP) per capita.
However, to perform cross-country comparisons, per capita income must be measured in comparable units. This requires the transformation of per capita incomes in a common currency, usually the US dollar. To adjust for differences in purchasing power among countries, we use exchange rates that reflect such differences. These exchange rates ensure purchasing power parity (PPP) and are called PPP-adjusted exchange rates. Thus, to compare GNI per capita or GDP per capita among different countries, these indexes are measured in PPP-adjusted, or international, dollars. For comparisons over time, we must also adjust for inflation in each country by using real per capita income or output.261.2.1 Cross-Country Differences in Per Capita Output and Income
The world today consists of countries characterized by very large differences in both the standard of living of their inhabitants and the rate of growth of their living standards.
For example, in the United States, annual per capita GNI in 2012 was $52,220, whereas the annual per capita income of the Congo, one of the poorest economies, was only $710, of comparable purchasing power. The Congo had a per capita income that was just 1.4% of the US per capita income.
The World Bank publishes comparable data, in international US dollars, measuring the per capita GNIs of 214 countries of the world. For 2012, the relevant data exist for 184 countries. The average per capita GNI of countries classified as high-income economies was $39,903, whereas the average per capita GNI of low-income economies was $1,870.
The per capita income of high-income (developed) economies was thus on average 20 times higher than that of low-income, or least-developed, economies. The average per capita income of middle-income economies was equal to $9,075. The per capita income of high-income (developed) economies is thus on average 4 times higher than that of middle-income economies.The number of countries with per capita GNI in a particular income bracket, measured in international US dollars, is depicted in figure 1.1.
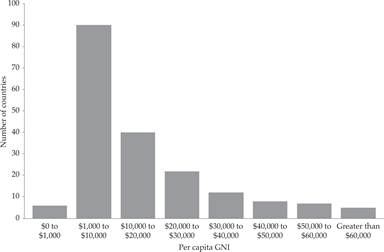
Figure 1.1 Distribution of countries by per capita GNI, 2012.
Five countries (Qatar, Macau, Singapore, Bermuda, and Norway) had GNIs per capita greater than $60,000. Seven countries (United Arab Emirates, Luxembourg, Switzerland, Saudi Arabia, Oman, the United States, and Hong Kong) had GNIs per capita between $50,000 and $60,000. Eight developed European economies, as well as Australia and Canada, had GNIs per capita between $40,000 and $50,000. Twelve countries (including France, Great Britain, Japan, Italy, S. Korea, Spain, New Zealand, and Israel) had GNIs per capita between $30,000 and $40,000. Twenty-two countries (including Greece, Cyprus, and Russia) had GNIs per capita between $20,000 and $30,000. Forty countries (including Turkey, Brazil, and China) had GNIs per capita between $10,000 and $20,000. Ninety countries, about half of the 184, had GNIs per capita between $1,000 and $10,000. These included India, with per capita GNI of $5,080. Finally, six countries in sub-Saharan Africa had per capita GNIs of less than $1,000.
These numbers suggest the extent of the disparities in per capita output and income. An adequate theory of economic growth ought to be able to account for such wide disparities.
1.2.2 Evolution of Per Capita Output and Income over Time
Reliable data on the per capita outputs and incomes of various countries and their growth rates before 1820 is extremely rare.
The estimates of Maddison [1982], based on heroic assumptions, suggest that the average growth rate of real world GDP per capita in the two centuries between 1500 and 1700 AD was only 0.04% per year. In the period 1700–1820, it was slightly higher, at just 0.07% per year. Even in Western Europe, for which 1500–1820 was a period of relative economic prosperity compared to other world regions, the average growth rate of GDP per capita did not exceed 0.14% per year.
Before 1500, all indications suggest that the standard of living, despite large cyclical fluctuations, displayed no long-term trend.
A second feature of the period before 1820 is that income differences between countries were very small compared to today. According to the estimates of Bairoch [1993], the differences in living standards between the richest and the poorest countries did not exceed 1.5–2.0 to 1. Moreover, Bairoch estimates that there were no significant differences in living standards between Rome in the first century AD, the Arab caliphates in the tenth century, China in the eleventh century, India in the seventeenth century, and Europe in the early eighteenth century.
In the fifteenth century (before the economic boom in Europe), China, the Ottoman Empire, the Incas, and the Aztecs seem to have had a higher standard of living than did Western Europe. However, economic growth in Western Europe picked up after 1500, while China entered a long period of economic decline.27
The average growth rate of world per capita output increased between 1820 and 1870, reaching 0.5% per year. Between 1870 and 1950, the average growth rate doubled to 1.1%, and since 1950, it has doubled again to more than 2%. Between 1950 and the early twenty-first century, many countries have seen their standards of living more than triple.28
As a result, in the high-income countries of today, real per capita output and income is, depending on the country, between 10 and 30 times higher than it was 200 years ago.
The increase in per capita output and income is not and has not been uniform. Table 1.1 presents relevant data based on Maddison [1982] and the Maddison Project. After centuries of stagnation in the average standard of living of all countries of the world, the average growth rate began to rise in Europe and its former colonies, such as the United States, Canada, and Australia, from the early nineteenth century. In other countries, such as Japan, the growth process started later.
Table 1.1 Per capita GDP and average annual growth rates over time, various countries.

However, growth has been uneven. In 1820, the more-developed countries of today had a per capita GDP which was about three times the per capita GDP of the less-developed countries. In 2012, this factor was about 20 times higher. The former colonies of Western Europe (United States, Canada, Australia, and New Zealand), often termed Western offshoots, in 1820 had a slightly lower standard of living compared to Western Europe itself. In 1950, they had twice the per capita income of Western Europe. Japan surpassed the standard of living of Eastern Europe, Latin America, the former Soviet Union, and Western Europe in the second half of the twentieth century. China, which had become one of the poorest countries in the world in 1950, in 2010 had a per capita income that was more than double the per capita income of India and Africa. Latin America, parts of Asia, and Africa have been generally left behind.
1.2.3 Economic Growth and Convergence since 1820
Figure 1.2 depicts the long-run evolution of (the natural log of ) per capita GDP in the United Kingdom, the United States, and Japan.29
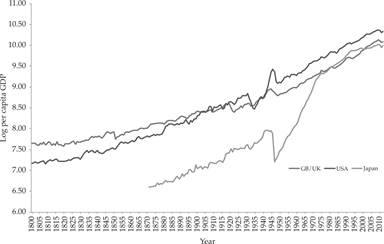
Figure 1.2 Long-run growth of (natural log) per capita GDP in the United Kingdom, the United States, and Japan.
In 1800, British per capita GDP was more than 60% higher than in the United States. At the beginning of the twentieth century, US per capita GDP had surpassed the corresponding British one, because of the higher growth rate in the United States during the nineteenth century. The two World Wars led to a widening of the gap between the two countries, even though the Great Depression of the 1930s was more severe in the United States than in Britain. After World War II, US per capita output has remained consistently higher than in Britain and the other major industrial economies.
GDP per capita in Japan, for which continuous annual estimates exist only after 1870, has been consistently lower than the British and US levels in the nineteenth century. In 1870, it was only 23% of the corresponding British level and only 30% of the American level. By 1913, on the eve of World War I, it had risen to 28% of the British per capita GDP but had fallen to 26% of the US per capita GDP. Japan had experienced slightly higher growth than Britain but lower growth than that of the United States. By 1939, on the eve of World War II, GDP per capita in Japan had risen to 45% of the corresponding value in Britain, and to 43% of that for the United States. Japan experienced much higher growth than did Britain and the United States during World War I and the interwar years. Japanese per capita output fell precipitously in the aftermath of World War II, much more than in Britain and the United States. However, since the end of World War II, Japan has experienced extremely high growth, and by the mid-1970s, the Japanese GDP per capita had converged to the British value. Since the early 1980s, Japanese growth has slowed down, and British growth picked up, with the result that Britain has again surpassed the living standards of Japan.
Figure 1.3 depicts the long-run evolution of per capita GDP in the four major European economies: Britain (the United Kingdom), France, Germany, and Italy.
France, Germany, and Italy had lower per capita GDP than that of Britain throughout the nineteenth century and the first half of the twentieth century. France and Germany experienced a slow process of convergence until the eve of World War I, and faster convergence in the interwar period. In the aftermath of World War II, convergence was much more rapid, and by the early 1970s, per capita GDP did not differ by much in these four economies.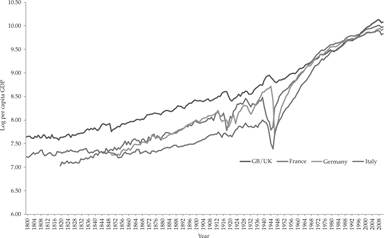
Figure 1.3 Long-run growth of (log) per capita GDP in the major European economies.
Both figures 1.2 and 1.3 display the significant rise of the rate of economic growth in the post–World War II period. In the 60 years between 1950 and 2010, the real per capita GDP of the United States more than tripled. In fact, it rose by about 3.2 times, from $9,561 (in 1990 prices) in 1950, to $30,491 in 2010. Its average annual growth rate was about 2% per year. The major developed European economies displayed even higher growth. The average annual growth rates of real per capita GDP in Britain was 2.1%, slightly higher than in the United States. Italy achieved an average annual growth rate of 3.0%, Germany 2.8%, and France 2.4%. As a result, there was significant convergence of the per capita GDP of the major European economies to that of the United States. The average annual growth rate of per capita income in Japan was 4.1% in the same period, significantly higher than in the United States and the major European economies.
However, even during these 60 years, the less-developed economies have not demonstrated a uniform tendency toward convergence with the per capita incomes of the developed economies. Some developing economies, particularly in the rest of Western Europe and Southeast Asia, have achieved impressive increases in per capita income compared to 1950 and significant convergence with the living standards of the developed economies. However, other economies, particularly in Latin America, the rest of Asia, and Africa, have failed to display significant convergence; in fact, some of them have fallen dramatically behind.30
1.3