Monetary Control in the United States
Describe the policy The principles of money supply determination we described in Section 14.1 apply tools used by the fairly generally to central banks and banking systems.
In this section we focus onFederal Reserve to specific institutional details of the central bank in the United States, which is the control the money Federal Reserve System.
supply.
The Federal Reserve System
The central bank of the United States is called the Federal Reserve System, or the Fed for short. It was created by the Federal Reserve Act in 1913 and began operation in 1914. One of Congress's primary motives in establishing the Fed was the hope that a central bank would help eliminate the severe financial crises (combinations of stock market crashes, business failures, and banking panics) that had periodically afflicted the United States before World War I. Ironically, the most severe financial crisis in U.S. history occurred in 1930-1933, barely a decade and a half after the creation of the Fed.
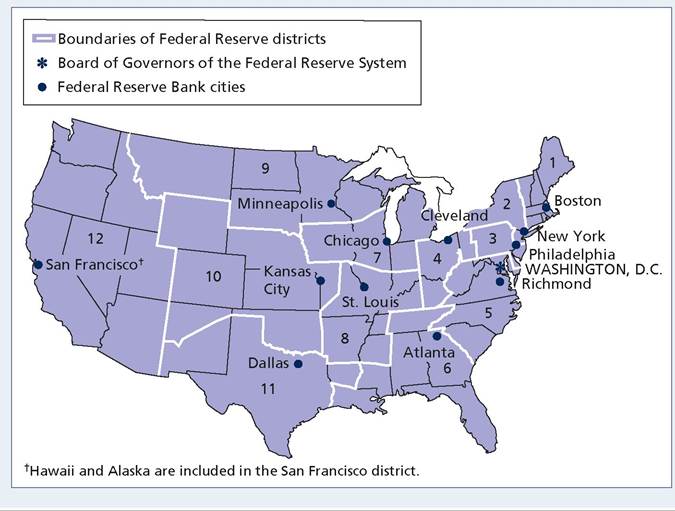
The Federal Reserve Act established a system of twelve regional Federal Reserve Banks, each associated with a geographical area called a Federal Reserve district. The locations of the twelve Federal Reserve Banks are shown in Figure 14.1. Technically, the regional Federal Reserve Banks are owned by the private banks within the district that are members of the Federal Reserve System. All federally chartered private banks are members of the Federal Reserve System, and state- chartered banks may join. Whether an individual bank is a member of the system has ceased to mean much, however, because Congress passed legislation in 1980 extending the responsibilities and privileges of member banks to all banks. Before 1980 member banks faced stricter regulatory requirements than nonmembers but also had access to some useful services (such as check-clearing services).
The leadership of the Federal Reserve System is provided by the Board of Governors of the Federal Reserve System (also called the Federal Reserve Board), located in Washington, D.C. The board consists of seven governors, appointed by the President of the United States to staggered 14-year terms, with one of the governors beginning a new term every other year. The President appoints one board member to be the chairman of the Board of Governors for a term of four years. Besides having considerable influence over monetary policy, the chairman is an important figure in financial markets (the Fed has partial responsibility for
5During the financial crisis, the Federal government increased the FDIC limit on insured deposits to $250,000 from $100,000, which was the FDIC limit before the crisis. In addition, certain accounts had no limit on the amount covered by deposit insurance from October 2008 to December 2010 under the FDIC's Temporary Liquidity Guarantee Program.
FIGUREJ4.1
Location of the Federal Reserve Banks
The twelve regional Federal Reserve Banks are located in twelve major cities in the United States. The Board of Governors of the Federal Reserve System is located in Washington, D.C.
regulating securities markets and the banking sector) and often is consulted by Congress and the President on matters of national economic policy.
Decisions about monetary policy are the responsibility of the Federal Open Market Committee (FOMC). The FOMC consists of the seven governors, the president of the Federal Reserve Bank of New York, and four of the presidents of the other regional Federal Reserve Banks, who serve on the FOMC on a rotating basis.[256] The FOMC meets about eight times a year to review the state of the economy and to plan the conduct of monetary policy. The FOMC can meet more frequently (in person or by conference call) if developments in the economy seem to warrant discussion.
FOMC decisions to tighten or ease monetary policy are announced immediately after the meeting and are closely monitored by the press, public, and financial markets.The Federal Reserve’s Balance Sheet
The balance sheet of the Federal Reserve System (all Federal Reserve Banks taken together) as of June 2022 is shown in Table 14.1. The Fed's largest asset is its holdings of U.S. Treasury securities, or government bonds. The bonds are assets of the Fed and liabilities of the U.S. Treasury. It also owns gold and makes loans, which count as Fed assets. During the financial crisis of 2008, the Fed began purchasing a variety of assets other than Treasury securities, including bonds issued by Federal agencies and mortgage-backed securities. During the pandemic in 2020, the Fed began making loans to business firms through the Paycheck Protection Program.
TABLE 14.1
The Balance Sheet of the Federal Reserve System (Billions of Dollars)
| Assets | Liabilities | ||
| Gold | $ 11.0 | Currency | 2278.9 |
| Loans to depository institutions and firms | 20.9 | ||
| US Treasury securities | 5770.4 | ||
| Federal agency debt | 2.3 | Deposits of depository institutions | 3322.0 |
| Mortgage-backed securities | 2707.4 | Other liabilities and net worth | 3364.3 |
| Other assets | 453.2 | ||
| Total | 8965.2 | Total | 8965.2 |
| Less Other liabilities and net worth | 3364.3 | Less Other liabilities and net worth | 3364.3 |
| Equals Monetary base | 5600.9 | Equals Monetary base | 5600.9 |
Note: Numbers may not add to totals shown owing to rounding.
Source: Federal Reserve Statistical Release H.4.1. Data are for the week ending June 1, 2022.
The category "Other assets" includes foreign exchange, the value of Federal Reserve buildings, and other relatively small items.
A principal liability of the Fed is currency outstanding. The other principal liability of the Fed is deposits made by depository institutions, such as banks, savings and loan associations, and mutual savings banks. In accepting deposits from depository institutions, the Fed acts as the "banks' bank." Depository institutions make deposits at the Fed because it is a convenient way of holding reserves.
Open-Market Operations
If the Fed wants to change the money supply, one of its primary tools is openmarket operations. To increase the money supply, for example, the Fed could conduct an open-market purchase, in which it would buy U.S. Treasury securities from government securities dealers. As we discussed in Section 14.1, this openmarket purchase would increase the monetary base, and the money supply would increase as well. To decrease the money supply, the Fed could conduct an openmarket sale, in which it would sell U.S. Treasury securities to government securities dealers, which would reduce the monetary base.
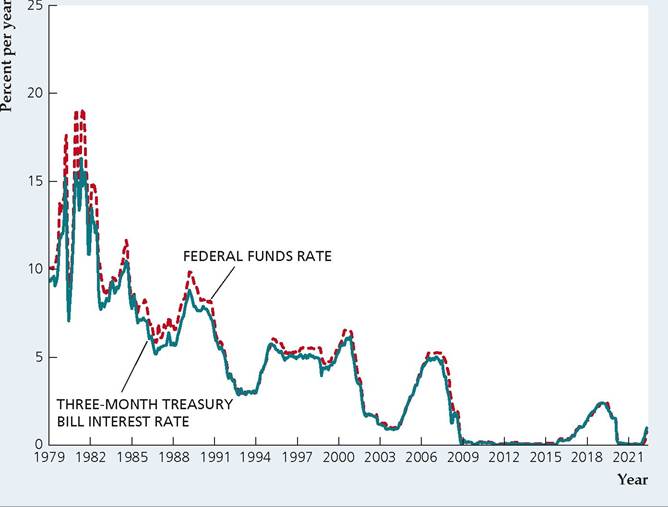
When the Fed engages in open-market operations, the transactions affect the interest rate in the market for bank reserves. A bank can borrow reserves from other banks that have extra reserves. These borrowed funds are called federal funds, or fed funds, and the interest rate charged on these loans is the federal funds rate, also called the fed funds rate. Despite its name, the fed funds rate is not an interest rate charged by the Fed; it is the interest rate charged on loans from one bank to another. Figure 14.2 shows how the fed funds rate has changed over time from 1979 to 2022. Generally, the fed funds rate moves in line with other short-term interest rates, such as the three-month Treasury bill interest rate shown in the graph.
But the fed funds rate is particularly important, as we discuss in the next section, because the Fed often chooses to target it in conducting monetary policy.Reserve Requirements
Although open-market operations are the main way that the Fed affects the money supply, it has three other methods available: changes in reserve requirements, discount window lending, and changes in the interest rate the Fed pays on reserve deposits held by banks.
FIGUREJ4.2
The federal funds rate and three-month Treasury bill interest rate, 1979-2022
Banks can borrow reserves from other banks and pay the federal funds rate. The Fed often implements monetary policy by using open-market operations to affect the fed funds rate. The fed funds rate moves in a similar fashion with other short-term interest rates, such as the three-month Treasury bill interest rate shown here.
Source: Federal Reserve Board of Governors, downloaded from FRED database, Federal Reserve Bank of St. Louis, fred.stlouisfed.org, series FEDFUNDS (fed funds rate) and TB3MS (three-month Treasury bill interest rate).
The Fed has the authority to require banks to keep reserves (either on deposit at the Fed or in the form of vault cash) of a certain percentage of the amount of the transactions deposits held at the bank. The Fed could influence the money supply by changing this reserve requirement, but seldom does so because changes in reserve requirements have a large impact on banks' profitability and the money supply. As a result, the Fed prefers to use its other instruments. From 1992 to 2020, the Fed did not change reserve requirements at all. In March 2020, the Fed set reserve requirements to zero, though it still has the authority and infrastructure to set a positive reserve requirement in the future.
Discount Window Lending
A principal reason that the Fed was created was to try to reduce severe financial crises.
The Fed was supposed to accomplish this goal mainly by acting as a "lender of last resort"—that is, by standing ready to lend reserves to banks that need cash to meet depositors' demands or reserve requirements. For example, during the financial crisis in 2008, the Fed lent $400 billion to banks through the discount window. The Fed's lending of reserves to banks is called discount window lending, and the interest rate it charges for lending reserves is called the discount rate. For more on the function of a central bank as a lender of last resort, see the Application "The Lender of Last Resort."When the Fed lends reserves to banks through the discount window, it changes the monetary base. For example, if banks borrow $1 billion from the Fed and deposit these borrowings in their reserve accounts at the Fed, the Fed's balance sheet is affected in two ways: (1) on the asset side, loans to depository institutions rise by $1 billion; and (2) on the liability side, deposits held by depository institutions also rise by $1 billion, increasing the monetary base by $1 billion. Thus
Application
The Lender of Last Resort
The inherent nature of the fractional reserve banking system carries the potential for mismatches between inflows and outflows unless adequate care is taken. As explained in the chapter, news of a bank's liquidity problems, even if untrue, can start bank runs. If large enough, such runs can cause depositors to withdraw their funds simultaneously. When several banks face the same problem concurrently, panic sets in, which culminates in economic instability and a systemic banking crisis. Disturbingly, some crises can rapidly spread to other countries with no apparent vulnerabilities. Runs on credible institutions such as the United Kingdom's Northern Rock in 2007 and India's ICICI Bank in 2008 demonstrate how customers' actions can make or break a financial institution over liquidity concerns. To prevent such panics, knowing that banks will continue to run smoothly when their customers feel secure, central banks stand as the lender of last resort, guaranteeing sufficient liquidity in the monetary system.
The idea of a lender of last resort is not new—it was discussed as far back as 1873 in Walter Bagehot's Lombard Street.[257] His widely cited dictum is that, in a financial crisis, a central bank should lend cash freely at a penalty rate in exchange for "good" collateral. The dictum's basis is that, during crises, even banks with marketable collateral will find it challenging to sell them. Without such assurances of liquidity support, even solvent banks will have no option but to sell their marketable assets at highly deflated prices, thereby further depleting their financial base and worsening the crisis. It may be difficult to distinguish bankruptcy from illiquidity, but the broad spirit of Bagehot's principle is that a central bank should do what is necessary to curb a crisis while protecting itself against losses to the maximum extent possible. Being higher than normal, penalty interest rates should deter unnecessary use of the mechanism.
There are recent examples of central banks taking a firm stance as lenders of last resort and thereby averting exacerbated bank runs. In September 2007, rumors of a crisis surrounding Northern Rock resulted in queues at many of its 76 branches, and the firm's shares plunged by more than 40%. Depositors' confidence was only restored when Chancellor Alistair Darling agreed to guarantee all deposits held by Northern Rock and the Bank of England said it would inject £10 billion into the money markets. In September 2008, ICICI Bank, India's largest private-sector bank, also faced runs across the country on the basis of rumors that it might fail. The Reserve Bank of India had to step in as the lender of last resort, issuing a statement that there was enough liquidity at ICICI Bank and that they had arranged for the provision of adequate cash to guarantee customers' deposits.
7Walter Bagehot, Lombard Street, London: Henry S. King & Co., 1873.
Interest Rate on Reserves
In October 2008, the Federal Reserve began to pay interest on banks' reserve deposits at the Fed. The rationale is that banks had been expending resources trying to keep their reserves as low as possible, which was distorting the market for reserves and causing the federal funds rate to be volatile. Banks had developed a system of sweep accounts, in which they swept funds from accounts that were subject to reserve requirements into accounts on which no reserves needed to be held, but this is a costly use of resources with little societal benefit. The payment of interest on reserves gives banks the incentive not to expend substantial resources just to avoid holding reserves.
Not only did the move to paying interest on reserves lead banks to hold substantially more reserves, it also gave the Fed an additional tool to use to affect the money supply. By raising the interest rate on reserves, the Fed can encourage banks to hold additional reserves, thus reducing the money supply. Alternatively, if the Fed wants to increase the money supply, it can do so by reducing the interest rate it pays on reserves. Although this tool for adjusting the money supply is relatively new, it has become the main policy tool employed by the Fed, as we discuss further in Section 14.4.9
New Monetary Policy Tools Developed in the Great Recession
In the first months of the housing crisis (see "In Touch with Data and Research: The Housing Crisis of 2007 to 2011," in Chapter 7), many analysts thought that the decline in house prices would lead to some losses at banks and other financial institutions and might propel the economy into a recession (as it did), but no one foresaw the sudden collapse of the financial system that would occur in the fall of 2008. The result was an episode that we now call the Great Recession because its impact on the U.S. and global economies was immense, though not as destructive as the Great Depression of the 1930s.
The economy deteriorated rapidly during the Great Recession. Real GDP fell 2.1% (at an annual rate) in the third quarter of 2008, 8.4% in the fourth quarter, and 4.4% in the first quarter of 2009. Overall, the length and depth of the recession made it more severe than the recessions of 1973-1975 and 1981-1982, but not nearly as bad as the Great Depression in the 1930s. The economy recovered very slowly from the recession, even after it ended in June 2009. Three years after the recession was over, the unemployment rate remained above 8% and economic growth was stagnant. The unemployment rate began to decline more rapidly from 2013 to 2015, though GDP growth remained below its historical average in those years.
The Zero Lower Bound. During and after the recession, the Fed used a variety of new policy tools to help the economy recover and to stabilize financial markets. The Fed faced a major obstacle: the zero lower bound on interest rates. By the end of 2008, monetary policymakers were unable to reduce the interest rate further to stimulate the economy because the interest rate was at its lower bound of zero. The nominal interest rate cannot decline below zero because a nominal interest
9See Glenn D. Rudebusch, "The Fed's Exit Strategy for Monetary Policy," Federal Reserve Bank of San Francisco Economic Letter 2010-18, June 14, 2010; and David Bowman, Etienne Gagnon, and Mike Leahy, "Interest on Excess Reserves as a Monetary Policy Instrument: The Experience of Foreign Central Banks," Federal Reserve Board of Governors, International Finance Discussion Papers Number 996, March 2010. rate below zero would make it more profitable for an investor to hold cash rather than to make a loan, although there are exceptions, as we discuss in the Application "Is There Really a Zero Lower Bound?" This situation is called a liquidity trap, which was also faced by Japan in the 1990s. In a liquidity trap, any additional money supplied by the central bank is held by banks or the public, with no decline in interest rates or increase in spending. Japan's policymakers failed to solve the liquidity trap, and their economy suffered from deflation (declining prices) and very slow growth for more than two decades.
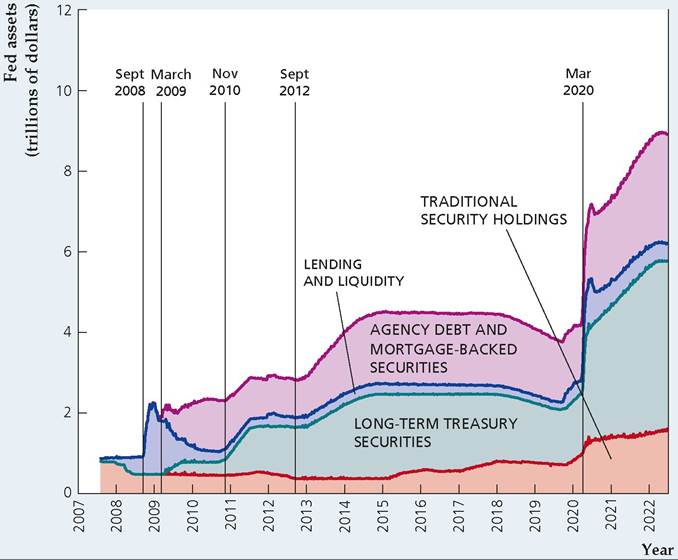
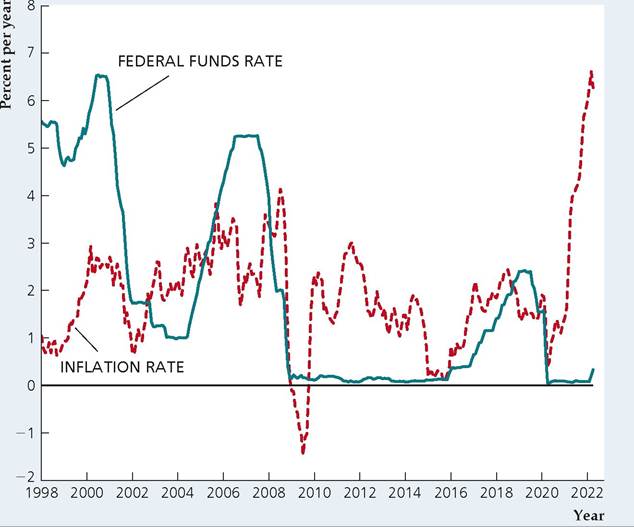
To get the U.S. economy out of the liquidity trap, and to avoid the problems caused by the zero lower bound, the Fed took a number of unusual policy measures from 2009 to 2014, including affecting interest rate expectations and expanding the size of the central bank balance sheet.[258] [259] One method for dealing with the zero bound is for the central bank to take action to change people's expectations of future interest rates. To affect interestrate expectations, the Fed used a policy of forward guidance, in which it signaled to the market how long it thought interest rates would remain low. The idea is that if people base their consumption and investment decisions on long-term interest rates but the central bank can affect only short-term interest rates, then the central bank may not have much impact on consumption and investment. But if the central bank tells people that it expects to keep short-term interest rates very low for a long time, then long-term interest rates may decline relative to what they would be if people thought the central bank would raise short-term interest rates in the near future. By announcing that it expects to keep short-term interest rates very low, the central bank hopes to reduce long-term interest rates, thereby flattening the yield curve (see "In Touch with Data and Research: Interest Rates," in Chapter 4 and the discussion in the section "Time to Maturity" in Chapter 7). Application enticing attributes that lenders value. These may include security, insurance, convenience, and often, confidentiality. Evidence from countries where sub-zero interest rates have been implemented shows that banks have been reluctant to charge ordinary customers to hold money in their own accounts. They note that competition is fierce, and households are ready to move their money to another bank. However, it's a different story for big companies and wealthy customers. In 2019, Denmark's Jyske Bank introduced negative interest rates for customers with cash balances over $1.1million, charging them 0.6% per annum to hold their money. In January 2021, Swiss bank UBS announced clients with cash balances above CHF 250,000 would be charged a 0.75% fee that from July 2021 onward. Above a certain limit, consumers' attitude toward negative rates change. But in Germany, where some banks impose charges on deposits above ˆ100,000, some depositors have resorted to keeping their money in vaults. What are the implications for mortgage holders? Some European banks have offered attractive deals. In 2019, Jyske Bank offered a 10-year loan with a -0.5% annual rate. In 2021, Finland's Nordea Bank offered 20-year mortgages at 0%. Such attractive deals may only work in mortgage markets where banks act as intermediaries and charge higher product fees to make their profit. However, most lenders have embedded clauses stipulating that their mortgages have a "floor" (typically 0%) below which mortgage rates cannot fall, as customers of UK mortgage lender Cheltenham and Gloucester, with mortgage interest rates indexed at 1.01% below the base rate, were reminded in 2009. Thus, though it is possible for nominal interest rates go sub-zero for savers, there is a tolerance limit. For mortgages, however, the zero bound is stricter.[260] money supply. Quantitative easing also works by affecting long-term interest rates. The Fed's purchases of longer-term securities also tend to push down the interest rates on those securities, which provides stimulus to spending; for example, by lowering mortgage interest rates to encourage home purchases.[261] Rather than focusing on targeting the federal funds rate, the Fed changes its focus to the quantity of the monetary base or bank reserves, as it did in the 1979-1982 period. Japan used this method of "quantitative easing" in 2002-2003 to prevent its deflation from worsening and to bring inflation back to near zero in 2004. In a system of quantitative easing, the central bank buys financial assets and increases the size of its balance sheet, which it can do even when short-term interest rates are near zero. In the aftermath of the financial crisis, the Fed also altered the types of assets that it owns. Prior to the financial crisis, the Fed mainly owned short-term Treasury securities. During the crisis and in the following years, the Fed transformed its balance sheet to hold more long-term Treasury securities and both debt and mortgage-backed securities issued by agencies known as Fannie Mae and Freddie Mac. (Those agencies were designed to help improve the efficiency of the housing market, though both went bankrupt in the financial crisis and were taken over by the Federal government.) The rationale for buying long-term Treasury securities is to reduce long-term interest rates, spurring an increase in consumption and investment. The rationale for buying agency debt and mortgage-backed securities is to reduce interest rates in the mortgage markets and help the housing market recover. In September 2011, the Fed began a concerted effort to sell short-term Treasury securities and buy long-term Treasury securities in the market, in a program that came to be called Operation Twist (formally, it is the Maturity Extension Program) because doing so might raise short-term interest rates and lower long-term interest rates, causing the yield curve (see "In Touch with Data and Research: Interest Rates" in Chapter 4) to "twist," that is, to rise at short maturities and to fall at long maturities. Again, the goal was to lower long-term interest rates to stimulate consumption and investment. Long-term interest rates indeed declined as the operation took place, though the impact on consumption and investment was not clear. As we discussed in Chapter 4, consumption and investment spending may be more sensitive to income and economic conditions than they are to the real interest rate. Figure 14.3 shows the Fed's balance sheet, specifically, the Fed's overall holdings of various assets, which include traditional security holdings (mainly shortterm Treasury securities) in the orange shaded area, long-term Treasury securities in the green shaded area, loans to banks and financial markets in the blue shaded area, and agency (Fannie Mae and Freddie Mac) debt and mortgage-backed securities in the purple shaded area. Before the financial crisis in 2007 and early 2008, the size of the Fed's balance sheet was about $0.9 trillion. In spring 2008, as the financial crisis began to emerge, the Fed began lending funds to various financial institutions to prevent the financial crisis from spreading. In Fig. 14.3, you can see how the Fed increased its lending by about $0.4 trillion, offsetting that by selling Treasury securities to keep its total balance sheet unchanged. Then, as the financial crisis unfolded in September and October 2008, the Fed made many additional loans, increasing the size of its balance sheet to more than $2 trillion. By FIGUREJ4.3 The asset side of the Fed's balance sheet, 2007-2022 The Fed increased the size of its balance sheet substantially in the Great Recession, increasing its ownership of financial assets from less than $1 trillion before the crisis to almost $3 trillion by the end of 2011 and to $4.5 trillion in 2014. When the financial crisis began, the Fed made emergency loans and supplied liquidity to financial markets, causing its balance sheet to more than double in size. As those loans were repaid, the Fed began buying long-term Treasury securities and agency debt and mortgage-backed securities. The Fed undertook similar actions in the pandemic of 2020. Source: Federal Reserve Board of Governors website at www federalreserve.gov/monetarypolicy/ bst_recenttrends.htm and Federal Reserve Bank of Cleveland website at www.clevelandfed.org/ our-research/indicators-and-data/~/ media/files/webcharts/crediteasing/ crediteasingbalancesheet.xls. December 2008, the fed funds rate was below 0.25% and the United States had effectively hit the zero lower bound, as Figure 14.4 shows. Policymakers were worried about deflation, as the inflation rate turned negative for several months. Quantitative easing during the recovery from the Great Recession occurred in phases. The first phase began in late 2008. The Fed's balance sheet exceeded $2 trillion, but the increase in the Fed's balance sheet was temporary because it arose from emergency lending that would be mostly paid off within a year. However, the Fed determined that as its loans to banks and financial markets were repaid, it would engage in quantitative easing by purchasing Treasury securities and mortgage- backed securities to keep its balance sheet from shrinking, as Fig. 14.3 shows. As the blue area showing the Fed's lending shrank from early 2009 to mid-2009, the Fed bought mortgage-backed securities and Treasury securities, so that its balance sheet remained about $2 trillion. In March 2009, the Fed announced a further expansion of its balance sheet, which reached $2.3 trillion by June 2010. The economy continued to grow slowly and the unemployment rate remained high, so the Fed announced in November 2010 that it would increase its balance sheet by another $0.6 trillion by mid-2011; the balance sheet indeed topped out at $2.9 trillion by the end of 2011. In September 2012, the Fed began another round of quantitative easing, which brought the Fed's assets up to almost $4.5 trillion by the end of 2014. One benefit of quantitative easing is that it pushed the inflation rate up and prevented deflation. As Fig. 14.4 shows, the inflation rate increased from negative values to about 2% on average in 2010 and 2011. Thus the U.S. economy did not suffer from deflation, as Japan had done two decades earlier. Inflation remained FIGUREJ4.4 U.S. federal funds rate and inflation rate, 1998-2022 The chart shows monthly values for the inflation rate (based on the percentage increase in the personal consumption expenditures price index over the preceding twelve months) and the federal funds interest rate for the period January 1998-April 2022. Sources: Federal funds interest rate: Board of Governors of the Federal Reserve System, Federal Reserve Bank of St. Louis FRED database, available at fred.stlouisfed.org/series/ FEDFUNDS; Personal Consumption Expenditures Price Index, Bureau of Economic Analysis, available at fred.stlouisfed.org/series/PCEPI. between about 1% and 2% from 2012 to late 2014, when it fell sharply because of a significant decline in energy prices. The Federal Reserve began to raise the federal funds interest rate in December 2015 and continued to do so in a very gradual fashion for the next several years. At the same time, the inflation rate remained below 2% for most of that period. Application The Financial Crisis of 2008: Some Implications for the Global Economy As shown in Figure 14.4, the U.S. federal funds rate underwent significant reductions around 2000, which encouraged bank lending. The massive credit expansion fueled mortgage uptake in subprime markets, encouraging new financial instruments including multilayered, mortgage-backed securities. Increasing the federal funds rate after 2004 rattled the housing boom, causing numerous defaults in low- quality mortgages and bursting the bubble. In August 2007, BNP Paribas, a leading global financial services firm, announced that it was ceasing activity in three hedge funds that specialized in U.S. mortgage debt. Lehman Brothers' unexpected bankruptcy in September 2008 further intensified a massive liquidity preference and credit evaporation, prompting huge increases in perceived counterparty risk. Their involvement with several hedge funds and financial institutions led to multiple bank failures in the United States, and the solvent nature of many financial institutions became suspect. As the effects hit the real economy, consumer spending and investment plummeted, causing a leftward shift in the IS curve. High interdependencies among global financial markets meant that the crisis spread to the financial sectors of other countries. At the crisis' onset, advanced economies suffered considerably from financial strains and the deterioration of housing markets. In 2008's last quarter, the annualized rate of GDP contraction topped 10% in some high-income countries. Significant damage was inflicted through financial channels in emerging markets in Europe and the Commonwealth of Independent States, which had been relying heavily on capital inflows to fuel growth. Even countries that did not seem to have problems with their financial systems started experiencing significant decreases in industrial production in addition to adverse changes in capital flows, commodity prices, interest rates, remittances, risk premiums, and trade opportunities. In Brazil, the annualized rate of GDP and industrial production fell by about 11% and 30%, respectively, in 2008's last quarter. In Africa, sharp falls in commodity prices hit the resource-rich countries hard. The tightening of global credit conditions reduced foreign direct investment and reversed portfolio flows especially hit emerging and frontier markets. Countries relying heavily on manufacturing exports were hammered by falling export market demand. Japan's GDP shrunk by over 10% on an annualized basis in the two quarters following Lehman Brothers' bankruptcy. Plummeting demand for durable goods and a decline in investment activity in emerging economies hurt manufacturing exports. The rapid fall in confidence among consumers and businesses, rising uncertainty, weakening labor markets, tighter financial conditions, and rising spare capacity weakened domestic demand. In other parts of Asia, the manufacturing-oriented economies also plummeted and, by the end of 2008, experienced industrial production declines of about 25% compared with 2007 levels. Only China, Indonesia, and India escaped severe recessions, mainly because of a large policy stimulus and, in the case of India, less dependence on exports. Governments around the world quickly realized drastic action was needed to reverse the IS shift; however, responses differed. Governments in developed countries reduced policy rates to almost 0%, and when that did not achieve desired results, they decided to inject liquidity through asset purchases. In Europe, the strict fiscal deficit restrictions enshrined in the Maastricht Treaty were temporarily loosened. The UK also allowed fiscal flexibility to help economic recovery. China increased public investment expenditure, mainly in infrastructure, by over $500 billion. Brazil prioritized fiscal policy expansion, and by late 2008, the authorities had approved a fiscal stimulus package comprising tax reductions, public investment, and unemployment benefits and minimum wage increases. It was only in January 2009, after industrial production had plummeted by 16.4% in December 2008 compared to December 2007, did interest rates reduction begin. Many blamed this delay for the GDP decline from 5.1% to -0.7% in 2009. Although fiscal expansions helped job creation, they also ballooned countries' sovereign debt.14 Monetary Policy in Response to the Pandemic of 2020 When the global pandemic began in 2020, as we discussed in Chapter 4 in the "Application: The Impact of the Pandemic Recession of 2020 on Consumption," governments all over the world provided income support for workers who were unable to work. The Federal Reserve also employed tools from the financial crisis, including quantitative easing, funding for financial institutions through liquidity facilities, and reducing nominal interest rates near zero. In addition, the Federal Reserve employed several new tools. A unique aspect of the Fed's new tools in the pandemic was direct lending to business firms, whereas most previous Fed lending was only to financial institutions. 14See International Monetary Fund, World Economic Outlook (Washington DC: IMF, 2009), p. 85. The Fed made some loans to business firms through the Main Street Business Lending Program, which was designed to support lending to medium-sized businesses. The Fed also created the Primary Market Corporate Credit Facility (PMCCF), which supported large businesses that wished to issue new bonds and loans, and the Secondary Market Corporate Credit Facility (SMCCF), which provided additional liquidity for outstanding corporate bonds of large businesses. The main idea behind these lending programs was to keep businesses afloat when much of the demand for their products declined and when their workers were unable to work because of the pandemic. The lending facilities for corporations, municipalities, and medium-sized businesses were authorized by Congress, which provided funds to protect the Fed from any losses. Perhaps the most important new tool, however, was the Paycheck Protection Program. In this program, the Small Business Administration worked with local banks to make loans to keep small businesses open. The Fed supported the program by making loans to those banks making the PPP loans. Later in 2020, as the pandemic continued, the Fed announced a new system of flexible average inflation targeting. The official announcement noted that when inflation has been averaging below 2% for some time, the Fed would allow inflation to run above 2% to make up for that. For a while, it appeared that the Fed's new policy could be helpful in stimulating the economy without worrying about inflation rising too much. But, as Figure 14.4 shows, the Fed's focus on stimulating the economy at the same time that other income support policies by the federal government were in place, along with supply shocks, led inflation to rise substantially. Supply shocks included the snarling of supply chains, unavailability of critical parts (like semiconductors needed for auto production), and reduced labor supply as many workers delayed coming back to work and some older workers retired early. Also, Russia's war on Ukraine contributed to large increases in the prices of oil, wheat, and other foodstuffs. By the time the Fed realized its mistake, the inflation rate had become unacceptably high, leading the Fed to have to raise interest rates substantially. 14.3