NUMERICAL PROBLEMS
1. Two economies, Hare and Tortoise, each start with a real GDP per person of $5000 in 1950. Real GDP per person grows 3% per year in Hare and 1% per year in Tortoise. In the year 2020, what will be real GDP per person in each economy? Make a guess first; then use a calculator to get the answer.
2. Over the past 20 years an economy's total output has grown from 1000 to 1300, its capital stock has risen from 2500 to 3250, and its labor force has increased from 500 to 575. All measurements are in real terms. Calculate the contributions to economic growth of growth in capital, labor, and productivity:
a. assuming that aκ = 0.3 and aN = 0.7.
b. assuming that aκ = 0.5 and aN = 0.5.
3. For a particular economy, the following capital input K and labor input N were reported in four different years:
Year K N
1 200 1000
2 250 1000
3 250 1250
4 300 1200
The production function in this economy is
where Y is total output.
a. Find total output, the capital-labor ratio, and output per worker in each year. Compare year 1 with year 3 and year 2 with year 4. Can this production function be written in per-worker form? If so, write algebraically the per-worker form of the production function.
b. Repeat Part (a) but assume now that the production function is
4. Use the data from Table 6.1 to calculate annual growth
rates of GDP per capita for each country listed over the period 1950-2018. [Note: The annual growth rate z will satisfy the equation To
To
solve this equation for z using a calculator, take logs of both sides of the equation.] You will find that Germany and Japan, two countries that suffered extensive damage in World War II, had the two highest growth rates after 1950.
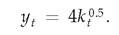
Give a reason, based on the analysis of the Solow model, for these countries' particularly fast growth during this period.5. An economy has the per-worker production function  where yt is output per worker and kt is the capitallabor ratio. The depreciation rate is 0.1, and the population growth rate is 0.05. Saving is
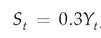
where St is total national saving and Yt is total output.
a. What are the steady-state values of the capitallabor ratio, output per worker, and consumption per worker?
The rest of the problem shows the effects of changes in the three fundamental determinants of long-run living standards.
b. Repeat Part (a) for a saving rate of 0.4 instead of 0.3.
c. Repeat Part (a) for a population growth rate of 0.08 (with a saving rate of 0.3).
d. Repeat Part (a) for a production function of
Assume that the saving rate and population growth rate are at their original values.
6. Consider a closed economy in which the population
grows at the rate of 1% per year. The per-worker production function is where y is output per
worker and k is capital per worker. The depreciation rate of capital is 14% per year.
a. Households consume 90% of income and save the remaining 10% of income. There is no government. What are the steady-state values of capital per worker, output per worker, consumption per worker, and investment per worker?
b. Suppose that the country wants to increase its steadystate value of output per worker. What steady-state value of the capital-labor ratio is needed to double the steady-state value of output per capita? What fraction of income would households have to save to achieve a steady-state level of output per worker that is twice as high as in Part (a)?
7.
Both population and the work force grow at the rate ofn = 0.01 per year in a closed economy. Consumption is C = 0.5(1 — t)Y, where t is the tax rate on income and Y is total output. The per-worker production function is where y is output per worker and k is
the capital-labor ratio. The depreciation rate of capital is d = 0.09 per year. Suppose for now that there are no government purchases and the tax rate on income is t = 0.
a. Find expressions for national saving per worker and the steady-state level of investment per worker as functions of the capital-labor ratio, k. In the steady state, what are the values of the capitallabor ratio, output per worker, consumption per worker, and investment per worker?
b. Suppose that the government purchases goods each year and pays for these purchases using taxes on income. The government runs a balanced budget in each period and the tax rate on income is t = 0.5. Repeat Part (a) and compare your results.
►
More on the topic NUMERICAL PROBLEMS:
- Arab and Zionist institution-building
- REVIEW OF FORENSIC ASSESSMENT INSTRUMENTS
- Functional forms for the model components
- The Ukrainian Diaspora
- Omitting intermediate entities in models of indirect interactions
- REVIEW OF FORENSIC ASSESSMENT INSTRUMENTS
- Discussion
- More Vague Propositions than Sentences
- PRELIMINARIES: DIMENSIONS, INDICATORS, AND WEIGHTS
- Hospital Care