Relating Output and Unemployment: Okun's Law
Explain ⅛e Earlier in this chapter we said that many short-run output fluctuations result from
significance of changes in employment. When employment falls and unemployment rises, the
UKUns ∣aw.
reduction in the number of people working leads to a decline in the quantity of goodsand services produced. We can use the concept of cyclical unemployment to provide a more precise link between the state of the labor market and aggregate output.
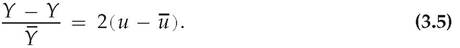
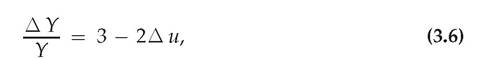
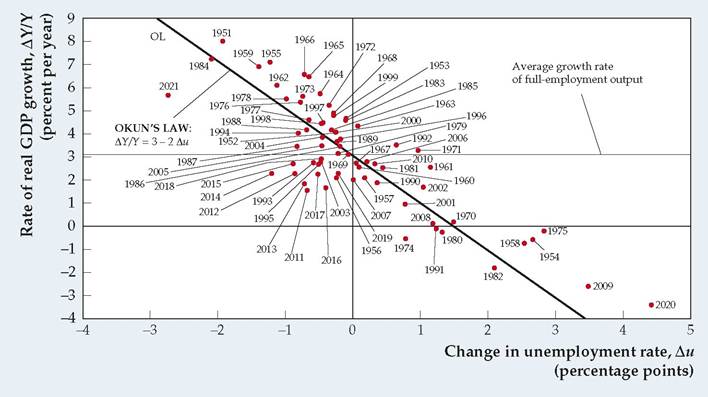
The quantitative impact on aggregate output of a change in the unemployment rate is described by Okun's law, a rule of thumb (rather than a "law") first stated by Arthur Okun, chairman of the Council of Economic Advisers in the 1960s during the Johnson administration. According to Okun's law, the gap between an economy's full-employment output and its actual level of output increases by 2 percentage points for each percentage point the unemployment rate increases.[52] [53] 34 34 We express Okun's law algebraically as The left side of Eq. (3.5) equals the amount by which actual_output, Y, falls short of full-employment output, Y, expressed as a percentage of Y. Thus Eq. (3.5) says that the percentage gap between potential and actual output equals 2 times the cyclical unemployment rate. Let's apply Okun's law by supposing that the natural rate of unemployment is 4% and that the full-employment level of output is $20,000 billion. If the actual unemployment rate is 5%, or 1 percentage point above the natural rate, cyclical unemployment, u — u, equals 1%. If cyclical unemployment is 1%, Okun's law predicts that actual output, Y, will be 2% (2 times 1%) lower than full-employment output, Y. Because Y equals $20,000 billion, Okun's law says that actual output will be $400 billion below the full-employment level (2% times $20,000 billion). You may wonder why a 1 percentage point increase in the unemployment rate, which reduces employment by about 1%, leads (according to Okun's law) to a drop in output that is about twice as large in percentage terms. The reason is that when cyclical unemployment increases, other factors that determine output—the number of people in the labor force, the number of hours each worker works per week, the average productivity of labor—also fall, which magnifies the effect of the increase in unemployment. Numerical Problem 10 at the end of this chapter illustrates this point. Sometimes we express Okun's law in a slightly different form: where ∆Y∕Y is the percentage growth rate of output and ∆u is the change in the actual unemployment rate from one year to the next. Equation (3.6) says that when unemployment is rising (∆ u > 0), actual output, Y, is growing more slowly than 3% per year, which is the average growth rate of full-employment output in the United States. Equation (3.6), which requires the assumption that the natural rate of unemployment is constant, is called the growth rate form of Okun's law. See Appendix 3.A at the end of this chapter for a derivation of Eq. (3.6). Figure 3.16 illustrates the growth rate form of Okun's law. The figure shows the relation between the annual change in the unemployment rate (measured on the horizontal axis) and the annual growth rate of U.S. output (measured on the vertical axis) for the period 1951-2021. Line OL in this figure represents Okun's law. Its slope is -2, indicating that a 1 percentage point increase in the unemployment rate is FIGURE 3.16 Okun's law in the United States: 1951-2021 This figure shows the relation between the growth rate of real GDP (vertical axis) and the change in the unemployment rate (horizontal axis). Line OL is a graph of Okun's law Eq. (3.6). The slope of this line is -2, indicating that a 1 percentage point change in the unemployment rate changes the growth rate of output by 2 percentage points in the opposite direction. Sources: Real GDP growth rate from Bureau of Economic Analysis, downloaded from the Federal Reserve Bank of St. Louis FRED database, fred. stlouisfed.org/series/GDPCA. Civilian unemployment rate for all civilian workers from Bureau of Labor Statistics, downloaded from FRED database, series UNRATE. associated with a 2% drop in output. The vertical line rising from 0 on the horizontal axis intersects OL at 3%. This intercept indicates that, when no change occurs in the unemployment rate, the growth rate of actual output is 3%, or the approximate average growth rate of full-employment output in the United States. In Fig. 3.16, the points representing every year from 2011 to 2019 all lie below the straight line showing Okun's law. The unemployment rate fell and real GDP grew in all of these years, but the growth in output in each year was smaller than would be expected from Okun's law and the actual unemployment rate. Put differently, the economy's recovery after the financial crisis of 2008 looked stronger when measured by the fall in the unemployment rate than when measured by GDP growth. Because of this, some economists doubt that Okun's law is useful in modern times. ►