Unemployment
Explain how the unemployment rate is measured and describe changes in employment status.
Our classical model of the labor market, which relies on supply-demand analysis, is useful for studying the wage rate and the level of employment in an economy and for showing how these variables are linked to output and productivity.
However, this model of the labor market is based on the strong assumption that, when the labor market is in equilibrium, all workers who are willing to work at the prevailing wage are able to find jobs. In reality, of course, not everyone who would like to work has a job; there is always some unemployment. The existence of unemployment implies that, at any time, not all of society's labor resources are actively involved in producing goods and services.We discuss the problem of unemployment several times in this book, notably in Chapter 12. Here we introduce the topic by presenting some basic facts about unemployment and then turning to a preliminary economic analysis of it.
Measuring Unemployment
To estimate the unemployment rate in the United States, each month the Bureau of Labor Statistics (BLS) surveys about 60,000 households. Each person 16 years of age and older in the surveyed households is assigned to one of three categories:
1. employed, if the person worked full-time or part-time during the past week (or was on sick leave or vacation from a job);
2. unemployed, if the person didn't work during the past week but looked for work during the past four weeks; or
3. not in the labor force, if the person didn't work during the past week and didn't look for work during the past four weeks (examples are full-time students, homemakers, and retirees).
Table 3.4 shows the number of people in each category in January 2022. (Good sources for these and other data about the labor market are described in "In Touch with Data and Research: "Labor Market Data in Kazakhstan.") In that month there were 157.2 million
TABLE 3.4
Employment Status of the U.S.
Adult Population, January 2022| Category | Number (millions) | Share of labor force (percent) | Share of adult population (percent) |
| Employed workers | 157.2 | 96.0 | 59.7 (employment ratio) |
| Unemployed workers | 6.5 | 4.0 (unemployment rate) | 2.5 |
| Labor force (employed + unemployed workers) | 163.7 | 100.0 | 62.2 (participation rate) |
| Not in labor force | 99.5 | 37.8 | |
| Adult population | 263.2 | 100.0 |
(labor force + not in labor force)
Note: Figures may not add up because of rounding.
Source: The Employment Situation, January 2022, Table A-1.
employed and 6.5 million unemployed workers. The labor force consists of all employed and unemployed workers, so in January 2022 it totaled 163.7 million workers (157.2 million employed plus 6.5 million unemployed). The adult (age 16 and older) population in January 2022 was 263.2 million, which leaves 99.5 million adults not in the labor force (total population of 263.2 million less 163.7 million in the labor force).
Some useful measures of the labor market are the unemployment rate, the participation rate, and the employment ratio. The unemployment rate is the fraction of the labor force that is unemployed. In January 2022, the unemployment rate was 4.0% (6.5 million unemployed divided by 163.7 million in the labor force). Figure 1.3 shows the U.S. unemployment rate for the period since 1890.
The fraction of the adult population in the labor force is the participation rate.
Of the 263.2 million adults in the United States in January 2022, 163.7 million were in the labor force, so the participation rate was 62.2% (because 163.7/263.2 = 0.622 = 62.2%).The employment ratio is the employed fraction of the adult population. In January 2022 the employment ratio was 59.7% (157.2 million employed divided by the adult population of 263.2 million). With an employment ratio of 59.7%, 40.3% of the adult population was not employed in January 2022. Of this 40.3%, 2.5% reflected unemployment and the remaining 37.8% reflected people not in the labor force.[48] Thus a large majority of adults who are not employed at any given time are not in the labor force rather than unemployed.
Changes in Employment Status
The labor market is in a constant state of flux. Even when the unemployment rate remains unchanged from one month to the next, during the month hundreds of thousands of U.S. workers become unemployed and hundreds of thousands become employed.
In Touch with Data and Research
Labor Market Data in Kazakhstan
The Agency of Statistics of the Republic of Kazakhstan (ASRK) is the governmental body responsible for collection and distribution of statistical data, including data pertaining to the labor market. A useful summary of labor market data can be found in the reports Number and Wages of Employees by Types of Economic Activities, published monthly and quarterly, and Basic Indicators of Labor Market, published quarterly.[49] The former report, which has been published since 2000, includes monthly and quarterly data on the number of hired workers, the payroll fund, average monthly wages, real wage indexes, actual time worked by hired workers per week, and the number of open vacancies; the data are presented for various categories of enterprises based on type of economic activity, region, and size. The latter report, published since 2001, includes quarterly data on employment, unemployment, and hours worked each week for various categories of workers based on age, gender, occupation, level of educational attainment, and region.
The data in the Number and Wages of Employees by Types of Economic Activities are obtained from monthly and quarterly establishment surveys (known as the Report on Labor 1T). The monthly establishment survey is obtained from the responses of all large and medium enterprises within the territory of Kazakhstan about their employment, hours worked, employee earnings, and categories of employees. Small enterprises and organizations are surveyed only quarterly.23 The data in the Basic Indicators of Labor Market are obtained from quarterly household surveys and are used to calculate the employment and unemployment rate. The household surveys started in 2001. Every quarter, the ASRK surveys 21,000 households, which represent 0.5 percent of the total population.24
23Agency of Statistics of the Republic of Kazakhstan, Methodological Guidelines on Statistics, third edition, supplemented, Astana 2009, p. 99. Retrieved on November 12, 2012, from http://www.stat.kz/ metod/standart_ARKS/Documents/MEtod_rus.indd.pdf.
24Ibid., pp. 70-71.
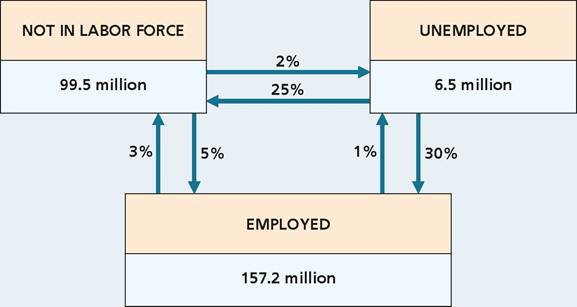
Figure 3.12 shows how workers change their employment status (that is, whether they are employed, unemployed, or not in the labor force) in a typical month (the numbers are from January 2022). The arrows between each pair of boxes represent changes from one employment status to another, and the number on each arrow shows the fraction of the people in one status that switch to the other status in a typical month.25 For example, the arrow from the employed box to the unemployed box has the label 1%, indicating that 1% of employed workers will become unemployed by the following month.
What are the employment prospects of a person who is unemployed? Figure 3.12 shows that 30% of the unemployed people in a typical month will be employed the following month and that 25% of the unemployed people will be out of the labor force the next month. The remaining 45% of the unemployed people will still be unemployed the following month.
Of the 25% of the unemployed who leave the labor force each month, some are discouraged workers, or people who have become so discouraged by lack of success at finding a job that they stop searching. Other unemployed workers leave the labor force to engage in some activity outside the labor market, focusing on household duties such caring for a young child or an elderly parent, or going to school.How Long Are People Unemployed?
Of the 45% of those unemployed in a typical month who remain unemployed the following month, some may remain unemployed for a considerable period of time. The period of time that an individual is continuously unemployed is called an unemployment spell. The length of time that an unemployment spell lasts is called its duration. The duration of an unemployment spell determines in large part the degree of hardship suffered by an unemployed worker. At one extreme, a
25Figure 3.12 makes use of data on transition rates between employment, unemployment, and not-in- the-labor-force status. The rates are from the Bureau of Labor Statistics research series on labor force status flows from the Current Population Survey, www.bls.gov/cps/cps_flows.htm.
FIGURE 3.12
Changes in employment status in a typical month
The arrows between two boxes represent changes from one employment status to another; the labels on the arrows show the fraction of the people in one status who switch to the other status in a typical month. For example, the arrow from the unemployed box to the employed box indicates that 30% of unemployed workers become employed the following month; the arrow from the employed box to the unemployed box indicates that 1% of employed workers become unemployed the following month. The numbers of people in each employment status are from January 2022. Source: Labor Statistics from the Current Population Survey, Bureau of Labor Statistics, available at BLS website at www.bls.gov/cps/cps_flows.htm.
one-week unemployment spell will cost a worker a week's pay but probably will not seriously affect the worker's standard of living.
At the other extreme, an unemployment spell that lasts for several months may force an unemployed worker to exhaust their life savings or to sell a car or house.The duration of unemployment spells in the United States is characterized by two seemingly contradictory statements:
1. Most unemployment spells are of short duration, about two months or less.
2. Most people who are unemployed on a given date are experiencing unemployment spells with long duration.
To understand how both of these statements can be true, consider an economy with 100 people in the labor force. Suppose that at the beginning of every month, two workers become unemployed and remain unemployed for one month before finding new jobs. In addition, at the beginning of every year four workers become unemployed and remain unemployed for the entire year.
In this example, there are 28 spells of unemployment during a year: 24 spells that last one month, and four spells that last one year. Thus 24 of 28, or 86%, of the spells last only one month, which is consistent with the first statement: Most spells are short.
How many people are unemployed on a given day—say, on May 15? There are six unemployed workers on May 15: two unemployed workers who began one-month spells of unemployment on May 1, and four unemployed workers who began one-year spells of unemployment on January 1. Thus, four of six, or 67%, of the workers unemployed on May 15 are experiencing one-year spells of unemployment, which is consistent with the second statement: Most people who are unemployed on a given date are experiencing long spells of unemployment.
So far we have focused on completed spells of unemployment. A completed spell begins when someone becomes unemployed and ends when that person is no longer unemployed, either by becoming employed or by leaving the labor force. However, a common measure of the duration of unemployment focuses on ongoing, or incomplete, spells of unemployment, which are spells that have not yet ended. On any given day, all of the unemployed are experiencing incomplete spells of unemployment because they have not yet become employed or left the
labor force. The measured duration of an incomplete spell of unemployment is the length of time the person has been continuously unemployed up to the current date. The average length of ongoing, incomplete spells of unemployment is called the mean duration of unemployment. In the example in the preceding few paragraphs, six people are unemployed on May 15. Two of them have been unemployed for 0.5 month (since May 1) and four of them have been unemployed for 4.5 months (since January 1). Therefore, the mean duration of unemployment on May 15 is (2 ? 0.5 + 4 ? 4.5)/6 = 3.17 months.
Application
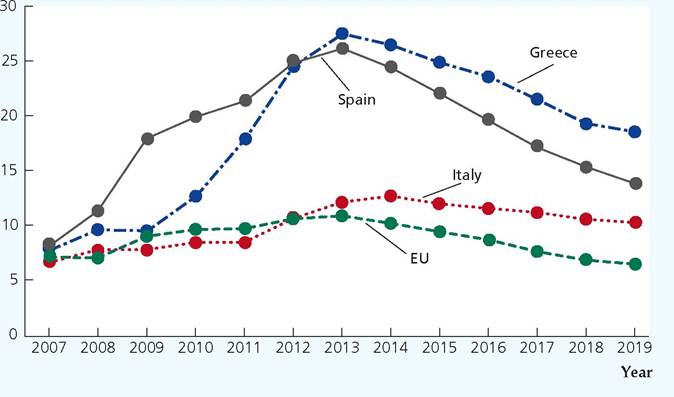
FIGURE 3.13
Unemployment rates during the Great Recession and the European sovereign debt crisis
Steep reductions in wages during the 20072009 recession were followed by layoffs. As governments had reduced employment protection during this time, employment, wages, and hours reduced simultaneously.
Source: Eurostat, “Unemployment by Sex and Age—Annual Average, 2019, https://ec.europa.eu/eurostat/web/ producCsdatasets//lUNE_RT_A.
Why There Always Are Unemployed People
Even when the economy is growing vigorously and many new jobs are being created, some people remain unemployed. Why is unemployment apparently a permanent feature of the economy? Here we discuss frictional unemployment and structural unemployment, two types of unemployment that always exist in the labor market and thus prevent the unemployment rate from ever reaching zero.
Frictional Unemployment. The labor market is characterized by a great deal of searching by both workers and firms. Unemployed workers search for suitable jobs, and firms with vacancies search for suitable workers. If all workers were identical and all jobs were identical, these searches would be short and easy: Unemployed workers would simply have to find firms that had vacancies and they would immediately be hired. The problem, of course, is that neither jobs nor workers are identical. Workers vary in their talents, skills, experience, goals, geographic location (and willingness to move), and amount of time and energy they are willing to commit to their job. Similarly, jobs vary in the skills and experience required, working conditions, location, hours, and pay. Because of these differences, an unemployed worker may search for several weeks or more before finding a suitable job; similarly, a firm may search for a considerable time before it is able to hire a suitable worker.
The unemployment that arises as workers search for suitable jobs and firms search for suitable workers is called frictional unemployment. Because the economy is dynamic, with jobs continually being created and destroyed and workers continually entering and exiting the labor force, there is always some frictional unemployment as workers are matched with appropriate jobs.
Structural Unemployment. In addition to those suffering long spells of unemployment, many people are chronically unemployed. Although their unemployment spells may be broken by brief periods of employment or being out of the labor force, workers who are chronically unemployed are unemployed a large part of the time. Long spells of unemployment and chronic unemployment can't be attributed primarily to the matching process. People in these situations don't seem to search for work very intensively and don't generally find stable employment. The long-term and chronic unemployment that exists even when the economy is not in a recession is called structural unemployment.
Structural unemployment occurs for two primary reasons. First, workers who are unskilled or low-skilled often are unable to obtain desirable, long-term jobs. The jobs available to them typically offer relatively low wages and little chance for training or advancement. Most directly related to the issue of structural unemployment is the fact that jobs held by workers with low-skills often don't last long. After a few months the job may end, or the worker may quit or be fired, thus entering another spell of unemployment. Some workers with low skill levels eventually get enough training or experience to obtain more secure, long-term jobs. Because of factors such as inadequate education, discrimination, and language barriers, however, some workers who are unskilled never make the transition to long-term employment and remain chronically unemployed.
The second source of structural unemployment is the reallocation of labor from industries that are shrinking, or regions that are depressed, to areas that are growing. When industries find that their products are no longer in demand (for example, home builders from 2008 to 2012 following the housing crisis) or that they are no longer competitive (for example, U.S. producers of color television sets that lost much of the market to producers in Asia), workers in these industries lose their jobs. At the same time, some industries will be growing (for example, health care providers and computer software developers). To prevent unemployment from rising requires that workers who lose jobs in declining industries be matched somehow with jobs in growing industries. This matching may involve a long period of unemployment, especially if workers need to relocate or be trained for a new job.
The Natural Rate of Unemployment. Because of the combination of frictional and structural unemployment, an economy's unemployment rate is never zero, even when the economy is at its full-employment level. The rate of unemployment that prevails when output and employment are at their full-employment levels is called the natural rate of unemployment, u. The natural rate of unemployment reflects unemployment owing to frictional and structural causes. Although there is no single official measure of the natural rate of unemployment, many economists believe that the natural rate was about 4% or 5% during the 1950s and increased gradually to about 6% in the 1980s. As of 2021, Federal Reserve policymakers estimated the natural rate to be close to 4.0%. In Chapter 12 we discuss the reasons for the variations in the natural rate.
As output fluctuates around its full-employment level, the unemployment rate fluctuates around the natural rate. The difference between the actual unemployment rate and the natural rate of unemployment is called cyclical unemployment.
Specifically, cyclical unemployment = u — U, where u is the actual unemployment rate and U is the natural rate. Cyclical unemployment is positive whenever the economy's output and employment are below full-employment levels; it is negative when output and employment exceed full-employment levels.
In Touch with Data and Research
Alternative Measures of the Unemployment Rate
The official unemployment rate is the fraction of the civilian labor force that is unemployed. But there are reasonable alternative definitions of who should be counted as unemployed or in the labor force. So, the Bureau of Labor Statistics compiles other measures of the unemployment rate that reflect some of these factors. The alternative measures are as follows:
U-1: Only counts people as unemployed if they have been unemployed 15 weeks or more
U-2: Only counts people as unemployed if they are job losers or persons who completed temporary jobs, so it does not count people who have quit their jobs
U-3: The official unemployment rate; counts people as unemployed if they do not have a job and are looking for a job
U-4: Adds discouraged workers to both the number of unemployed and the civilian labor force; discouraged workers are those who say they are not looking for work because they do not think they can find a job
U-5: Adds both discouraged workers and marginally attached workers to both the number of unemployed and the civilian labor force; marginally attached workers are those who say they are not looking for work but indicate that they want and are available for a job and have looked for work sometime in the past 12 months
U-6: Similar to U-5, but adds persons who are employed part time for economic reasons to the number of unemployed; persons employed part time for economic reasons are those who want and are available for full-time work but have had to settle for a part-time schedule
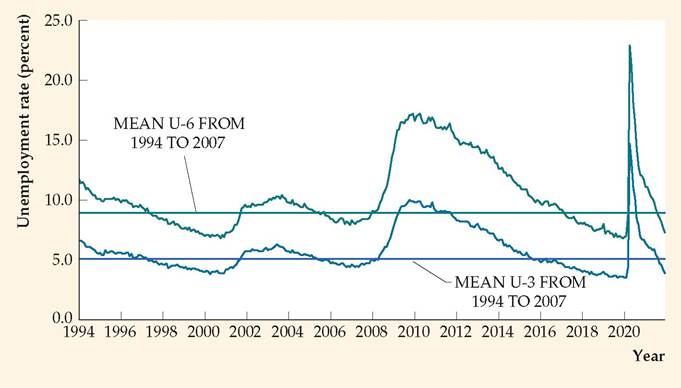
The U-1 measure shows the lowest unemployment rate, and each successive measure shows a higher unemployment rate at each point in time. Although these measures generally move together over time, sometimes the differences in the measures illuminate an aspect of labor-market conditions that may be important for economists and policymakers. For example, Figure 3.14 shows monthly U-3 and U-6 since 1994, and also shows the average values of U-3 and U-6 from January 1994 to December 2007, when the recession of 2007-2009 began. You can see that both U-3 and U-6 increased sharply following the onset of this recession and later fell below their respective average values that prevailed before the recession. But the U-6 measure took nearly two years longer to return to its pre-recession average level than the U-3 measure did, showing that the U-3 measure understated the weakness in the labor market. Following the most recent recession in 2020, both the U-3 and the U-6 measures returned to their pre-recession levels more quickly than in the 2007-2009 recession.
FIGURE 3.14
Alternative Measures of Unemployment, 1994-2021
Following the recession of 2007 to 2009, the various measures of the unemployment rate declined. But the U-6 measure remained elevated for several years after the U-3 measure had returned to its long- run average level.
Sources: Bureau of Labor Statistics, downloaded from FRED database, fred.stlouisfed.org; U-3: FRED series UNRATE;
U-6 FRED series U6RATE.
Application
Recent Trends in Labor Supply
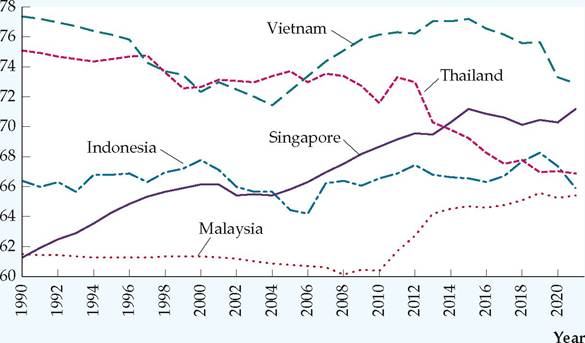
The labor force participation rate (LFPR) in the ASEAN countries shows divergent trajectories, which is plausible given the distinctive economic development of each nation. In general, the trend has been attributed to female participation in the labor force; that is, the ratio of women who are paid for work or searching for it. Based on Figure 3.15, Malaysia recorded an overall labor force participation rate of between 63% and 67%, while Vietnam recorded a higher rate of between 71% and 77%.[50]
Figure 3.15 shows a descending trend in Malaysia's LFPR until 2010. One of the reasons for the declining trend is the inclination of the younger population to pursue higher education along with higher potential income. More recent research, however, reveals a more disturbing reason for the fall in the LFPR among the youth. A high unemployment rate in this demographic, 15.6% at its peak, has been attributed to structural problems such as deficiencies in education quality, mismatch of skills, and low-quality jobs.[51] However, after 2010, the trend levelled off and steadily soared to a participation rate of 65% in 2021. This is attributed to female LFPR, which has risen from about 43% in 2010 to 51.74% in 2019, suggesting that women choose to stay in the labor force longer due to more flexible working arrangements and greater job opportunities.
Vietnam offers a unique reason for its relatively high LFPR compared to its counterparts in the region. With a recorded average of 78% female labor force participation since 1990, there is considerable evidence that the Vietnam War was
FIGURE 3.15
Labor force participation rate, 1990-2021 (ILO estimates)
The labor force participation rates in the selected ASEAN countries show divergent trends due to distinct economic development. An upward trend has been identified in countries like Indonesia, Malaysia, and Singapore, while Thailand shows a declining tendency in its labor supply.
Source: https://data.worldbank. org/indicator/SL.TLF. CACT. ZS?locations=MY-SG-VN- TH-ID
the leading cause for this trend.30 The rise in female LFPR has been attributed to the effects of "missing men" because of war-related mobilization and casualties. Vietnam's female labor participation has received a further boost from government policy promoting more gender equality in education.
While female participation in the labor force is key to explaining the rising trend in the overall LFPR for Malaysia and Vietnam, Thailand observed a steady decline, as only about 67% of its population participated in the labor market. This is attributed to its aging population; Thailand has the second-highest percentage of elderly people among the ASEAN countries, trailing only behind Singapore. The proportion of elderly people in Thailand was reported to have increased from 5.5% in 1980 to 13% in 2020. Research found that older Thai people with pensions and poor health conditions are less likely to participate in the labor force.31 Singapore, on the other hand, has extended their re-employment age from 65 to 67, emphasizing the value of learning from, and growing with, its aging workforce.32
30Merle Kreibaum and Stephan Klasen, "Missing Men: Differential Effects of War and Socialism on Female Labour Force Participation in Vietnam," Courant Research Centre: Poverty, Equity and Growth— Discussion Papers, no. 181, 2015, Courant Research Centre PEG.
31The World Bank Group, "Aging and the Labor Market in Thailand," June 22, 2021, https://www.worldbank.org/en/country/thailand/publication/aging-and-the-labor-market-in-thailand.
32Ministry of Finance, Singapore, "The Big Shift from Young to Ageing Workforce," July 23, 2016, https://www.mof.gov.sg/news-publications/media-articles/The-Big-Shift-from-Young-to-Ageing-Workforce.
3.6