Saving and Wealth
Discuss the measurement of aggregate saving and its relation to wealth.
If you wanted to assess the economic situation of a household, the current income of the household would be an important piece of information.
However, someone with a high current income isn't necessarily better off economically than someone with a low current income. For example, a retired plumber who has no current earnings but owns real estate worth $5 million probably is economically better off than his daughter who is a newly graduated doctor with a high salary but heavy debts left over from medical school. To determine how well off a household is, in addition to knowing current income, you also need to know what the household owns (its assets) and owes (its liabilities). The value of assets minus the value of liabilities is called wealth.As for a household, the economic well-being of a country depends not only on its income but also on its wealth. The wealth of an entire nation is called national wealth.
An important determinant of wealth is the rate of saving: A person who puts aside a quarter of its income each month will accumulate wealth much more quickly than one with the same income who saves only 2% of its income. Similarly, the rate at which national wealth increases depends on the rate at which individuals, businesses, and governments in the economy save. Thus rates of saving and wealth accumulation are closely related.
In this section we present some concepts of aggregate saving and wealth and examine the relationships among them. Our main interest here is measurement. Questions such as what determines the rate of saving in a country are covered in later chapters.
Measures of Aggregate Saving
In general, the saving of any economic unit is the unit's current income minus its spending on current needs. The saving rate of an economic unit is its saving divided by its income.
From a macroeconomic perspective, three important measures of saving are private saving, government saving, and national saving. Summary table 1 outlines the definitions of each measure.Private Saving. The saving of the private sector, known as private saving, equals private disposable income minus consumption. Using the definition of private disposable income from Eq. (2.4), we have
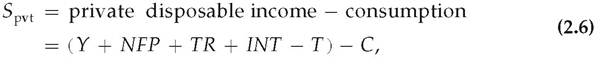
where Spvt is private saving. Consumption is subtracted from private disposable income to obtain private saving because consumption represents the private sector's spending to meet current needs. Investment, although part of private sector spending, is not subtracted from private disposable income because capital goods are purchased to enhance future productive capacity rather than to satisfy current needs. The private saving rate is private saving divided by private disposable income.
Government Saving. Government saving is defined as net government income,
Eq. (2.5), less government purchases of goods and services. Using Sgovt for government saving, we write this definition of government saving as

Equation (2.7) treats total government purchases, G, as the government's spending to meet current needs. Thus the definition of government saving fits the general definition of saving as income less spending on current needs.
However, as we discussed earlier, not all government purchases are in fact devoted to satisfying current needs; some part of G is devoted to the acquisition of long-lived capital, such as schools, highways, and dams. The national income and product accounts break total government purchases into the portion devoted to current needs (referred to as government consumption) and the portion spent on long-lived capital goods (referred to as government investment).
Under this breakdown, government saving could be defined as net government income less government consumption only, rather than net government income less all government purchases. This alternative approach would increase the amount of measured saving and investment in the U.S. economy by the amount of government investment, an amount exceeding $600 billion per year in most recent years.13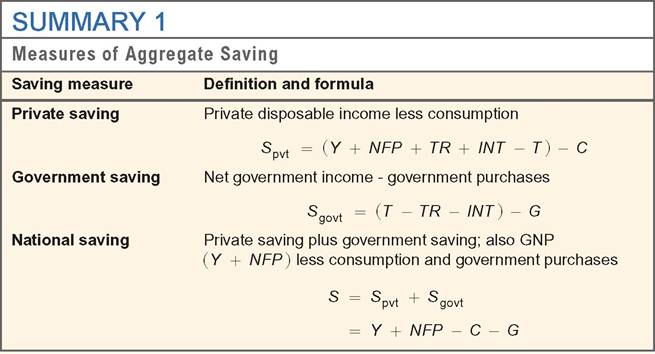
13Note that, by similar reasoning, household spending on cars and other long-lived consumer durables should not be subtracted from private disposable income in the calculation of private saving; however, in practice they are subtracted.
Although the alternative definition of government saving is conceptually more correct, for most analyses in this book, keeping track of government consumption and government investment separately is an unnecessary complication. To keep things simple, we usually ignore government investment, assuming that government purchases are made up entirely of government consumption. With this assumption, we can use the traditional definition of government saving, Eq. (2.7). When considering issues such as the government budget deficit, however, keep in mind that, in fact, some government spending is devoted to building or acquiring long-lived capital goods.
Another, probably more familiar, name for government saving is the government budget surplus. The government budget surplus equals government receipts minus government outlays. Government receipts equal tax revenue, T. Government outlays are the sum of government purchases of goods and services, G, transfers, TR, and interest payments on government debt, INT. Thus the government budget surplus equals T — (G + TR + INT), which, as you can see from Eq. (2.7), is the same as government saving.
When government receipts are less than government outlays, the difference between outlays and receipts is known as the government budget deficit.
Thus, when the government runs a budget deficit, with its outlays greater than its receipts, government saving is negative.National Saving. National saving, or the saving of the economy as a whole, equals private saving plus government saving. Using the definitions of private and government saving, Eqs. (2.6) and (2.7), we obtain national saving, S:
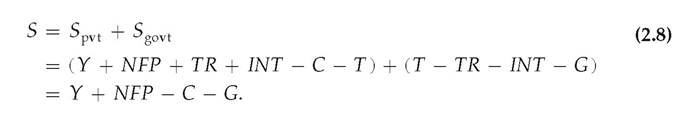
Equation (2.8) shows that national saving equals the total income of the economy, Y + NFP (which equals GNP), minus spending to satisfy current needs (consumption, C, and government purchases, G).
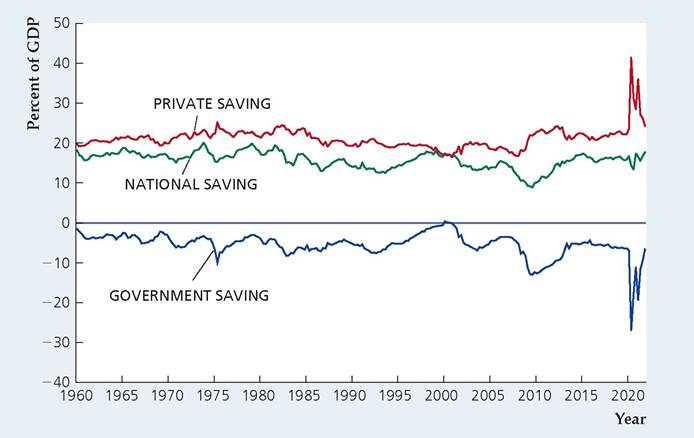
Figure 2.1 shows national saving, government saving, and private saving in the United States since 1960—all expressed as percentages of GDP. Government saving averaged -5.4% of GDP so that national saving fell short of private saving by an average of 5.4% of GDP.[21]
The Uses of Private Saving
How is private saving in an economy put to use? Private saving is used to fund new capital investment, provide the resources the government needs to finance its budget deficits, and acquire assets from or lend to foreigners.
FIGURE 2.1
U.S. saving measures as a percentage of GDP, 1960Q1-2021Q4 National saving has fluctuated in a relatively narrow range since 1960. Movements in national saving mirrored movements in government saving until the pandemic in 2020 and 2021.
Sources: Bureau of Economic Analysis, National Income and Product Accounts, downloaded from Federal Reserve Bank of St. Louis, FRED database, fred.stlouisfed.org/. Private saving: FRED series GPSAVE. Government saving: FRED series GGSAVE (gross government saving, ignoring gross government investment as a component of outlays) minus A782RC1Q027SBEA (gross government investment). National saving: sum of private and government saving. GDP: FRED series GDP.
To derive an important identity that illustrates the uses of private saving, we first use the income-expenditure identity (Eq.
2.3) and substitute C + I + G + NX for Y in the expression for national saving (Eq. 2.8):S = ( C + I + G + NX) + NFP - C - G.
Simplifying this expression, we obtain
S = I + (NX + NFP). (2.9)
The expression for national saving in Eq. (2.9) contains the term NX + NFP, which is the sum of net exports and net factor payments, and is called the current account balance, CA.15 The current account balance equals payments received from abroad in exchange for currently produced goods and services (including factor services), minus the analogous payments made to foreigners by the domestic economy. Substituting CA for NX + NFP in Eq. (2.9), we obtain
S = I + CA. (2.10)
We now have an expression for national saving, S; our goal is an expression for private saving, Spvt. Equation (2.8) shows that private saving, Spvt, equals national saving, S, minus government saving, Sgovt. Then, subtracting Sgovt from both sides of Eq. (2.10), we get

where -Sgovt is the government budget deficit.
[1]Actually, the current account balance also includes the term net unilateral transfers, which measures transfers between countries such as private gifts or official foreign aid (see Chapter 5). In our analysis we generally ignore this term.
Equation (2.11) is another important macroeconomic identity, called the uses- of-saving identity. It states that an economy's private saving is used in three ways.
1. Investment (I). Firms borrow from private savers to finance the construction and purchase of new capital (including residential capital) and inventory investment.
2. The government budget deficit (—Sgovt). When the government runs a budget deficit (so that Sgovt is negative and -Sgovt is positive), it must borrow from private savers to cover the difference between outlays and receipts.
3. The current account balance (CA). When the U.S. current account balance is positive, foreigners' receipts of payments from the United States are not sufficient to cover the payments they make to the United States. To make up the difference, foreigners must either borrow from U.S. private savers or sell to U.S. savers some of their assets, such as land, factories, stocks, and bonds. Thus financing the current account balance is a use of a country's private saving.
In contrast, when the U.S. current account balance is negative, as it was during most of the 1980s, 1990s, and 2000s, U.S. receipts of payments from foreigners are not sufficient to cover U.S. payments to foreigners. To offset this excess of payments over receipts, the United States must borrow from foreigners or sell to foreigners some U.S. assets. In this case, foreigners use their saving to lend to the United States or to acquire U.S. assets.[22]
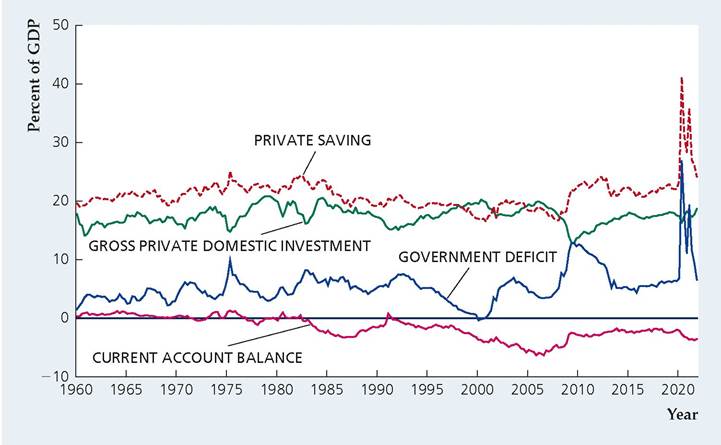
Figure 2.2 shows private saving, investment, the government budget deficit, and the current account balance in the United States since 1960—all expressed as percentages of GDP. Since the early 1990s, the current account balance has been negative, so that foreigners have been buying U.S. assets, providing financing for U.S. investment, and the government budget deficit. In some crisis periods, such as 1975 and 2008-2010, we observe large increases in the government budget deficit accompanied by sharp declines in gross private domestic investment and increases in private saving. In periods of strong growth, such as the late 1990s, we observe a decline in private saving and the government budget deficit, along with a rise in investment.
Relating Saving and Wealth
Saving is a key economic variable because it is closely related to the rate of wealth accumulation. In the rest of this section we discuss the relationship between saving and wealth. To do so, however, we must first introduce the concept of stocks versus flows.
Stocks and Flows. The economic variables we have discussed so far in this chapter—such as GDP and the various types of expenditure, income, and saving— are measured per unit of time (for example, per quarter or per year). For instance,
FIGURE 2.2
Components of the U.S. uses-of- saving identity, 1960Q1-2021Q4
Private saving equals the sum of gross private domestic investment, the government budget deficit, and the current account balance. The current account balance has been negative since the early 1990s, which means that foreigners have been providing funds for U.S. investment and the government budget deficit.
Sources: Bureau of Economic Analysis, National Income and Product Accounts, downloaded from Federal Reserve Bank of St. Louis FRED database at fred.stlouisfed.org. Private saving and government deficit: same as in Fig. 2.1. Investment: FRED series GPDI. Current account balance: FRED series NETFI. GDP: FRED series GDP.
annual GDP figures measure the economy's production per year. Variables that are measured per unit of time are called flow variables.
In contrast, some economic variables, called stock variables, are defined at a point in time. Examples of stock variables include the amount of money in your bank account on September 15 of this year and the total value of all houses in the United States on January 1, 2023.
In many applications, a flow variable is the rate of change in a stock variable. A classic example is a bathtub with water flowing in from a faucet. The amount of water in the tub at any moment is a stock variable. The units of a stock variable (gallons, in this case) don't have a time dimension. The rate at which water enters the tub is a flow variable; its units (gallons per minute) have a time dimension. In this case the flow equals the rate of change of the stock.
Wealth and Saving as Stock and Flow. Saving and wealth are related to each other in much the same way that the flow and stock of water in a bathtub are related. The wealth of any economic unit (a household, firm, or government), also called net worth, is its assets (the things that it owns, including IOUs from other economic units) minus its liabilities (what it owes to other units). Wealth is measured in dollars at a point in time and is a stock variable. Saving is measured in dollars per unit time and is a flow variable. Because saving takes the form of an accumulation of assets or a reduction in liabilities (for example, if saving is used to pay off debts), it adds to wealth just as water flowing into a bathtub adds to the stock of water.
National Wealth. National wealth is the total wealth of the residents of a country. National wealth consists of two parts: (1) the country's domestic physical assets, such as its stock of capital goods and land;[23] and (2) its net foreign assets. The net foreign assets of a country equal the country's foreign assets (foreign stocks, bonds, and factories owned by domestic residents) minus its foreign liabilities (domestic physical and financial assets owned by foreigners). Net foreign assets are part of national wealth because they represent claims on foreigners that are not offset by foreigners' claims on the domestic economy.
Domestic financial assets held by domestic residents are not part of national wealth because the value of any domestic financial asset is offset by a domestic financial liability. For example, a checking account of a U.S. resident in a U.S. bank is an asset for the depositor but a liability for the bank; it thus does not represent wealth for the economy as a whole. In contrast, a U.S. resident's checking account in a foreign bank has no corresponding domestic liability (it is a liability of a foreigner) and so is part of U.S. national wealth.
National wealth can change in two ways over time. First, the value of the existing assets or liabilities that make up national wealth may change. For example, the dramatic increase in the stock market during the 1990s increased U.S. national wealth. The wearing out or depreciation of physical assets, which corresponds to a drop in the value of those assets, reduces national wealth.
The second way that national wealth can change is through national saving. Over any particular period of time, with the value of existing assets and liabilities held constant, each extra dollar of national saving adds a dollar to national wealth. That is,
S = I + CA,
which you will recognize as Eq. (2.10). This equation shows that national saving has two uses: (1) to increase the stock of domestic physical capital through investment, I; and (2) to increase the nation's stock of net foreign assets by lending to foreigners or acquiring foreign assets in an amount equal to the current account balance, CA. But each dollar increase in domestic physical assets or net foreign assets is a one-dollar increase in national wealth. Thus, over a given period of time, an increase in national saving increases national wealth dollar for dollar. As in the example of water flowing into a bathtub, the more rapid the flow of national saving, the more quickly the stock of national wealth will rise.
How do national saving and investment in the United States compare to that in other countries? The United States is a relatively low-saving country, compared with other industrialized nations. Investment is also relatively low in the United States, according to the official statistics.[24] However, investment rates in the United States are generally higher than saving rates. Using the relationship S = I + CA, we see that, if investment, I, is greater than national saving, S, then the current account balance, CA, must be negative. As we mentioned earlier, the U.S. current account has indeed been in deficit nearly every year since 1980. In contrast, high- saving countries such as China have typically had investment rates lower than their saving rates, resulting in consistently positive current account balances for those countries.
2.4