The FE Line: Equilibrium in the Labor Market
Discuss factors that affect the full-employment (FE) line.
In previous chapters, we discussed the three main markets of the economy: the labor market, the goods market, and the asset market.
We also identified some of the links among these markets, but now we want to be more precise about how they fit into a complete macroeconomic system.Let's turn first to the labor market and recall from Chapter 3 the concepts of the full-employment level of employment and full-employment output. The fullemployment level of employment, N, is the equilibrium level of employment_reached after wages and prices have fully adjusted. Full-employment output, Y, is the amount of output produced when employment is at its full-employment level, for the current level of the capital stock and_the production function. Algebraically, full-employment output, Y, equals AF (K, N), where K is the capital stock, A is productivity, and F is the production function (see Eq. 3.4).
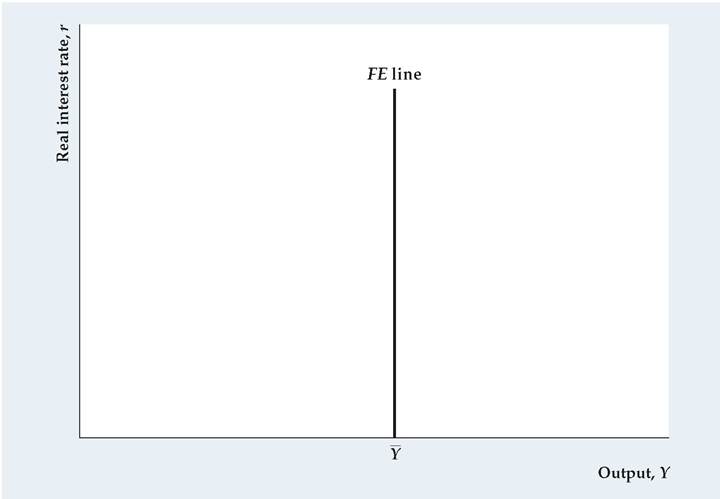
Our ultimate goal is a diagram that has the real interest rate on the vertical axis and output on the horizontal axis. In such a diagram equilibrium in the labor market is represented by the full-employment line, or FE, in Figure 9.1. The FE line is vertical at Y = Y because, when the labor market is in equilibrium, output equals its full-employment level, regardless of the interest rate.2
Factors That Shift the FE Line
The full-employment level of output is determined by the full-employment level of employment and the current levels of capital and productivity. Any change that affects the full-employment level of output, Y, will cause the FE line to shift.
2The real interest rate affects investment and thus the amount of capital that firms will have in the future, but it doesn't affect the current capital stock and hence does not affect current full-employment output.
FIGURE 9.1
The FE line
The full-employment (FE) line represents labor market equilibrium. When the labor market is in equilibrium, employment equals its full-employment level, N, and output equals its full-employment level, Y, regardless of the value of the real interest rate. Thus the FE line is vertical at Y = Y.
Recall that full-employment output, Y, increases—and thus the FE line shifts to the right—when labor supply increases (which raises equilibrium employment N), when the capital stock increases, or when there is a beneficial supply shock. Similarly, a drop in labor supply or capital stock or an adverse supply shock lowers full-employment output, Y, and shifts the FE line to the left. Summary table 11 lists the factors that shift the FE line.
| SUMMARY 11 | ||
| Factors That Shift the Full-Employment (FE | Line | |
| A(n) | Shifts the FE line | Reason |
| Beneficial supply shock | Right | 1. More output can be produced for the same amount of capital and labor. 2. If the MPN rises, labor demand increases and raises employment. Full-employment output increases for both reasons. |
| Increase in labor supply | Right | Equilibrium employment rises, raising full-employment output. |
| Increase in the capital stock | Right | More output can be produced with the same amount of labor In addition, increased capital may increase the MPN, which increases labor demand and equilibrium employment. |
9.2