Article 10.1 Big investors replace banks in $4.2tn repo market
By Tracy Alloway
Financial Times May 29, 2014
Big investors, including hedge funds, mutual funds and real estate trusts, are replacing banks as the biggest users of the overnight funding market that played a key role in the financial crisis.
The repo market, in which borrowers pledge securities as collateral against very short-term loans, was once a popular method for banks to source cheap financing. But the strategy proved destabilising in 2008, when lenders in the repo market lost confidence in mortgage-backed collateral and pulled back on funding.
Since 2008, the repo market has been shrinking as banks have shifted to longer- term financing in response to new regulatory capital rules and other post-crisis pressures. What remains of the $4.2tn market is increasingly being taken up by non-bank entities such as real estate investment trusts (Reits), mutual funds and hedge funds, turning to repo to boost returns during an era of low rates. By using more borrowed money, or leverage, they can take larger positions, but they are also taking a bet that markets will remain stable.
The growing use of repo has been particularly marked among Reits, which have overtaken banks and broker-dealers as the largest borrowers in the market. To purchase long-term mortgage assets, Reits have increased their repo borrowings to $281bn, up from $90.4bn in 2009.
Closed-end funds, which invest in assets ranging from corporate bonds to municipal debt, also have increased their borrowing in the repo market, from $2.74bn at the end of 2007 to almost $8bn now, according to Fitch Ratings data.
Industry participants say there is ample anecdotal evidence that other types of big investors are lending out more of their assets to generate greater returns.
‘It's becoming more of a popular strategy,' said one repo specialist at a large bank. ‘It's an opportunity to enhance yield and hit the return hurdles that investors are looking for.'
Closed-end funds have historically used leverage to help increase their returns.
‘In the low interest rate environment, repo is very attractive,' said Yuriy Layvand, who analyses closed-end funds at Fitch. ‘They're taking that money and investing it further out in the yield curve in fixed income assets.'Additional reporting by Michael Mackenzie.
FT
Source: Alloway, T. (2014) Big investors replace banks in $4.2tn repo market, Financial Times, 29 May.
Generals, specifics and specials
Repos may be backed by general collateral (GC repos) where the securities are fungible and acceptable to the cash lender; the lender of funds is willing to accept any of a variety of Treasury and other related securities as collateral, as long as it is of the required credit quality. An alternative is specific repos, where the collateral is a specified security.
Special collateral repos, ‘specials', are used extensively in the financial markets. Here the lender designates a particular security as the only acceptable collateral. Dealers and others lend money on special collateral repos in order to borrow specific securities needed to deliver against short sales. Superficially, this sounds the same as a specific repo. The key difference is that a special has a repo interest rate that is lower than the GC repo rate. Also there is exceptional specific demand in the cash market for those particular bonds trading ‘on special'. Clearly, not all repo rates with a precisely defined agreed security are below the GC repo rate. Such issues could be called ‘specifics' but should not be called ‘specials'.
To be clear: specials are often used to cover short sales where a dealer sells securities it does not own but still needs to deliver. It then must obtain the designated securities through a repo - a stock-driven transaction. It might be so keen to obtain the securities that it will hand over cash for them, expecting little extra cash on the second leg in the repo. The interest rate on a special collateral RP is commonly called a specials rate.
From the perspective of the institution that happens to be holding the designated securities, it can gain from temporarily selling them through a repo.
This may make sense even if it has no need to borrow money at that time. For example, if the specials rate is 1% per annum, money could be borrowed at this rate using the securities as collateral. This money can then be lent out in the GC repo market. If the interest rate here is 1.4% then a profit can be achieved on the interest rate difference.There are times when the supply of particular securities is limited. Then the specials rate for the security may be significantly below the general collateral rate. When interest rates are very low, as in 2014 in the eurozone, the repo interest can be negative: the cash transferred in the second leg is less than that in the first.
Benchmarks
In the UK a benchmark for interest charged on repos with a maturity one day later is arrived at daily by the WMBA by consulting a group of interdealer brokers on the rates being charged in the market place with lenders and borrowers who use brokers to transact. The rate is called RONIA or Ronia, the Repurchase Overnight Index Average. This overnight funding rate is the weighted average rate to four decimal places of all secured sterling overnight cash transactions brokered in London by contributing WMBA member firms between midnight and 4.15pm with all counterparties regardless of deal size. The weighting is according to the principal amount of deposits which were taken on that day. The gilts bought and repurchased for these deals are delivered via the settlement system called CREST. The borrowing member has gilts on its account to the required value delivered automatically to the CREST account of the money lender. Some advocates believe that Ronia has the potential to take over from the interbank rate in providing the ‘risk-free' interest benchmark - after all, it has collateral backup whereas Libor does not, and it is based on actual transactions.
For euro-denominated repos in the eurozone we have benchmarks calculated daily by the interdealer broker ICAP BrokerTec and fixed-income electronic trading platform MTS.
Together they produce the RepoFunds Rate indices based on trades executed through their electronic platforms. These are for one- day repos using government bonds. The main benchmark combines the repos issued in all the eurozone countries, but there are also repo benchmarks for individual German, French and Italian repos using their government bonds and bills as collateral. RepoFunds Rate indices are reported on an actual/360 day count convention and are published at 18:35 UK/19:35 CET via Bloomberg and Reuters. They can also be seen at www.repofundsrate.com - see Table 10.1,Table 10.1 Euro overnight repo rates, 8 September 2014
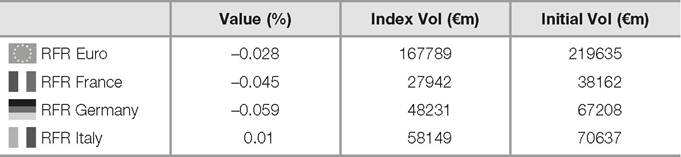
Source: www.repofundsrate.com/overview.htm#
showing average repo rates combining general collateral and specific collateral trades. Note that average interest rates are below zero for three indices. In other words, for a proportion of these deals market participants are willing to pay interest on money they lend. The market makers and other dealers are using the repo market to borrow bonds that are in strong demand in the cash market (and therefore sometimes scarce) in order to fulfil delivery commitments on sales of those bonds in the cash market.
The STOXX® GC Pooling index is a benchmark for secured euro lending transactions and binding quotations that take place on the Eurex Repo GC Pooling Market. These range from overnight to 12-month terms. Eurex Repo also organises a Swiss Franc Repo Market for financial institutions to borrow and lend in the interbank repo market. A wide range of high-quality fixed-income securities apart from government bonds and bills is accepted by the market participants with terms from intraday up to 12 months.
In America, the Depository Trust and Clearing Corporation DTCC GCF Repo Indices track the average daily interest rate paid for the most-traded repo contracts for the sale and repurchase of (1) US Treasury bills, (2) federal agency securities and (3) mortgage-backed securities (MBS) issued by Fannie Mae and Freddie Mac.
Table 10.2 shows the extraordinarily low rates on 9 September 2014 - less than 0.1% per annum. Figure 10.1 tracks how US repo rates changed over a year - the lowest line is for the strongest collateral, Treasury bonds and bills, the middle line is for federal agency securities and the highest line is for mortgage-backed securities. Figure 10.2 displays the amount borrowed: billions every day. The interest on dollar repos is based on actual number of days of the deal divided into a 360-day year.In the US, the Federal Reserve of New York section known as The Desk uses repos and reverse repos for monetary policy, adding or draining reserves of
Table 10.2 US repo rates as reported by the Depository Trust and Clearing Corporation for 9 September 2014
| Security | Latest | 1 -week | 52-week | Par value (billions USD) | |
| High | Low | ||||
| Agency | 0.076 | 0.094 | 0.261 | 0.020 | 15.780 |
| MBS | 0.082 | 0.104 | 0.286 | 0.019 | 68.796 |
| Treasury | 0.067 | 0.099 | 0.255 | 0.010 | 89.796 |
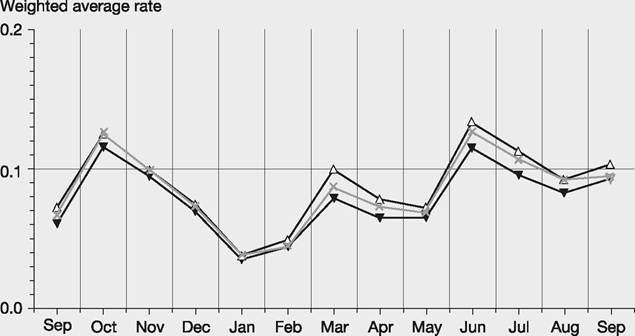
Figure 10.1 US repo rates of interest, September 2013 to 9 September 2014 as measured by the DTCC GCF Repo Index®
Source: www.dtcc.com/charts/dtcc-gcf-repo-index.aspx
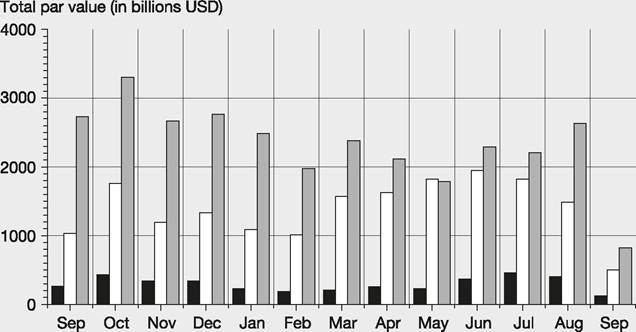
Figure 10.2 US repo volume of transactions September 2013 to 9 September 2014. The first column is agency securities, the second is mortgage-backed securities and the third Treasury
Source: www.dtcc.com/charts/dtcc-gcf-repo-index.aspx
cash to and from the banking system. Repos and reverse repos are arranged by auction among the 21 primary dealers and the 49 reverse repo counterparties approved by the Fed, all of them respected banking/broking institutions. Both primary dealers and reverse repo counterparties must have substantial assets. In 2014 the Fed embarked on greater intervention in the repo market so that it could influence short-term interest rates as the economic recovery took hold - see Article 10.2.