Article 2.2 Hard times force UK seller of gilts on a globe-trotting journey
By Elaine Moore
Financial Times May 21, 2014
In a modest office beneath the shadow of one of London’s newest skyscrapers, the man responsible for selling Britain’s debt to investors around the world is explaining why he has stopped spending so much time at his desk.
‘I think that since the crisis, I have gone out to Asia at least once a year,' says Robert Stheeman. ‘That didn't happen before - [I] barely travelled. But the investor base is more diverse now.'
The UK's unprecedented need to borrow hundreds of billions of pounds from the markets since the financial crisis has pushed Mr Stheeman, a 54-year-old former investment banker, into the limelight over the past few years. As chief executive of the UK's Debt Management Office he is charged with ensuring the country is able to borrow as much as it needs at the lowest rate possible.
The UK's centuries-old system of raising funds by selling bonds - known as gilts after the gilded edges of the old paper certificates - has created one of the most liquid markets in the world.
Keeping up a dialogue with gilt investors is no longer a case of inviting pension funds and insurance companies for tea at the DMO's London office. Mr Stheeman must instead go out into the world to sell - hence the trips to Asia.
International investors are now the largest holders of UK debt, with £413bn - just under a third of the total - as of December. Keeping those investors engaged is not simply a matter of air miles, and the job is made more challenging by the fact that the UK does not know exactly who its overseas investors are.
Many of the central banks and sovereign wealth funds that now buy large volumes of gilts do so through nominee accounts, which do not reveal the underlying investor. ‘We have an idea who they are,' he says. ‘Although they don't like to show their hand.' Composed and fond of answering a question with the aid of a chart, Mr Stheeman personifies the stability he wants investors to associate with the market.
But he acknowledges substantial changes in the past decade.In 2004-5, the country raised £50bn through gilts sales. Six years later, at the peak of the crisis in 2009, the UK had to convince the markets to absorb gilts worth £228bn. This financial year, it plans to raise £127bn.
The rise of overseas investors has also necessitated a change of strategy. Pension funds and insurance companies face liabilities in the future and want long-term investments. Overseas buyers prefer short-term investments. The result is that the number of short-dated bonds issued by the UK has grown rapidly since 2008.
‘One concept I try to convey to [the government] is that we can't force people to buy our debt,' says Mr Stheeman. ‘What we can do is to put in place a framework that makes it attractive to invest in.'
There have been occasions since the crisis began when the allure of gilts seemed under threat. Following the introduction of the Bank of England's gilt purchasing programme - known as Quantitative Easing - a bond auction drew fewer bids than expected for the first time in years. A few years later, credit rating agencies stripped the UK of its triple A grade, citing sluggish economic growth.
Despite these stumbling blocks, demand has remained strong as investors have sought the relative haven of UK government debt.
What he is certain about is that the UK's need to raise very large amounts of money will remain for years to come.
‘The debt stock has increased so dramatically that it cannot go back to pre-crisis levels for a long time,' he says. ‘Not for a generation.'
Gilts remain the main way in which the UK government finances the shortfall between what it spends and what it receives in tax revenues, and borrowing costs have been falling steadily since the 1980s when they exceeded 16%. Yields are expected to rise when the BoE finally raises interest rates above 0.5%.
FT
Source: Moore, E. (2014) Hard times force UK seller of gilts on a globe-trotting journey, Financial Times, 21 May.
Prices and returns
The coupons on different conventional gilts can have a wide range, from 1% to 8¾%. This often reflects just how much interest rates have fluctuated in the past; the coupon percentages were (roughly) the rates of interest that the government had to offer at the time of issue. These original percentages are on the face value only and are not the rates of return offered on the gilt to a buyer in the secondary market today. So, if we take an undated (with no redemption date, going on for ever) gilt offering a coupon of 2.5% on the nominal value of £100, we may find that investors are buying and selling this bond at a price of £50, not at its nominal value of £100, but still receiving the coupon of £2.50. This gilt therefore offers an investor today a yield of 5%.
If we take a redeemable Treasury 10% with five years to maturity currently selling in the secondary market at £120 we glean that it pays a coupon of £10 per year (10% of the nominal value of £100). And investors in the secondary market will receive a current yield of £10 per year for each £120 paid, which equates to 8.33%, worked out as follows:
Interest yield =
Coupon rate
Market price
£10
-=-1°- ? 100 = 8.33%
£120
Accounting for the capital loss over the next five years: the investor pays £120 but will receive only £100 at maturity, a loss of £4 per year over the five years, or as a percentage of what the investor pays £4/£120 ? 100 = 3.33% per year. The yield to maturity, YTM (redemption yield), is approximately
8.33% - 3.33% = 5% (greater precision comes in Chapter 13). The general rules are:
• If a dated gilt is trading below £100 the purchaser will receive a capital gain between purchase and redemption and so the YTM is greater than the current yield.
• If a dated gilt is selling at more than £100 a capital loss will be made if held to maturity and so the YTM is below the current yield.
Of course, these capital gains and losses are based on the assumption that the investor buys the gilt and then holds it to maturity. In reality many investors sell their bonds a few days or months after purchase, in which case they may make capital gains or losses dependent not on what the government pays on maturity but on the market price another investor is prepared to offer. This, in turn, depends on general economic conditions, in particular projected general inflation over the life of the gilt: investors will not buy a gilt offering a 5% redemption yield over five years if future inflation is expected to be significantly higher than this.
As we have seen, bond prices and yields move in opposite directions. If our five-year gilt purchased for £120 offering a coupon of 10% with an approximate redemption yield of 5% is trading in an environment where general interest rates for that risk level rise to 6% because of an increase in inflation expectations, investors will no longer be interested in buying this gilt for £120, because at this price it yields only 5%. Demand will fall, resulting in a price reduction until the bond yields 6% - the bond's market value will then be £116.85 (see calculation method in Chapter 13). A rise in yield goes hand in hand with a fall in price.
Quotes
Tables 2.5, 2.6 and 2.7, from the Financial Times, show the ‘mid-prices' half way between the bid and the offer prices of the government-approved dealers, GEMMs.
Remember, the current redemption yield shown in the FT is relevant only if you are an investor on that particular day paying the price shown. This figure may change daily, reflecting interest rate changes. However, holders
Table 2.5 Gilts - UK cash market on 9 June 2014 - conventional gilts, maturity terms under 15 years
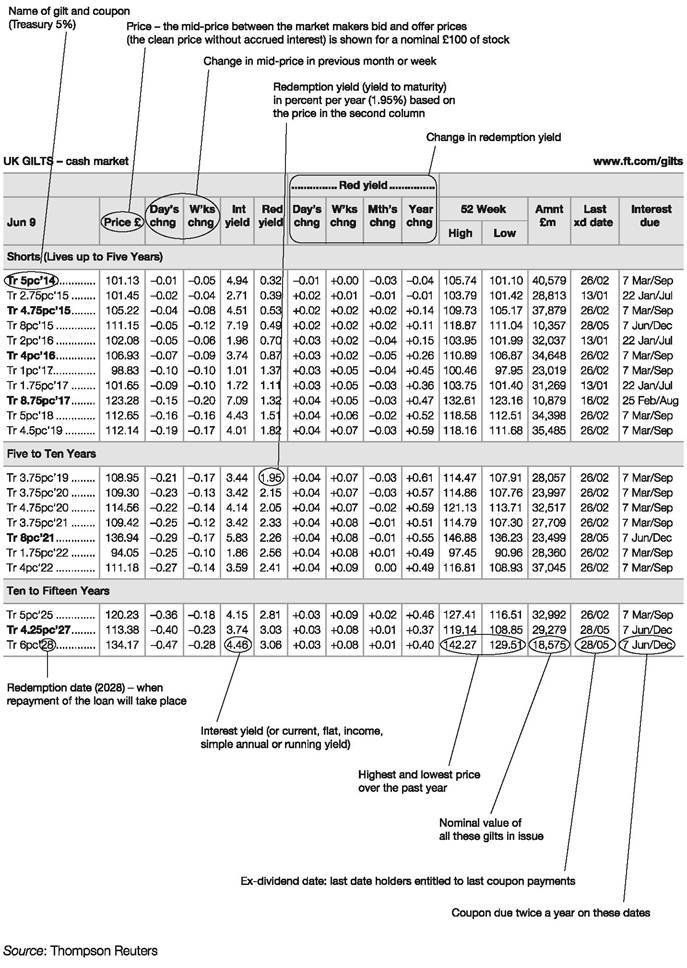
Table 2.6 Gilts - UK cash market on 9 June 2014 - conventional gilts, maturity terms over 15 years
www.ft.com/gilts
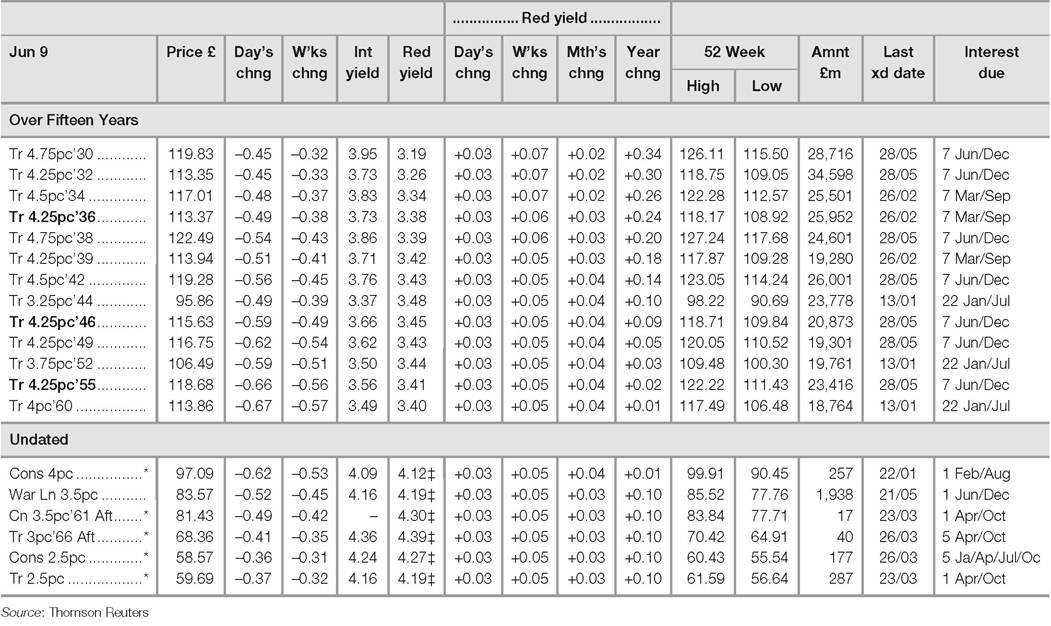
Table 2.7 Gilts - UK cash market on 9 June 2014 - index-linked
The real (after inflation removal) rates of return on the basis of assumed inflation of 5% and 3% (these days the real return is negative).
www.ft.com/gilts
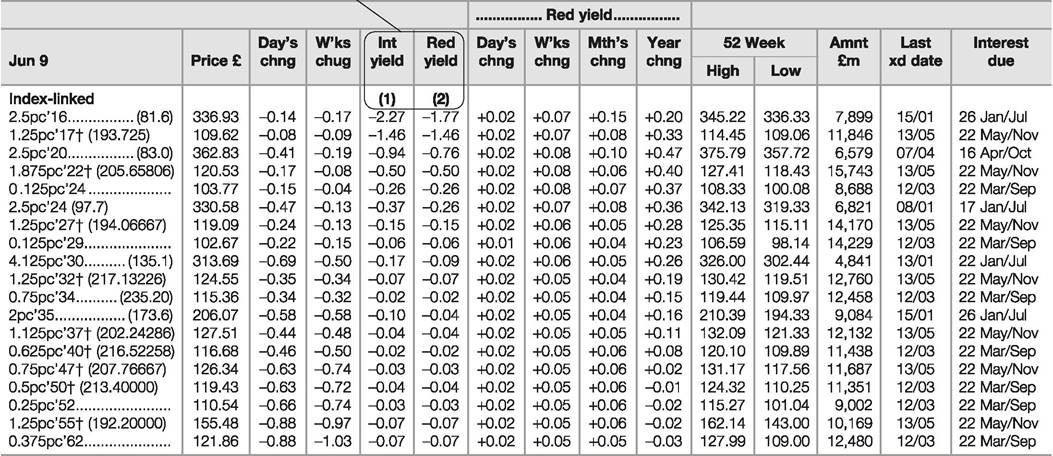
All UK Gilts are Tax free to non-residents on application, ?d Ex dividend. Closing mid-prices are shown in pounds per £100 nominal of stock. Weekly percentage changes are calculated on a Friday to Friday basis. A full list of Gilts can be found daily on ft.com/bond&rates. f Rump gilts Prospective real redemption rate on projected inflation of (1) 5% and (2) 3% (b) Figures in parentheses show RPI base for indexing (ie 8 months prior to issue and, for gilts issued since September 2005, 3 months prior to issue) and have been adjusted to reflect rebasing of RPI to 100 in January 1987. Conversion factor 3.945. RPI for Jan 2012: 238.0 and for Oct 2012 245.6. For those bonds indicated, with a 3m lag. the 'clean' price shown has no inflation adjustment. The yield is calculated using no inflation assumption.
2 GOVERNMENT BONDS
Source-. Thomson Reuters
of the gilt to maturity will receive the yield that was obtainable at the time of purchase.
Redemption yields for gilts are quoted daily online by the Debt Management Office at www.dmo.gov.uk. Other sources of information on prices, and on the gilts market generally, are websites, e.g. www.bloomberg.com, www. fixedincomeinvestor.co.uk, www.hl.co.uk,www.londonstockexchange.com, www.selftrade.co.uk,www.iii.co.uk and www.fitchratings.com.
Investors buying and selling gilts in the secondary market
Institutional investors in bonds deal directly with the GEMMs (the primary dealers). Non-institutional investors can buy or sell gilts through brokers, who contact the GEMMs, dealing on the telephone or online. They need to state the nominal value of the gilts they want to deal and whether they want to trade at best (the best price currently in the market) or with a limit on the price they are prepared to pay (or sell for). High street banks, some building societies, independent financial advisers and even some solicitors and accountants will buy or sell gilts for clients.
The settlement day, the date on which transfer of gilt and payment occur, is usually the next business day after the trade is conducted (T+1), although other settlement dates may be negotiated between the buyer/seller and the GEMM. The CREST system run by Euroclear organises the transfer between investors and maintains records of ownership transferred in the secondary market, usually an electronic record rather than paper certificates. (Euroclear also does this for another 30 bond markets internationally.)
Retail investors can also buy and sell gilts in the primary and secondary markets via the DMO's Gilt Purchase and Sales Service using Computershare (www-uk. computershare.com). It is first necessary to fill in forms to become an Approved Group of Investors member. The investor is not able to specify the price or a maximum/minimum price at which the purchase/sale of gilts is to be made.
Computershare maintains the main register of holdings of gilts under contract from HM Treasury. It will send out coupons (‘dividends') and redemption monies to arrive on the due dates.
Since 2010 retail investors have been able to buy and sell gilts and other bonds through the London Stock Exchange's electronic Order book for Retail Bonds (ORB) where lots can be very small (minimum £1) and the costs of trading are relatively low. The London Stock Exchange authorises dedicated market makers to state bid/offer prices (some are GEMMs). Buyers and sellers are able to set limits on the prices they are willing to pay/accept or simply ask a broker to trade at the current market price. Small investors can now see ORB gilt prices on free financial websites (e.g. www.advfn.com, www. londonstockexchange.com).
Other ways for small investors to gain exposure to the gilt (and/or corporate bond) market is to buy units in a unit trust or shares in an investment trust that specialises in the type of bonds they are interested in. They gain professional management and diversification but will pay fees (sometimes more than 1% per year, which is a lot as a proportion of the annual interest on gilts of, say, 3% or 4%). Exchange traded funds are another alternative. Collective bond funds such as these are discussed in The Financial Times Guide to Investing (Glen Arnold, 2014, Pearson).
Taxation on gilts
The investor's tax bracket influences the return they receive. Currently there are four tax brackets applying to a person's marginal taxable income and capital gains. The interest on gilts is taxed but the capital gains are not, thus higher-rate tax payers are better off if they select gilts with a greater proportion of the total return coming from capital gains rather than coupons. The Financial Times provides a helpful table (Table 2.8) showing the best value gilts in terms of after-tax returns in the four tax brackets. Note that the ‘GRY' (gross redemption yield) shown here is actually a yield calculated after the deduction of tax. So, for example, looking at other databases on 13 June 2014, the gross redemption yield (before tax deduction) for the Treasury 1.75% 2022 is 2.62%, whereas in the so-called ‘GRY' shown in Table 2.8 it is 1.68% for the 40% tax bracket investor and 1.59% for the 45% tax bracket investor. Again note the way in which the prices of index-linked bonds were pushed so high in 2014 that they all provide a negative return after tax and assuming inflation of 3%.
Table 2.8 Gilt issues: best value versus tax status
| Stock | Price | GRY % | Real yield % | |
| Non Taxpayers | ||||
| Conventional 1-5 Years | Treasury 4.5 2019 | 112.84 | 1.68 | |
| Conventional 5-15 Years | Treasury 4.25 07 Dec 2027 | 115.29 | 2.88 | |
| Conventional >15 Years | Treasury 3.25 2044 | 97.88 | 3.35 | |
| Index Linked 1-5 Yrs | TSYI/L 3MO 1.25 2017 Rg | 110.08 | -1.53 | |
| Index Linked >5 Yrs | TSYI/L 0.125 2044 | 105.89 | -0.07 | |
| 20% Taxpayers | ||||
| Conventional 1-5 Years | Treasury 1.25 2018 | 98.72 | 1.32 | |
| Conventional 5-15 Years | Treasury 2.75 2024 | 100.83 | 2.11 | |
| Conventional >15 Years | Treasury 3.25 2044 | 97.88 | 2.70 | |
| Index Linked 1-5 Yrs | TSYI/L 3MO 1.25 2017 Rg | 110.08 | -1.77 | |
| Index Linked >5 Yrs | TSYI/L 0.125 2044 | 105.89 | -0.09 | |
| 40% Taxpayers | ||||
| Conventional 1-5 Years | Treasury 1.25 2018 | 98.72 | 1.07 | |
| Conventional 5-15 Years | Treasury 1.75 2022 | 95.18 | 1.68 | |
| Conventional >15 Years | Treasury 3.25 2044 | 97.88 | 2.05 | |
| Index Linked 1-5 Yrs | TSYI/L 3MO 1.25 2017 Rg | 110.08 | -2.01 | |
| Index Linked >5 Yrs | TSYI/L 0.125 2044 | 105.89 | -0.12 | |
| 45% Taxpayers | ||||
| Conventional 1-5 Years | Treasury 1.25 2018 | 98.72 | 1.00 | |
| Conventional 5-15 Years | Treasury 1.75 2022 | 95.18 | 1.59 | |
| Conventional >15 Years | Treasury 3.25 2044 | 97.88 | 1.88 | |
| Index Linked 1-5 Yrs | TSYI/L 3MO 1.25 2017 Rg | 110.08 | -2.07 | |
| Index Linked >5 Yrs | TSYI/L 0.125 2044 | 105.89 | -0.12 |
Best performing bonds are selected on highest yield for each marginal tax rate based on closing mid price. Gilts exclude double-dated and rump issues. Prices quoted as £ per £100 nominal. For Inflation-linked gilts: year-on-year inflation.
GRY = Gross Redemption Yield. Data compiled on: May 30th 2014
Source: Barclays plc
Cum-dividend and ex-dividend
Between each six-monthly coupon payment the interest accrues on a daily basis. When you buy a gilt you are entitled to the interest that has accrued since the last coupon. You will receive this when the next coupon is paid. That is, you buy the gilt cum-dividend. Gilts (and other bonds) are quoted at clean prices (flat prices) - that is, quoted without taking account of any accrued interest. However, the buyer will pay the clean price plus the accrued interest value (called the dirty price or full price or invoice price or full accrual price) and will receive all of the next coupon. So, if you buy a gilt four months before the next coupon is due, you would pay the clean price, say £101, plus 60 days' accrued interest, i.e. two months of accrued coupon since the last was paid. The accrued interest for a bond that pays coupons every six months is calculated by taking the annual coupon and dividing it by two to obtain the half-yearly coupon. This number is then multiplied by the fraction of the half-year that has already passed. So, if the bond pays an annual coupon of 7% and is currently quoted at a clean price of £101, the dirty price is:[8]
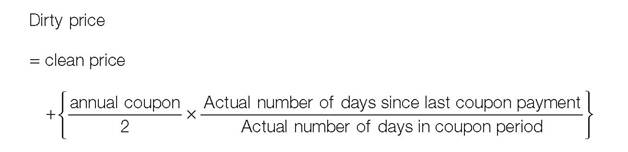
Dirty price = £101 + (£7/2 x 60/182) = £102.1538
If you bought just before the coupon is to be paid, the situation is different. There would not be enough time to change the register to make sure that the coupon goes to the new owner (you). To allow for this problem a gilt switches from being quoted cum-dividend to being ex-dividend (xd) a few days (usually seven) before an interest payment. If you buy during the ex-dividend period, the person you buy from will receive the coupon from the issuer and this will be reflected in the price you pay.
Index-linked gilts
There is a danger with conventional gilts - inflation risk. Say, for example, that you, along with the rest of the gilt-buying community, think that inflation over the next ten years will average 2.5%. As a result you buy ten-year gilts that have a redemption yield of 4.8%, giving a comfortable real income over and above the expected cost-of-living increases. However, two years later inflation starts to take off (oil prices quadruple, or the government goes on a spending spree). Now investors reckon that inflation will average 6% over the following eight years. As a result your gilt yield will fail to maintain your capital in real terms.
With UK government index-linked stocks the coupon amount and the nominal value to be paid on redemption are adjusted according to the Retail Prices Index. The deal here is that the gilt initially offers to pay £100 at the end of its term, say ten years away. It also offers to pay a low coupon, say 0.25%. The key thing about index-linked bonds is that neither the capital sum on maturity nor the coupon stays at these levels unless inflation is zero over the next ten years.
Suppose inflation is 4% over the first year of the bond's life. The payout on maturity would rise to £104. However, this inflation-linked uplift happens every year (more specifically, the uplift for inflation occurs every six months). So, if over the ten years the inflation measure has risen by 60%, the payout on the bond is £160. This means that you can buy just as many goods and services at the end with the capital sum as at the beginning of the bond's life (if you paid £100). Furthermore, the coupon rate also rises through the years if inflation is positive. So after the inflation experience in the first year, the coupons for the first six months of the second year go up by 4%, (£0.25 ÷ 2) ? (1 + 0.04) to £0.13. The situation is slightly more complicated than this in that the inflation figures used are those for three months preceding the relevant coupon dates, but this example illustrates the principle.[9]
Any future rises in inflation lead to further growth in the coupon, so that the last coupon will be 60% larger than the initial coupon rate if inflation over the ten years accumulates to 60%, paying £0.40 per £100 nominal.
Because most investors hold index-linked gilts to maturity secondary market trading is thin and dealing spreads are wider than for conventional gilts.
Many governments now issue index-linked bonds - a sample is shown on the Financial Times website, see Table 2.9. ‘ Break even inflation' means the rate of inflation that would make the returns from conventional gilts and index- linked gilts the same. This is implied by the difference between gross redemption yield on conventional government bonds and the pre-inflation-uplift return offered on an index-linked gilt of the same maturity. That is, if you observe the gross redemption yield from a conventional gilt to be 2.8% over ten years, and you know that the capital repayment and coupons from a ten- year index-linked bond are increased by inflation, what inflation rate would be required so that the index-linked bond return would also be 2.8%, given its
Table 2.9 Index-linked bonds issued by a number of governments
| Price | Yield | Month return | Break even inflation* | Value Stock | ||
| Jun 11 | Jun 11 | Jun 10 | ||||
| Can 4.25% '21 | 130.98 | 0.09 | 0.07 | -0.79 | 2.08 | 5.2 |
| Fr 2.25% '20 | 115.88 | -0.32 | -0.35 | 0.17 | 0.98 | 20.0 |
| Swe 0.25% '22 | 100.45 | 0.27 | 0.27 | 0.10 | 1.35 | 26.4 |
| UK 2.5% '16 | 336.71 | -1.74 | -1.75 | -0.22 | 2.63 | 7.9 |
| UK 2.5% '24 | 330.17 | -0.24 | -0.24 | -0.97 | 3.07 | 6.8 |
| UK 2% '35 | 206.13 | -0.04 | -0.03 | -1.17 | 3.42 | 9.1 |
| US 0.625% '21 | 103.84 | 0.08 | 0.07 | -1.30 | 2.11 | 35.8 |
| US 3.625% '31 | 137.97 | 0.74 | 0.73 | -2.05 | 2.25 | 16.8 |
Representative stocks from each major market
* Diff between conventional and IL bond. t Local currencies. ≠ Total market value. In line with market convention, for UK Gilts inflation factor is applied to price, for other markets it is applied to par amount. Source: Merrill Lynch Global Bond Indices
current price and coupon?[10] ‘Value stock' means the volume in issue expressed in the local currency, e.g. the UK 2.5% 2016 has £7.9 billion in issue.
Inflation-linked bond issues are taking off across Europe - see Article 2.3.