China’s Vulnerability
Even after China’s imperial era ended in 1912 with the abdication of the Qing dynasty in favor of a new republic, the authorities maintained a similar currency system based on silver coins.
The new Republican dollar became the legal standard, with the distribution of these standardized coins expanding after the Nationalist government established itself in Nanking in 1927 (see T’ang, 1936, chapter II). The Nationalists, under Chiang Kai-shek, gradually extended their control over the economy until the “Nanking decade” was ended by all-out war with Japan in July 1937.[72] The “yuan” currency units referred to in this chapter reflect the silver coin standard that was maintained until November 1935. With other major world economies having moved away from silver and tied their currencies to gold by the end of the nineteenth century, China, like Hong Kong, enjoyed a flexible exchange rate with the “gold bloc.” This flexibility ended up being a double-edged sword, however, as it tied the currency to a commodity whose price was not only determined abroad but, after 1933, strongly driven by the actions of the United States. China had got a boost from a depreciating exchange rate during the early years of the Great Depression as silver prices fell, automatically pulling China’s currency lower relative to the gold bloc countries (see, for example, Friedman, 1992; Lai and Gau, 2003). However, these benefits dissipated as, following the United Kingdom’s exit from the gold standard in 1931, the old gold bloc started adopting floating, and rapidly depreciating, exchange rates. The US Silver PurchaseAct of June 19,1934 then put sudden additional upward pressure on China’s silver-based currency.The scale of the US silver purchases was such that, by May 31, 1935, the Treasuryhad accumulated over 421 million ounces ofsilver-283 million of which came from open-market purchases coupled with 25 million ounces of newly produced domestic silver and nearly 113 million from nationalization of preexisting silver stocks (Blum, 1959, p.
194).[73] The US price of silver bottomed out in December 1932, briefly falling below 25 cents an ounce (Westerfield, 1936, p. 26). The silver price then more than doubled between December 1933 and April 1935, peaking at 81 cents an ounce on April 26, 1935 (Friedman, 1992, p. 67). The sharply rising monthly closing price of silver in NewYork is shown in Figure 5.1. As silver rose, the value of China’s currency rose too and the declining number of yuan required to purchase each US dollar over this period of rising silver prices is shown in Figure 5.2. The approximate 40% rise of China’s currency against the US dollar in 1933-1935 was accompanied by a near 50% rise against the pound sterling and a 177% rise against the Japanese yen from 1931 to 1935 (Chung-kuo k’o-hsueh yuan, 1958, p. 112).Friedman (1992, p.76) draws attention to the fact that, in the face of all this currency appreciation, China suffered an accelerating decline in imports, in both nominal and real terms, over the 1933-1935 period. The import decline peaked in 1934 (Table 5.1) and, in real terms, Chinese imports fell by an overall 39.3% between 1930 and 1935 while exports fell by 12.9%.[74] The sharp fall in imports in 1934 was accompanied by a sudden increase in
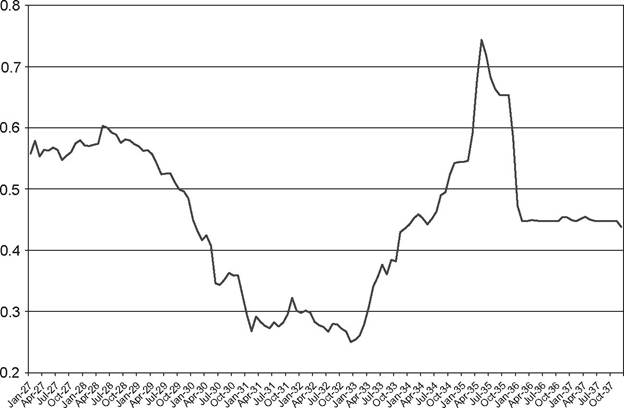
Figure 5.1. Silver Price in NewYork, January 1927-December 1937 (end-of-month $US closing prices).
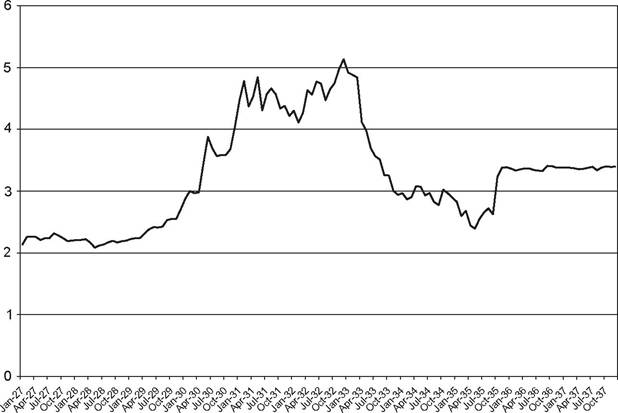
Figure 5.2. Exchange Rate vs. the US Dollar, January 1927-December 1937 (yuan/$US, end-of-month closing prices).
Table 5.1. China’s Imports, Exports, and Silver Flows, 1926-1936
| Year | Import Quantity Index | Export Quantity Index | Percentage Change in Imports | Official Percentage Change in Exports | Estimated Net Outflow of Silvera | Clandestine Exports of Silvera |
| 1926 | 100.0 | 100.0 | — | — | -82,891 | — |
| 1927 | 82.3 | 98.9 | -17.7% | -1.1 | -101,400 | - |
| 1928 | 100.7 | 107.4 | 22.4 | 8.6 | -165,764 | - |
| 1929 | 107.2 | 108.4 | 6.5 | 0.9 | -164,877 | - |
| 1930 | 98.2 | 94.6 | -8.4 | -12.7 | -104,395 | - |
| 1931 | 99.1 | 92.0 | 0.9 | -2.7 | -70,803 | - |
| 1932 | 81.3 | 69.9 | -18.0 | -24.0 | + 11,444 | - |
| 1933 | 79.1 | 82.9 | -2.7 | 18.6 | + 14,122 | - |
| 1934 | 64.4 | 83.1 | -18.6 | 0.2 | +256,728 | +23,214 |
| 1935 | 59.6 | 82.4 | -6.8 | -0.8 | +59,397 | +230,117 |
| 1936 | 55.0 | 81.7 | -7.7 | -0.8 | +249,623 | +40,041 |
a Denominated in thousands of Chinese yuan.
Source: Cheng (1956, pp. 70, 263); Chung-kuo k'o-hsUeh yuan (1958, pp. 108-109); and author's calculations.
the QutflowofsilverfromChina, rising from 14 million yuan in 1933 to over 256 million yuan in 1934.[75] China had previously enjoyed an inflow of silver, and the switch from inflows to modest-sized outflows in 1932 coincided with the second largest import decline over the 1926-1936 period. The 1934 outflow was comprised primarily of silver shipments by foreign banks in Shanghai. As shown in Table 5.2, the foreign banks' aggregate silver holdings dropped from 275.7 million yuan in December 1933 to just 54.7 million yuan in December 1934, with over 80% of the decline occurring after July 1934. Over 30% of the December 1933 silver stock was held by a single bank, the Hongkong and Shanghai Banking Corporation (HSBC), which cut its own silver holding from 83.9 million yuan to 7.5 million yuan in 1934 alone (see Tamagna, 1942, p. 104; King, 1988, p. 408). Meanwhile, Chinesebanks' silver holdings actually held relativelysteady at 280.3 million
Table 5.2. SilverStockPositionsinShanghai, 1931-1935
| Date | Chinese Banks | Foreign Banks | Total |
| December 1931 | 179,117 | 86,883 | 266,000 |
| June 1932 | - | - | 369,000 |
| December 1932 | 252,955 | 185,045 | 438,000 |
| June 1933 | - | - | 447,000 |
| December 1933 | 271,800 | 275,660 | 547,500 |
| July 1934 | 330,600 | 232,200 | 562,800 |
| December 1934 | 280,300 | 54,702 | 335,000 |
| June 1935 | - | - | 341,000 |
| September 1935 | 293,400 | 42,700 | 336,100 |
Notes: Figures are in thousands of Chinese yuan.
Sources: Tamagna (1942, p. 104); Cheng (1956, p. 79); Young (1971, p. 200); and author's calculations.
yuan, down 15% from the July 1934 level but still up 3% from December 1933. The drain of funds associated with the silver outflow appears to have generated significant liquidity problems, as evidenced by rising interest rates and declining stock values in Shanghai. In addition, as demonstrated later on, HSBC's large silver sales did not prevent its own share price from suffering in the midst of the worsening conditions that followed the US silver purchases.
Deflation persisted in China from 1932 until 1935 as reflected in Figure 5.3, which plots Shanghai wholesale prices from 1927 until the outbreak of open warfare with Japan in July 1937. This deflationary trend got underway after the initial appreciation of China's currency against the pound sterling and the Japanese yen in 1931 was followed by a rapid rise against the US dollar once the United States exited the gold standard in early 1933 (Figure 5.2). The financial center of Shanghai was initially cushioned from the contractionary effects of China's currency appreciation, however, benefiting from an inflow of silver from China's interior that more than offset the external outflow in 1932-1933 (see Burdekin, 2008). Total Shanghai silver stocks steadily increased from 266 million yuan at the end of 1931 to over 560 million yuan in mid-1934 (Table 5.2).[76] Unfortunately, this favorable position quickly evaporated in the second half of 1934 once large-scale US silver purchases got underway. Shanghai suffered a double blow from not
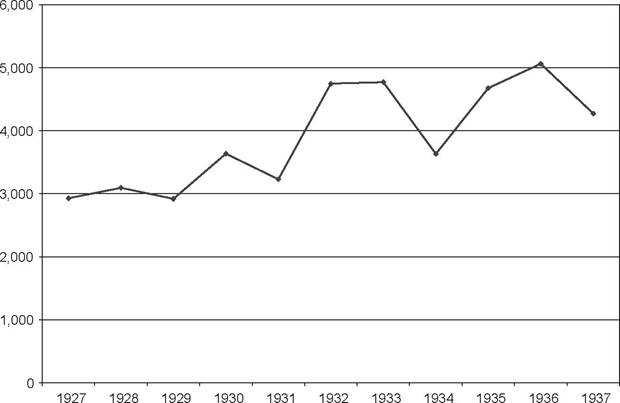
Figure 5.3. ShanghaiStockMarketIndex, 1927-1937 (end ofyear value-weighted series denominated in yuan).
only large outflows of silver abroad but also an abrupt reversal of the internal flow of silver into the city. T’ang (1936, p. 109) attributes the sudden reversal of the internal flow of silver into Shanghai in September 1934 as being
due not to internal conditions, but mainly to external.
Most of the silver shipped from Shanghai to the interior found its way out of the country, and was ultimately purchased by the United States Government.The significance of the shift in the internal flows of silver at this time is noted by Friedman (1940, p. 53), who also documents the sharp acceleration in the rate of business failures in 1934 and a more than 50% decline in property values within Shanghai’s foreign enclave:
Shanghai, center of British interests, was seriously affected... The monthly average of reorganizations in 1933 was 5.08, by 1934 it was 107.50, and for the first six months of 1935, 155.17. The monthly average number of failures was 17.83, 30.50, and 41.67 for 1933, 1934, and 1935, respectively. The number of new buildings constructed in the InternationalSettlementfellfrom 8,699 in 1931 to 4,571 in 1934, while the assessed value of these buildings fell from Ch.$ 64,466,532 to $27,600,350.
The volume of real estate transactions in Shanghai fell by over 92% between 1931 and 1934 and then declined by a further 42% over the first ten months of 1935 (Lin, 1936, p. 64). With much bank lending tied to real estate, loan activity dried up as well and bank runs emerged in May 1935 in the face of the failure of the American-Oriental Banking Corporation and two other major financial corporations (Leavens, 1939, p. 307; Ji, 2003, pp. 189-190; Burdekin, 2008). King (1988, p. 409) links the problems directly to the drain of silver insofar as “the silver had become the basis of multiple credit expansion, and its export undermined the stability of the banking system.” By June 1935, 13 of Shanghai’s traditional, or “native,” banks had entered liquidation proceedings, while as many as 148 native banks across thirty-one Chinese cities went bankrupt during 1935 (Tam- agna, 1942, p. 83).[77]
The tightening credit conditions were reflected in an upward surge in interest rates in late 1934. Shen (1941, p. 29) notes that interest rates charged by Shanghai’s native banks quadrupled between October 1934 and December 1934, rising from an annualized average rate of approximately 2.6% in October to 12.0% in December- with a high of 21.9% being recorded in that month.[78] Rates remained at elevated levels in January 1935 before declining in February 1935 when government banks stepped in and “provided funds to ease the adjustments among the native banks, which were handicapped by frozen assets even more than the modern-style commercial banks” (Young, 1971, p.
222). The accompanying sharp decline in share prices in 1934 is evidenced in Figure 5.4, which depicts end-of-year value-weighted Shanghai Stock Exchange indices denominated in yuan.[79] At year-end 1934, the market index stood at 3631.573, down 23.9% from its year-end 1933 level of 4769.799. This decrease followed increases of 47.0% in 1932 and 0.45% in 1933,[80] and is indicative of a sudden decline following a period of relative prosperity. Market difficulties continued into the early months of 1935, when “trading on the Exchange almost came to a halt because of the extreme tightness of money” (Young, 1971, p. 221). Meanwhile, the ongoing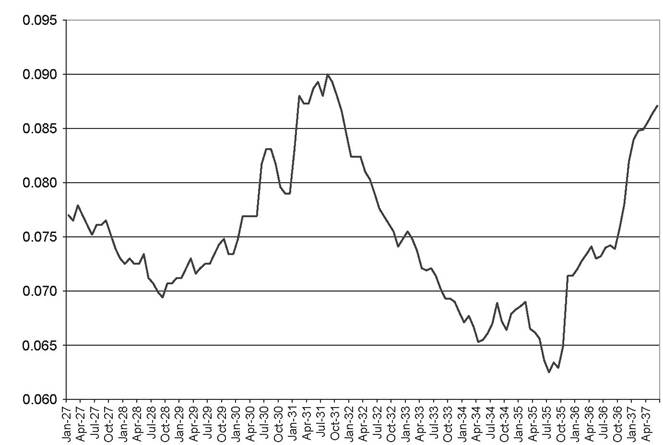
Figure 5.4. ShanghaiWholesale Prices, January 1927-June 1937.
importance of both real estate and the banking sector is suggested by the leading shares of land companies and banks and finance companies in the Shanghai Stock Exchange index (see Table 5.3).
More on the topic China’s Vulnerability:
- Male-Male Rape in Qing Law
- Chinese Religions on Gender and Identity
- RESOURCES AND CAUSES OF CONFLICTS
- Viewpoints of analysis on the International Order of Asia in the 1930s
- 8.2 RIGHTS AND HARMONY