Comparative Trends in Taiwan’s Macroeconomy
As discussed in Chapter 3, after an inflation spike in 1993-1994, mainland China went into deflation when it was hit by the 1997-1998 Asian financial crisis. Taiwan did not initially slide into deflation at that time, but deflation did emerge in the island’s economy during the later 2000-2001 global slowdown.
Unlike mainland China, and most other East Asian countries, Taiwan movedawayfromafixedexchangerateregimewellprior totheAsian financial crisis. After switching to its current “managed float” exchange rate regime in 1978, Taiwan enjoyed both low levels of inflation and low variability of inflation, with inflation generally kept below 5% since the end of the 1979-1980 oil price shock. Central bank policy responsiveness to inflation is implied by such recent reaction function studies as Chang (2005) and Huang and Lin (2006). Chang (2005) also identifies a significant response to stock prices. Although neither study finds a significant response to output fluctuations, Cover, Hueng, and Yau (2002) argue that actual performance of the Taiwanese economy in terms of both output and price variability compares favorably to simulated performance under a variety of hypothetical central bank policy rules over the 1978-1999 period. None of these studies, however, considers central bank responses to mainland Chinese variables. Given the high level of openness of Taiwan’s economy (the share of exports and imports being close to 100% of GDP) and dependence on China, both direct policy responses to Chinese variables, as well as indirect responses via the effects of mainland China variables on domestic economic indicators, seem plausible. Indeed, the relationship between Taiwan and its much larger main trading partner and neighbor bears some basic similarity with that between Canada and the United States - a case where such direct and indirect responses to developments in the larger partner are known to have been of considerable importance (cf. Burdekin and Burkett, 1992).As discussed in Chapter 4, the People’s Bank has adopted a money supply targeting strategy, with a particular emphasis on broad money (M2). Taiwan’s central bank also emphasized M2 growth during the 1990s. Whereas the link between M2 growth and consumer price inflation in Taiwan has not always been consistent over the post-1961 period (Shen, 2002), both M2 and the consumer price index (CPI) trend downward over the 1990s. As with mainland China, these declines accelerated with the coming of the Asian financial crisis and (eventually) culminated in outright deflation. Nevertheless, mainland China and Taiwan both weathered the Asian financial crisis much better than almost all other East Asian economies, which typically experienced both massive currency depreciation and severe recession.[161] Although not sharing mainland China’s rigid capital controls - that still leave the renminbi convertible only on the current account today (Chapter 1) - Taiwan shared China’s strong foreign reserve position and low level of external debt. Taiwan’s economy subsequently turned downward in 2001, however, as reflected in both negative economic growth and a sharp increase in unemployment. The unemployment rate actually jumped from just under 3% in 2000 to 4.57% in 2001, while the New Taiwan dollar depreciated by over 6% against the US dollar in that year. Although this depreciation was considerably smaller than the 18.7% depreciation experienced in 1997 during the Asian financial crisis, Taiwan’s economy was quite severely impacted - much more so than mainland China’s - by the bursting of the Nasdaq bubble in 2000 and the terrorist attacks of September 11, 2001. Political frictions likely also acted to exacerbate the 2001 economic weakness in Taiwan (see Yang and Shea, 2005).
An ongoing concern is that excessive flows of Taiwanese investment capital to the mainland may have left domestic producers starved of capital - leading Lin (2005), for example, to strongly argue against any creation of a “cross-strait common market” that would further integrate Taiwan into mainland China’s economy.
Meanwhile, Huang (2007) argues that capital outflows to mainland China, recently running at 4% to 6% of Taiwan’s overall GDP, have been a major factor depressing Taiwan’s domestic investment rates. On the other hand, Chen (2006) believes that Taiwan is in a transition phase from a traditional export-orientated economy to a more advanced intensive economy - and sees the capital outflow as a positive factor allowing Taiwanese firms to benefit from a cheaper manufacturing base and an expanded market.[162] In any event, declines in Taiwan’s GDP deflator and CPI ended in 2004. Wholesale prices recovered earlier, generally trending upward from 2000. Yang and Shea (2005) attribute this divergence between wholesale and consumer price performance in Taiwan to the influence of mainland China’s demand for raw materials and capital goods in boosting global prices of such goods and thereby boosting Taiwan’s import prices as well. Expansionary policy by Taiwan’s central bank was reflected in successive reductions of the discount rate from 4.75% in June 2000 to 1.375% in June 2003 (Yang and Shea, 2005).Meanwhile, the seeming undervaluation of Taiwan’s currency was accompanied by foreign reserve accumulation that, in percentage terms at least, rivaled that enjoyed by mainland China. Mainland China’s ongoing reserve buildup, as well as the hefty Taiwanese reserve accumulation over the 1980s and 1990s, was discussed in Chapter 2. Central bank foreign exchange reserves in Taiwan actually increased by nearly 100% from 2000-2003, rising from $US 106.7 billion at the end of 2000 to $US 206.6 billion at the end of 2003 (Yang and Shea, 2005). The rate of increase of Taiwan’s foreign exchange reserves slowed after 2003, however, increasing by only a total 28.8% over the next three years to $US 266.1 billion at the end of 2006 (Central Bank of China [Taiwan]). In order to see how Taiwan has fared overall in recent years, and the extent to which its performance may have become linked to mainland China, we consider data on a key set of macroeconomic variables collected over a 1994-2005 sample period.[163]
Although the economies of mainland China and Taiwan can certainly not be said to always move in lockstep, both economies do appear to have enjoyed a similarly strong pickup in industrial production after 2001 (Figure 9.1).[164] In Taiwan’s case, the return to positive real growth in 2002 was reflected in gains in industrial production that then accelerated after 2002.
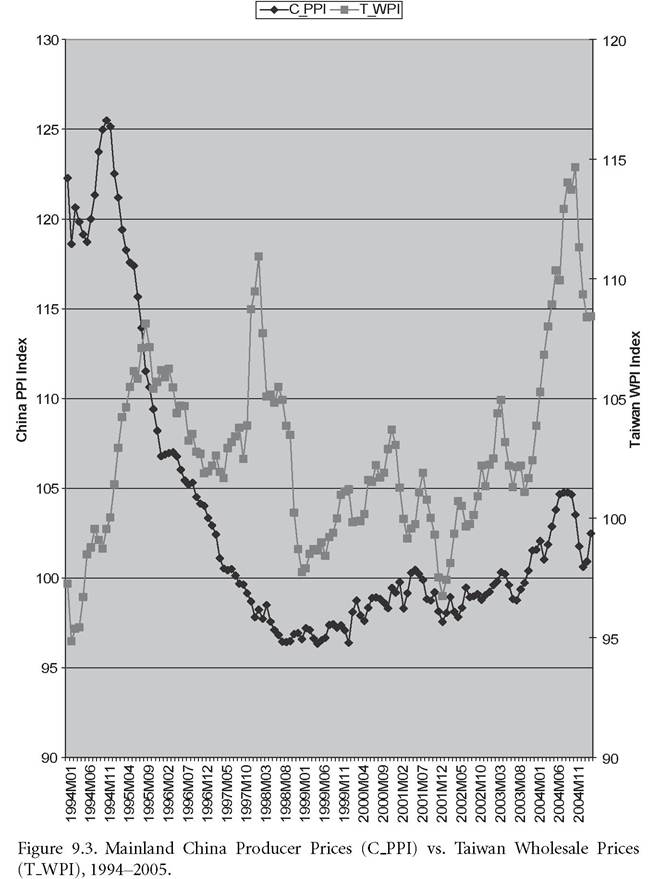
The question of whether any of this recovery is linked to the turnaround in mainland China’s economic position is addressed empirically in the next section. Meanwhile, the upward trend in both consumer price indices prior to the Asian financial crisis is evident in Figure 9.2 - followed by a leveling off in both series prior to renewed increases in 2003-2004. As noted earlier, the exact timing of the deflation differs somewhat, though, with mainland China both entering and exiting deflation earlier than Taiwan. Comparison between mainland China’s producer price index (PPI) and Taiwan’s wholesale price index (WPI) in Figure 9.3 suggests divergent trends over the earlier part of the sample followed by common upward movements after 1998. However, Taiwan’s WPI enjoys a noticeably bigger increase from 2001 onward.We also consider possible commonalities between money growth rates in mainland China and Taiwan, considering year-to-year growth rates in both M2 and M1 money supply measures - and in Taiwan’s case an
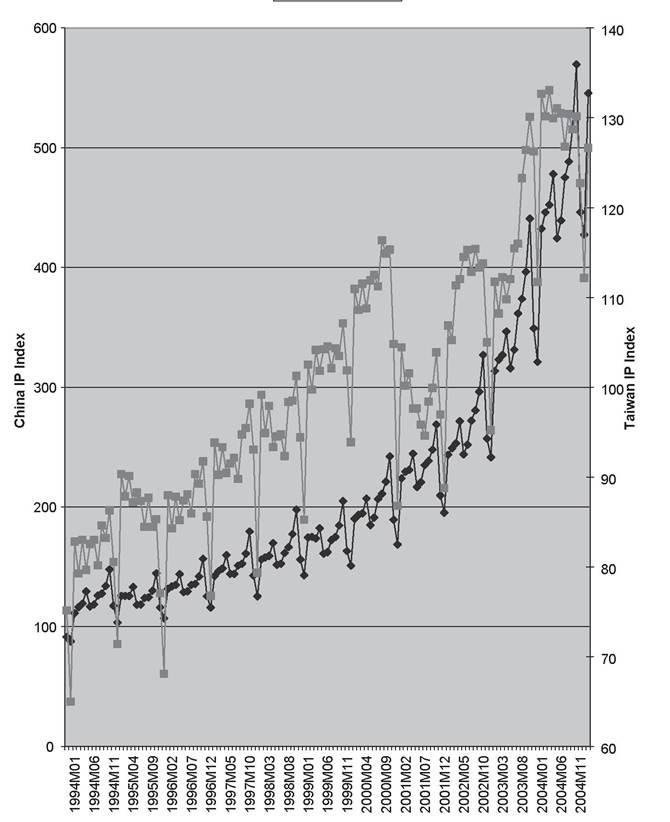
Figure 9.1. Mainland China Industrial Production (CIP) vs. Taiwan Industrial Production (TIP), 1994-2005.
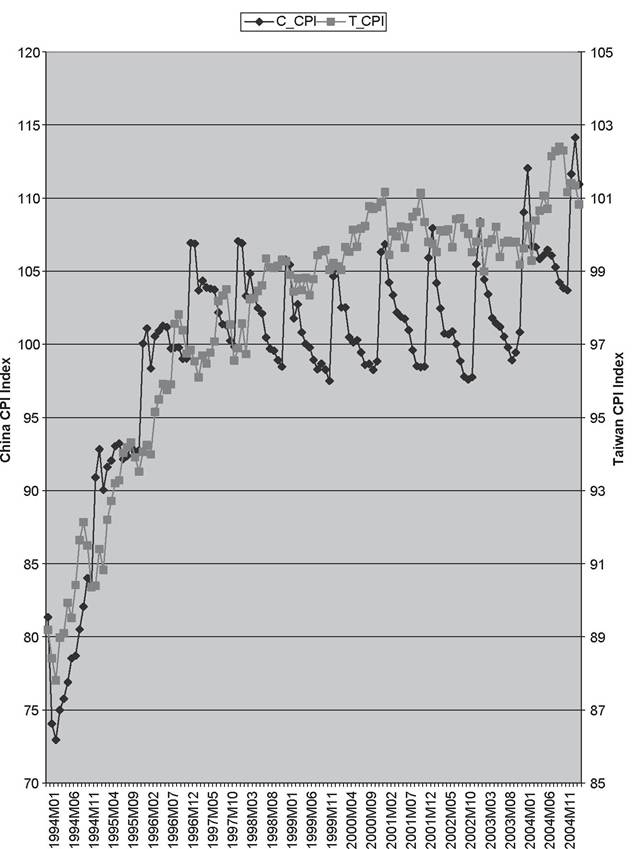
Figure 9.2. Mainland China Consumer Prices (C_CPI) vs. Taiwan Consumer Prices (T-CPI), 1994-2005.
extended Ml money supply definition (M1B) that includes passbook savings deposits (Figures 9.4-9.6).15 The different pairs of money growth rates generally appear to match each other’s ups and downs quite closely over 1994-2005, with mainland China’s Ml and Taiwan’s MlA growth especially moving almost in tandem save for an extra surge in Taiwanese M1A in 2004. Finally, we consider respective stock market performances based on the value of the Taipei stock market and the Shanghai “A” Share index (Figure 9.7). The linkages between mainland China and Hong Kong financial markets, and possible long-run, cointegrating relationship between the Shanghai and Hong Kong stock markets, was discussed in the preceding chapter. The data displayed in Figure 9.7 suggest that the Shanghai and Taipei stock markets may also feature a certain degree of commonality, insofar as both markets appear to follow a similar trajectory over the 1994-2000 period. After that point, the Taipei index breaks down sharply before recovering in 2002, however, whereas the Shanghai index peaks in early 2001 and then enters an extended downturn through 2005.[165] [166]