Empirical Evidence on the Relationship Between the Mainland China and Taiwan Macro Variables
Strong output correlations between mainland China and Taiwan have been identified by Cheung, Chinn, and Fujii (2007a, p. 39), who point to the degree of output co-movement rising above 0.5 during 1991-2002 - higher, in fact, than the implied output co-movement between mainland China and Hong Kong.[167] While Cheung, Chinn, and Fujii (2007a, chapter 4) suggest that overall integration between mainland China and Taiwan outweighed financial market linkages, they do not explicitly consider possible monetary policy responsiveness to developments in the other economy.
Otherwise, most prior studies of interactions between mainland China and Taiwan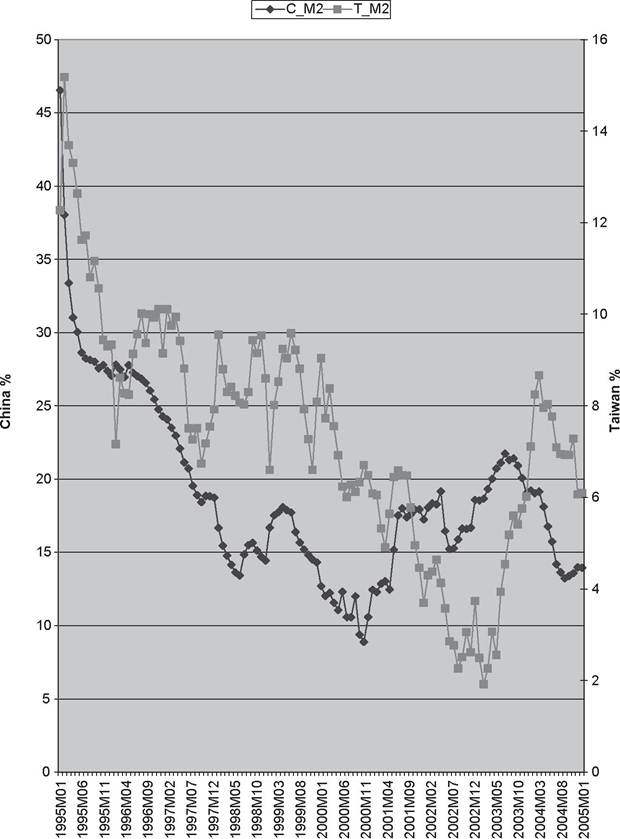
Figure 9.4. Mainland China M2 Growth (C_M2) vs. Taiwan M2 Growth (T_M2), 19942005.
have tended to be more narrowly focused on either trade relationships or stock market interdependence. Significant linkages between mainland China and Taiwan stock markets, as well as with Hong Kong, have been consistently identified in such studies as Bahng and Shin (2004), Cheng and Glascock (2005, 2006), and Chi, Li, and Young (2006). Notwithstanding
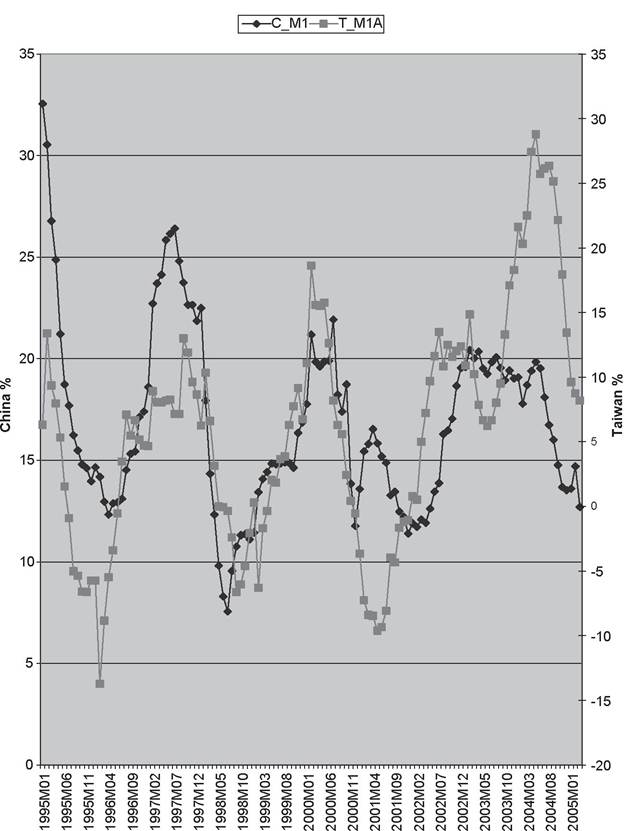
Figure 9.5. Mainland China Ml Growth (CM1) vs. Taiwan M1A Growth (T_M1A), 1994-2005.
significant short-run effects of US markets on the Greater China group (Wang and Firth, 2004), there is more mixed evidence concerning longer- run integration, or cointegration, with the US market (Cheng and Glascock, 2005, 2006; Chi, Li, and Young, 2006).
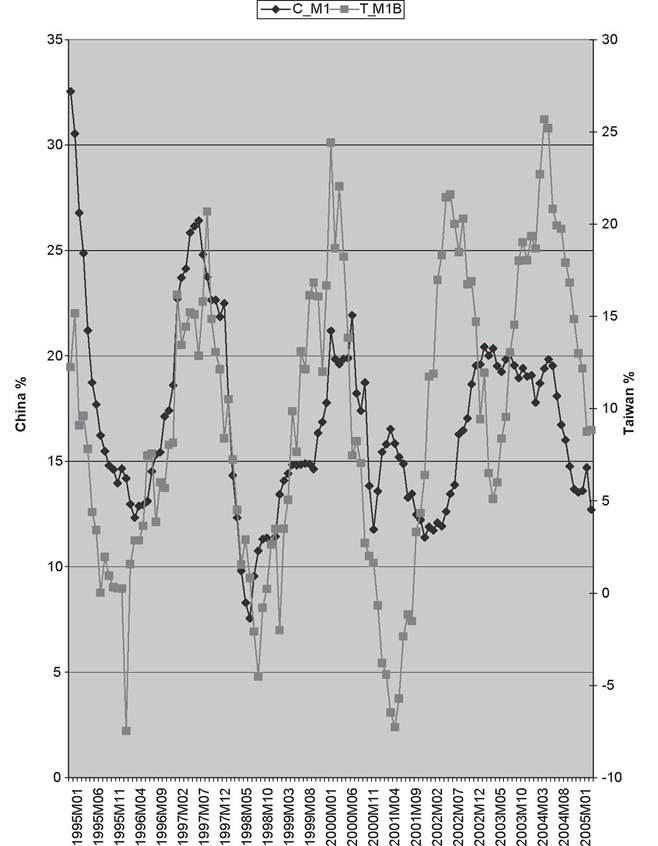
Figure 9.6. Mainland China Ml Growth (CMi) vs. Taiwan M1B Growth (T~M1B), 1994-2005.
It seems important to allow for a broader range of potential interactions and interdependence between mainland China and Taiwan that goes beyond stock market indices alone and considers possible monetary interdependence as well as price and output relationships.
We begin by examining the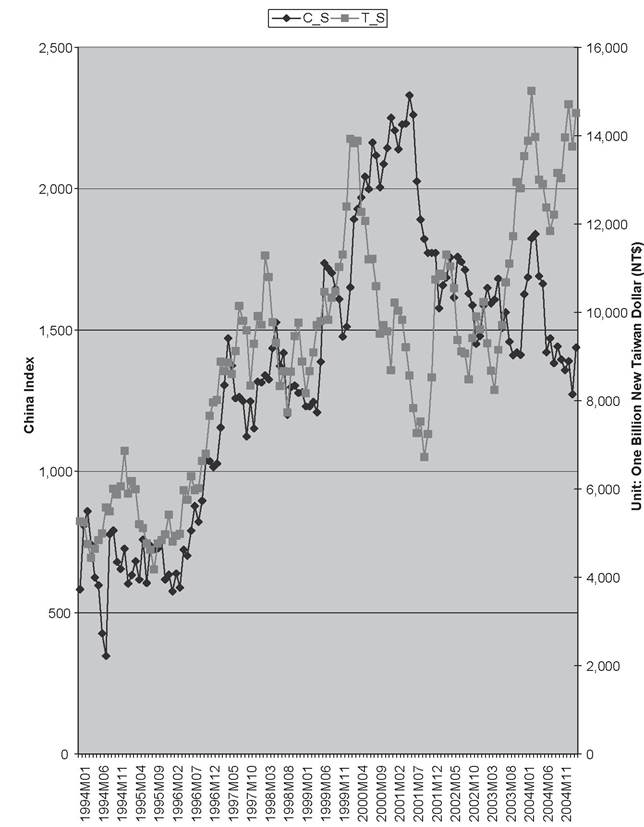
Figure 9.7. Shanghai “A” Shares (CS) vs. Taipei Market Value (CS), 1994-2005.
simple correlation coefficients between our mainland China and Taiwan variables. These data are all monthly series from January 1994 through March 2005.18 These correlations generally reflect the correspondence
18 Seasonality has been removed from the data via the Holt-Winters exponential smoothing method.
suggested in the preceding figures. With the series specified in levels, Table 9.5 shows sample correlations between the mainland China and Taiwan series pairs to be 0.89 for industrial production, 0.82 for consumer prices, 0.9 or higher for the three money supply pairs, and 0.67 for the stock market series. Only the mainland China PPI and Taiwan WPI fail to exhibit such conformity with a correlation of -0.05. When the series are converted to growth rates, the correlation values naturally decline but still remain substantial. Table 9.6 shows sample correlations of 0.24 for industrial production growth, 0.73 for consumer price inflation, 0.54 for M2 growth, 0.44 and 0.43 for mainland China M1 growth versus Taiwan M1A and M1B growth, respectively, and 0.42 for the stock market series. The mainland China PPI versus Taiwan WPI correlation becomes 0.10 with the series in growth rate form.
The Table 9.6 correlations also suggest high degrees of co-movement between M2 growth and consumer price inflation in both mainland China and Taiwan, with M2-CPI correlations of 0.79 for mainland China and 0.71 for Taiwan. Furthermore, there is a correlation coefficient of 0.49 between mainland China M2 growth and Taiwanese consumer inflation and a correlation of 0.65 between Taiwan’s M2 growth and mainland China’s consumer inflation. These results suggest possible mutual sensitivity of inflation performance to monetary policy on the other side of the Taiwan Strait.
There are also some high correlations between money growth and industrial production growth and share price movements. Chinese industrial production growth exhibits a 0.25 correlation with own M1 growth and a 0.62 correlation with Taiwan M1A growth but no positive correlation with either M2 measure. Taiwanese industrial production growth has a 0.36 correlation with mainland China Ml growth and a correlation of 0.68 with Taiwan M1A growth but only minimal positive correlations with the M2 measures. Finally, Shanghai share price growth has a 0.37 correlation with mainland China Ml growth and 0.36 with respect to Taiwan M2 growth, whereas Taiwanese share growth has a correlation of 0.52 with mainland China Ml growth and even higher correlations with Taiwan MlA and MlB growth.Causal relationships between the mainland China and Taiwan variables are examined by Granger-causality testing (a technique previously illustrated in Chapter 5). It is possible for both variables to exert causal effects on each other, a situation described as “bidirectional” causality. The data series are all specified in growth rate form in this case in order to assure stationarity. The results reported in Table 9.7 generally suggest that significant, bidirectional relationships underlie the sizeable correlations displayed in Table 9.6
Table 9.5. Means, Standard Deviations, and Correlations with Data in Levels
| Chinese Variables | CJP | C-CPI | CJ>PI | CJM2 | C-Ml | c_s | ||||||
| Mean | 216.84 | 99.33 | 103.32 | 12,564.98 | 4,708.03 | 1,357.74 | ||||||
| Standard Deviation | 109.19 | 7.84 | 7.83 | 6,249.90 | 2,277.16 | 482.18 | ||||||
| Taiwanese Variables | TJP | T.CPI | T-WPI | T-M2 | T-MlA | T-MlB | T-S | |||||
| Mean | 100.25 | 97.72 | 102.74 | 168,970.31 | 18,220.16 | 43,922.48 | 90,734.71 | |||||
| Standard Deviation | 15.35 | 3.46 | 3.92 | 36,452.48 | 3,427.91 | 12,920.12 | 27,536.49 | |||||
| Correlation Table | ||||||||||||
| CJP | C-CPI | CJ>PI | CJM2 | C-Ml | c_s | TJP | T.CPI | T-WPI | TJM2 | T-MIA | TJMIB T_S | |
| CJP | 1 | |||||||||||
| C-CPI | 0.47 | 1 | bgcolor=white> | |||||||||
| CJ>PI | -0.31 | -0.79 | 1 | |||||||||
| CJM2 | 0.94 | 0.62 | -0.52 | 1 | ||||||||
| CJMl | 0.95 | 0.59 | -0.49 | 1.00 | 1 | |||||||
| C-S | 0.44 | 0.56 | -0.73 | 0.62 | 0.61 | 1 | ||||||
| TJP | 0.89 | 0.51 | -0.50 | 0.89 | 0.90 | 0.62 | 1 | |||||
| T.CPI | 0.64 | 0.82 | -0.87 | 0.79 | 0.78 | 0.81 | 0.75 | 1 | ||||
| T-WPI | 0.46 | 0.42 | -0.05 | 0.34 | 0.34 | -0.10 | 0.34 | 0.24 | 1 | |||
| TJM2 | 0.86 | 0.69 | -0.66 | 0.97 | 0.96 | 0.77 | 0.88 | 0.89 | 0.24 | 1 | ||
| T-MlA | 0.94 | 0.53 | -0.31 | 0.92 | 0.93 | 0.42 | 0.85 | 0.62 | 0.49 | 0.84 | 1 | |
| T-MlB | 0.95 | 0.59 | -0.44 | 0.98 | 0.99 | 0.56 | 0.89 | 0.73 | 0.39 | 0.94 | 0.97 | 1 |
| T-S | 0.71 | 0.68 | -0.63 | 0.79 | 0.78 | 0.67 | 0.81 | 0.76 | 0.25 | 0.83 | 0.80 | 0.83 1 |
Notes: C_Y and T_Y refer to mainland China and Taiwan industrial production; C-CPI and T-CPI refer to mainland China and Taiwan consumer price indices; C-PPI and T-WPI refer to mainland China and Taiwan producer price and wholesale price indices; C_M1, T_M1A, and T-MlB refer to mainland China and Taiwan narrow money supplies; C_M2 and T_M2 refer to mainland China and Taiwan broad money supplies; and C_S and T_S refer to mainland China and Taiwan stock market indices.
Sources: Data sources are noted in the body of the chapter.
Table 9.6. Means, Standard Deviations, and Correlations with Data in Growth Rate Form
| Chinese Variables | CJP | C-CPI | C-PPI | C-M2 | C-Ml | C-S | |||||||
| Mean | 14.99 | 3.22 | -1.52 | 18.95 | 16.88 | 11.91 | |||||||
| Standard Deviation | 10.38 | 5.80 | 4.05 | 6.15 | 4.48 | 29.82 | |||||||
| Taiwanese Variables | TJP | T-CPI | T-WPI | T-M2 | T-MlA | T-MlB | T-S | ||||||
| Mean | 4.92 | 1.19 | 1.34 | 7.36 | 5.98 | 9.44 | 12.88 | ||||||
| Standard Deviation | 7.63 | 1.37 | 4.80 | 2.58 | 9.02 | 7.96 | 27.69 | ||||||
| Correlation Table | |||||||||||||
| CJP | C-CPI | C-PPI | C-M2 | C-Ml | C-S | TJP | T-CPI | T-WPI | T-M2 | T-MlA | T-MlB | T-S | |
| CJP | 1 | ||||||||||||
| -0.19 | 1 | ||||||||||||
| C-PPI | 0.66 | -0.34 | 1 | ||||||||||
| C-M2 | -0.20 | 0.79 | -0.52 | 1 | |||||||||
| C-Ml | 0.25 | 0.33 | 0.12 | 0.40 | 1 | ||||||||
| C-S | -0.27 | 0.06 | -0.16 | 0.01 | 0.37 | 1 | |||||||
| T-IP | 0.24 | 0.02 | 0.24 | 0.01 | 0.36 | 0.12 | 1 | ||||||
| T-CPI | -0.39 | 0.73 | -0.47 | 0.49 | 0.00 | 0.24 | -0.07 | 1 | |||||
| T-WPI | 0.27 | 0.46 | 0.10 | 0.14 | 0.26 | -0.13 | 0.19 | 0.23 | 1 | ||||
| T-M2 | -0.46 | 0.65 | -0.39 | 0.54 | 0.19 | 0.36 | 0.06 | 0.71 | 0.11 | 1 | |||
| T-MlA | 0.62 | -0.07 | 0.51 | -0.10 | 0.44 | 0.00 | 0.68 | -0.23 | 0.35 | -0.13 | 1 | ||
| T-MlB | 0.40 | -0.13 | 0.36 | -0.04 | 0.43 | 0.04 | 0.67 | -0.33 | 0.14 | -0.14 | 0.90 | 1 | |
| T-S | 0.11 | 0.02 | 0.01 | 0.15 | 0.52 | 0.42 | 0.59 | -0.02 | -0.06 | 0.22 | 0.66 | 0.75 | 1 |
Notes: All series are expressed as year-to-year growth rates.
Table 9.7. Granger-Causality Between Taiwan and Mainland Variables
| Null Hypothesis | F-Statistic | Probability |
| CY does not Granger-cause C_Y | 5.43293 | 0.00545 |
| CY does not Granger-cause T_Y | 28.76580 | 5.00E-11 |
| T_CPI does not Granger-cause CCPI | 12.56710 | 10.00E-05 |
| CCPI does not Granger-cause CCPI | 5.60818 | 0.00463 |
| CWPI does not Granger-cause CPPI | 0.01298 | 0.98710 |
| CPPI does not Granger-cause CWPI | 1.09567 | 0.33745 |
| CM1A does not Granger-cause CM1 | 17.02400 | 2.80E-07 |
| CM1 does not Granger-cause T_M1A | 9.11325 | 0.0002 |
| CM1B does not Granger-cause CM1 | 15.20790 | 1.20E-06 |
| CM1 does not Granger-cause T_M1B | 5.58614 | 0.00473 |
| CM2 does not Granger-cause CM2 | 7.35183 | 0.00095 |
| CM2 does not Granger-cause T_M2 | 6.65427 | 0.00179 |
| CS does not Granger-cause CS | 0.98484 | 0.37622 |
| CS does not Granger-cause CS | 0.77853 | 0.46126 |
| CM2 does not Granger-cause CM1 | 8.41077 | 0.00037 |
| CM1 does not Granger-cause T_M2 | 10.58760 | 5.60E-05 |
| CM1A does not Granger-cause CM2 | 15.06900 | 1.30E-06 |
| CM2 does not Granger-cause T_M1A | 7.25695 | 0.00104 |
| CM1B does not Granger-cause CM2 | 10.07000 | 8.70E-05 |
| CM2 does not Granger-cause T_M1B | 4.91217 | 0.00881 |
| CCPI does not Granger-cause CM2 | 18.77680 | 7.20E-08 |
| CM2 does not Granger-cause T-CPI | 1.77745 | 0.17325 |
| CY does not Granger-cause C_M2 | 10.95710 | 4.10E-05 |
| CM2 does not Granger-cause CY | 5.40058 | 0.00561 |
| CM1A does not Granger-cause CCPI | 2.98119 | 0.05429 |
| CCPI does not Granger-cause CM1A | 0.96619 | bgcolor=white>0.38331|
| CS does not Granger-cause CPPI | 2.55097 | 0.082 |
| CPPI does not Granger-cause CS | 0.49896 | 0.60834 |
| CY does not Granger-cause CPPI | 0.13960 | 0.86984 |
| CPPI does not Granger-cause CY | 7.67532 | 0.00071 |
| CCPI does not Granger-cause CY | 6.17693 | 0.00275 |
| CY does not Granger-cause CCPI | 2.64906 | 0.07462 |
| CM1A does not Granger-cause CY | 88.9482 | 7.00E-25 |
| CY does not Granger-cause CM1A | 0.5796 | 0.5616 |
| CM1B does not Granger-cause CY | 40.95010 | 1.90E-14 |
| CY does not Granger-cause CM1B | 0.12004 | 0.88698 |
| CM2 does not Granger-cause CY | 33.06100 | 2.80E-12 |
| CY does not Granger-cause CM2 | 0.44482 | 0.64194 |
Notes: All data series are in percentage change form to assure Stationarity.
Table 9.8.
Significant Granger-Causality Pairs for the Mainland China Variables| Null Hypothesis | F-Statistics | Probability |
| CM1 does not Granger-cause CCPI | 18.3550 | 9.9E-08 |
| CCPI does not Granger-cause CM1 | 15.5739 | 8.9E-07 |
| CM2 does not Granger-cause CCPI | 4.84528 | 0.00938 |
| CCPI does not Granger-cause CM2 | 14.6167 | 1.9E-06 |
| CM2 does not Granger-cause CM1 | 6.28912 | 0.00249 |
| CM1 does not Granger-cause CM2 | 12.0929 | 1.6E-05 |
| CPPI does not Granger-cause CM1 | 0.88423 | 0.41556 |
| CM1 does not Granger-cause CPPI | 2.89761 | 0.05881 |
| CY does not Granger-cause C_M1 | 6.07875 | 0.00301 |
| CM1 does not Granger-cause CY | 3.14545 | 0.04642 |
| CY does not Granger-cause C_M2 | 25.5511 | 4.7E-10 |
| CM2 does not Granger-cause CY | 10.3926 | 6.6E-05 |
| CPPI does not Granger-cause CCPI | 0.43435 | 0.64864 |
| CCPI does not Granger-cause CPPI | 3.30406 | 0.03992 |
| CS does not Granger-cause CCPI | 0.11304 | 0.89320 |
| CCPI does not Granger-cause CS | 2.07110 | 0.13028 |
| CY does not Granger-cause CCPI | 17.8074 | 1.5E-07 |
| CCPI does not Granger-cause CY | 17.7977 | 1.5E-07 |
| CY does not Granger-cause CPPI | 1.64847 | 0.19643 |
| CPPI does not Granger-cause CY | 2.81699 | 0.06353 |
Notes: All data series are in percentage changes to assure stationarity.
earlier.[168] Table 9.7 shows significant bidirectional Causalitybetween mainland China and Taiwan industrial production, mainland China and Taiwan consumer prices, and each pair of narrow and broad money supply measures. However, the producer price/wholesale price indices and share price measures do not significantly Granger-cause each other. Results for other significant combinations of mainland China and Taiwan variables are also reported in Table 9.7 and these findings suggest that increased money growth in one economy tends to be followed by increased industrial production in the other economy. Additional significant causal effects are seen running from the mainland China PPI to Taiwanese industrial production and from the Taiwanese CPI to mainland China industrial production.
Table 9.8 reports significant Granger-causality pairs among different combinations of mainland China variables, and Table 9.9 provides analogous results for the set of Taiwanese variables. Table 9.8 suggests strongly
Table 9.9. Significant Granger-Causality Pairs for the Taiwan Variables
| Null Hypothesis | F-Statistics | Probability |
| TM1A does not Granger-cause TCPI | 0.92733 | 0.39827 |
| TCPI does not Granger-cause TM1A | 7.75071 | 0.00067 |
| TM1B does not Granger-cause TCPI | 2.62747 | 0.07619 |
| TCPI does not Granger-cause TM1B | 9.40311 | 0.00016 |
| TM2 does not Granger-cause TCPI | 5.24209 | 0.00649 |
| TCPI does not Granger-cause TM2 | 5.20690 | 0.00671 |
| TY does not Granger-cause TM1A | 0.24094 | 0.78624 |
| TM1A does not Granger-cause TY | 34.2098 | 1.3E-12 |
| TY does not Granger-cause TM1B | 0.31650 | 0.72927 |
| TM1B does not Granger-cause TY | 15.7812 | 7.6E-07 |
| TS does not Granger-cause T_M1B | 2.62454 | 0.07640 |
| TM1B does not Granger-cause TS | 2.14804 | 0.12093 |
| TY does not Granger-cause TM2 | 0.08839 | 0.91546 |
| T_M2 does not Granger-cause TY | 7.91591 | 0.00058 |
| TWPI does not Granger-cause TCPI | 2.04127 | 0.13410 |
| TCPI does not Granger-cause TWPI | 0.83703 | 0.43537 |
| TY does not Granger-cause TCPI | 24.2309 | 1.2E-09 |
| TCPI does not Granger-cause TY | 3.39176 | 0.03673 |
| TWPI does not Granger-cause TS | 0.10023 | 0.90470 |
| 2.62001 | 0.07673 |
Notes: All data series are in percentage changes to assure Stationarity.
significant causal effects of M1 and M2 growth on CPI inflation in mainland China as well as significant bidirectional causality between the two different money supply measures. Money supply effects on the PPI are less consistent, however, with only M1 growth having any significant effects, and even here the significance level drops to around the 94% level. There are strongly significant bidirectional relationships between money growth and industrial production growth and between CPI inflation and industrial production growth. There is weaker evidence of an effect of PPI inflation on industrial production and an effect of CPI inflation on share prices that is significant at around the 87% confidence level. In the case of Taiwan, Table 9.9 reveals significant effects of money growth on CPI inflation and industrial production for M2 but generally not for M1A or M1B. Although there is significant bidirectional causality between CPI inflation and industrial production growth in Taiwan, no such relationship holds for the WPI.
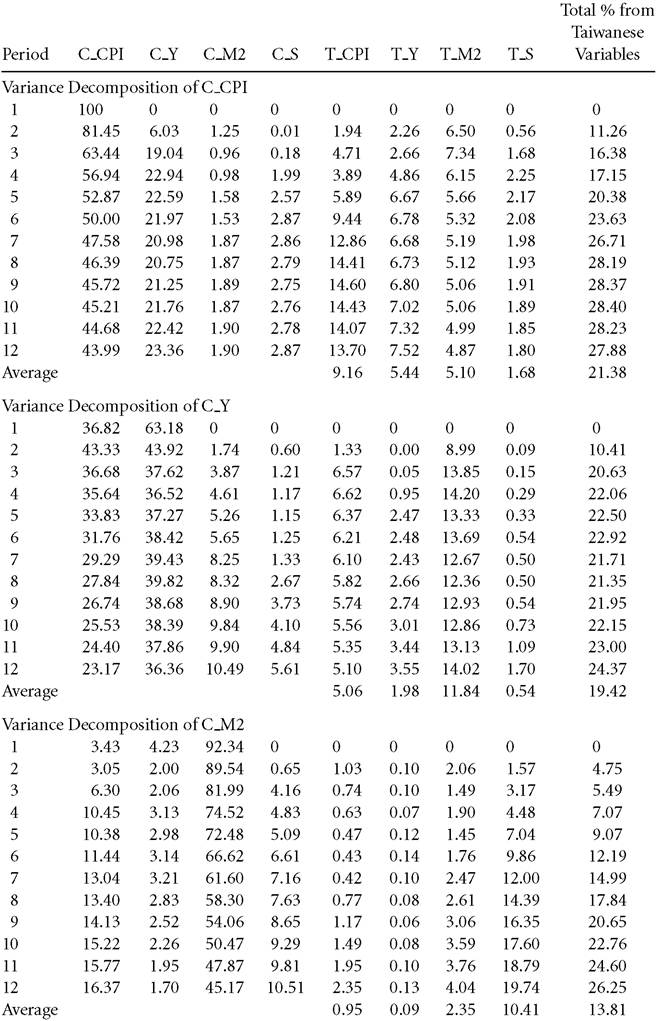
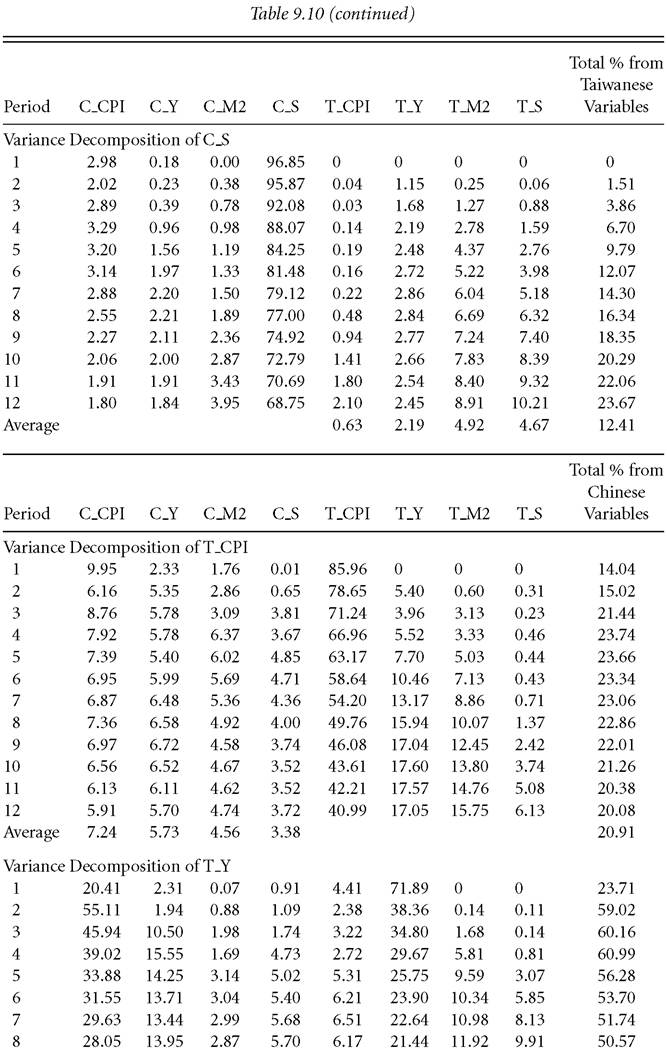
A more general assessment of the importance of macroeconomic interactions between mainland China and Taiwan is provided by “decomposing” the variance of each of the mainland China and Taiwan variables.[169] This variance decomposition assesses the relative importance of fluctuations in domestic variables relative to the effects of their counterpart variables in the other economy. The total effect of the other-economy variables provides a potentially valuable yardstick as to the overall sensitivity of each economy to the other. Given that the application of this procedure is based on examining the full set of variables together as part of a single system, we had to make a choice between the alternative price measures. In light of the findings reported earlier, we employ consumer prices as the price measure for both mainland China and Taiwan. We also use M2 as the money supply measure for both economies - although very similar results were found if the narrow money supply measures are used instead. We look at effects extending over a twelve-period window, which boils down to one year given that all the data are monthly.
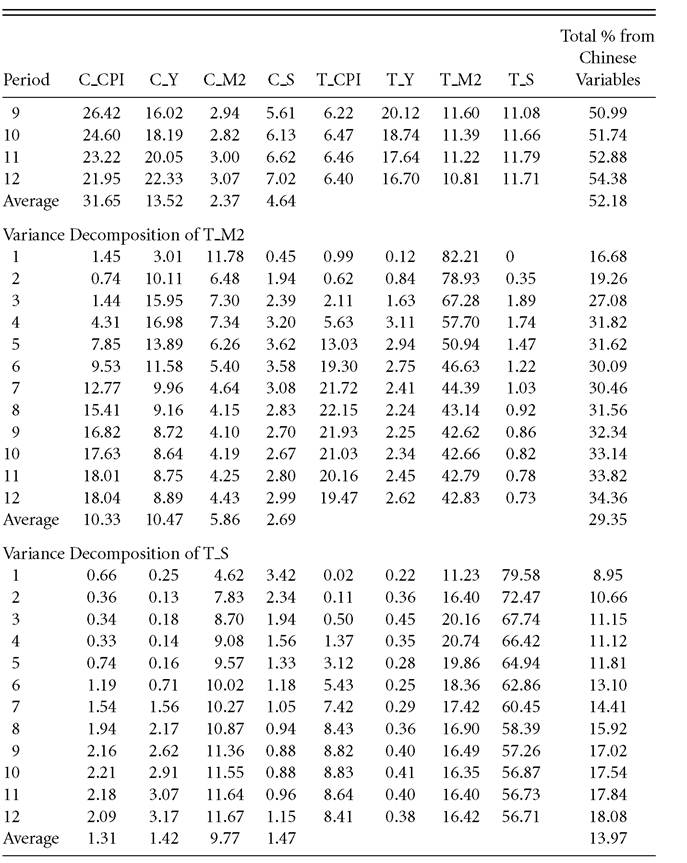
The results reported in Table 9.10 show that the average sensitivity to Taiwanese variables ranges from 21.38% to 12.41% across the four mainland China series. Mainland China CPI appears to feature the greatest sensitivity to developments in Taiwan, while share prices feature the lowest sensitivity. As would be expected, the Taiwanese variables almost always reveal stronger responsiveness to economic fluctuations on the other side of the Taiwan Strait. The only exception to this is the Taiwanese CPI, for which the average contribution to total variance arising from mainland China variables is almost the same as mainland China CPI’s overall sensitivity to the effects of Taiwanese variables. Mainland China variables account for as much as 52.18% of the overall variation in Taiwanese industrial production; 29.35% of the variation in Taiwanese M2; 20.91% for Taiwanese CPI; and 13.97% for Taiwanese share values. These results offer additional confirmation of the high degree of overall interdependence suggested by the preceding correlations and causality-test results, while also revealing that - as would have been expected - Taiwan’s smaller economy is more sensitive to these effects than mainland China’s.
Table 9.10. Variance Decompositions OftheMainland China and Taiwan Variables
(continued)
Note: The analysis was performed with the variables ordered as follows: CCPI, CY, CM2, CS, CCPI, CY, CM2, CS.