Time Series Analysis
This section employs data on the Taiwanese money supply and the Taipei wholesale price index from Liu (1970) along with data on capital inflows into Taiwan from mainland China given by Lin and Wu (1989, p.
934). The mainland Chinese money supply and inflation series are based on the currency series and Shanghai wholesale price data provided by Quddus, Liu, and Butler (1989). As depicted in Figure 6.3, inflation in mainland Chinese and inflation in Taiwan appear to track each other quite closely over the January 1946-April 1949 period except for the interval between August and December 1948, that is, immediately after the implementation of the August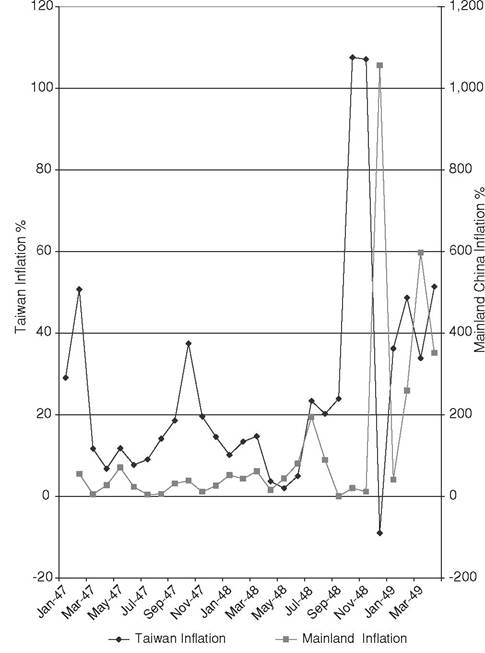
Figure 6.3. Taiwan Inflation vs. Mainland China Inflation.
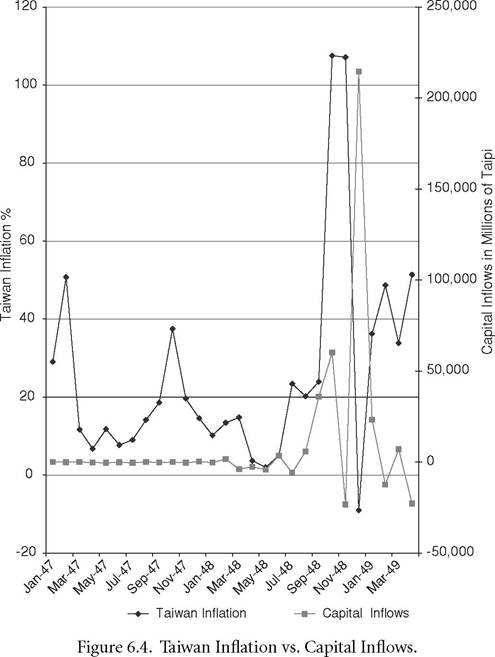
1948 currency reform and the imposition of a fixed rate of exchange for the new gold yuan. The soaring Taiwanese inflation in September-November 1948 occurs even though mainland Chinese price rises are temporarily restrained. Figure 6.4, however, shows the inflationary surge in Taiwan to immediately follow the surge in capital inflows from August-October 1948. Moreover, the temporary drop in Taiwanese inflation in December 1948 is immediately preceded by the temporary reversal of the capital inflow from mainland China in November. Figures 6.3 and 6.4 are therefore very much consistent with generally close ties between mainland Chinese and Taiwanese inflation in the late 1940s supplemented by a seemingly leading role played by capital inflows during the fixed exchange rate period.
The apparent impact of mainland Chinese inflation and capital inflows on Taiwanese inflation seen in Figures 6.3 and 6.4 receives confirmation in the formal time series analysis that we performed.
Although limited by the short length of the estimation period, this empirical work serves to corroborate the inferences drawn from the graphical display.[100] Taiwanese inflation and money growth are regressed on their own past values, past values of mainland Chinese money growth and inflation, and the level of capital inflows. This method allows us to assess the role played by external monetary conditions in the hyperinflation process in Taiwan while also allowing for the potential role played by domestic rates of monetary expansion. We also examine the determination of the capital inflows themselves and regress the inflows on the difference between mainland Chinese and Taiwanese money growth and inflation rates. Increases in these inflation and money growth differentials could be expected to fuel capital outflows from mainland China to Taiwan through increasing the degree of overvaluation of the gold yuan exchange rate.According to the literature on exchange market pressure (see, for example, Girton and Roper, 1977; Burdekin and Burkett, 1990), excess money growth and excess inflation in mainland China vis-a-vis Taiwan should be reflected in some combination of currency depreciation and international reserve losses. If the exchange rate is held constant, loss of international reserves, or capital outflow from mainland China, becomes the only outlet for the exchange market pressure. A number of Latin American countries experienced this phenomenon in the run-up to the debt crisis of the 1980s, where “the general tendency toward overvaluation fueled massive capital flight... In country after country, the public speculated against the central bank by acquiring foreign exchange and moving it abroad” (Edwards, 1995, p. 23).
Inflation, money growth, and capital inflow equations were estimated over monthly data from 1947 through April 1949 (the last month prior to the fall of Shanghai).9 Empirical results from this short available sample period help confirm the international transmission of inflation from China to Taiwan already suggested by the descriptive data, charts, and anecdotal accounts.
We tested for shifts in the relationships at the time of the August 19, 1948 reform in mainland China and, given evidence that such a shift occurred, also reestimated the equations with the sample truncated at July 1948. Although this further cuts into the already highly limited number of observations, the finding of a break in itself offers some corroboration of the importance of the currency reform and the temporary fixed exchange rate that accompanied it.(1978) Q-statistics based on the correlogram of the data series. These Q statistics support stationarity of all five series. Besides capital inflows, the addition of contemporaneous values of the other variables was always rejected on the basis of an F-test.
9 The exact lag order of the variables was determined - from a maximum of four lags - by applying the Akaike information criterion (AIC).
Table 6.2. Regression Results for Taiwanese Inflation and Taiwanese Money Growth
| Right-hand-side Variables | Taiwanese Inflation | Taiwanese Money Growth | ||
| 1947:6-1949:4 | 1947:6-1948:7 | 1947:6-1949:4 | bgcolor=white>1947:6-1948:7||
| Constant | 2.765 | 4.506*** | 3.733 | -11.640 |
| (1.34) | (3.11) | (0.56) | (-1.74) | |
| Taiwanese Money | 0.230 | 0.608# | ||
| Growth (-1) | (0.89) | (1.89) | ||
| Taiwanese Money | 0.456 | -0.054 | ||
| Growth (-2) | (1.41) | (-0.51) | ||
| Chinese | -0.043*** | 0.087*** | ||
| Inflation (-1) | (-11.20) | (9.15) | ||
| Chinese Money | 0.310*** | 0.126** | -0.147** | 0.326 |
| Growth (-1) | (18.09) | (3.13) | (-2.78) | (1.56) |
| Chinese Money | 0.205*** | 0.478 | ||
| Growth (-2) | (2.95) | (1.47) | ||
| Capital Inflow | -0.067*** | 0411*** | 0.420*** | 1.550** |
| (-13.19) | (6.26) | (6.82) | (2.98) | |
| Capital Inflow ( -1) | 0.730*** | 2.410*** | -0.138 | -2.050*** |
| (13.33) | (26.98) | (-0.95) | (-5.14) | |
| Capital Inflow (-2) | -0.213 | 4.830*** | ||
| (-1.27) | (7.97) | |||
| Estimation | Generalized Method | Two-Stage Least | ||
| Method | of Moments | Squares | ||
| Adjusted R | - | - | 0.87 | 0.82 |
| J-Statistic/F-Statistic | 0.175 | 0.262 | 21.81*** | 951*** |
| Chow Test for August | - | - | 4.83** | - |
| 1948 breakpoint | ||||
Notes: The numbers in parentheses after the independent variables denote the lag order (if any); ***, **, *, and # denote significance at the 99%, 95%, 90%, and 89% levels, respectively; t-statistics are in parentheses; and the J-statistic is an alternative goodness-of-fit diagnostic for the generalized methods of moments case (the lower the value, the better).
The results for the Taiwanese inflation and money growth equations are presented in Table 6.2 Lagged Chinese money growth, and contemporaneous and lagged values of the capital inflows from mainland China, are significant in each equation. Lagged Chinese inflation is also significant in the inflation equation. The money growth equation is estimated using a two-stage least squares (2SLS) method[101] - incorporating an autoregressive term - while the inflation equation is estimated using the generalized method of moments (GMM) so as to correct for possible non-normality of the residuals.11 The full sample results are followed by results for a shortened 1947:6-1948:7 subsample that stops just prior to mainland China’s August 1948 monetary reform.
The inflation equation reveals the expected positive effects of higher Chinese money growth and rising capital inflows (the positive coefficient on lagged inflows being ten times larger than the negative coefficient on the contemporaneous value). Lagged Chinese inflation also has the expected positive, and significant, effect in the pre-August 1948 subsample. Just as Taiwan’s inflation seems to have been essentially imported from mainland China, Taiwanese money growth is seen to be endogenously driven by the mainland Chinese variables and capital inflows. Indeed, lagged Chinese money growth and capital inflows are the only significant variables in the money growth equations for Taiwan.12
The Table 6.2 results clearly corroborate the important role played by capital inflows in the Taiwanese inflation process. An important motivation behind these capital flows was undoubtedly flight from the political and military risks on the mainland to the relative safety of Taiwan. Yet these capital inflows were also likely responsive to exchange rate overvaluation associated with any worsening of inflationary pressures in mainland China over and above the levels prevailing in Taiwan.
Accordingly, we next examined whether the volume of inflows can be explained by the differential betweentwo through four of Chinese inflation, Chinese money growth, and capital inflows. In the money growth equation the instruments were lags three through five of Taiwanese money growth, Chinese money growth, and capital inflows.
11 In applying a battery of specification tests to the equations, Q-tests and LM tests for serial correlation, the White test for heteroskedasticity, and Ramsey’s RESET test always indicated that the null hypothesis of no specification error could not be rejected. The Jarque-Bera normality test suggested, however, that the residuals from the initial 2SLS estimates of the inflation equation were significantly non-normal.
12 Application of a Wald test showed the overall positive effect of Chinese money growth in the full-sample results to be significant only at approximately the 87% level. There are also partially offsetting effects for the capital inflows variable but neither of the negative coefficients on the lagged terms is significant at even the 80% level. Reestimating the equation over the full-sample with the statistically insignificant lagged Taiwanese money growth and lagged capital inflow deleted actually improves the overall goodness of fit and, for comparison, the results are:
Taiwanesemoneygrowth = 13.812*** — 0.096**Chinese Money Growth(-1)
+ 0.135**Chinese Money Growth(-2)
+ 0.422*** Capital Inflow
AdjustedR2 = 0.88;F-Statistic = 49.71***; ChowBreakpointTest = 2.4*
Table 6.3. Regression Resultsfor Capital Inflows into Taiwan from Mainland China
Capital Inflows
| Right-hand-side Variables | bgcolor=white>1947:8-1949:41947:7-1948:7 | |
| Constant | -5.010* | 0.275 |
| (-1.78) | (0.23) | |
| Inflation | 0.151*** | -0.027 |
| Differential | (4.49) | (-0.91) |
| Inflation | -0.090** | 0.023 |
| Differential (-1) | (-2.89) | (0.33) |
| Inflation | -0114*** | -0.058 |
| Differential (-2) | (-7.51) | (-1.46) |
| Money Growth | 0.506*** | 0.026 |
| Differential (-3) | (3.94) | (0.25) |
| Estimation Method | Two-Stage Least Squares | |
| Adjusted R2 | 0.92 | 0.22 |
| F-Statistic | 26.94*** | 1.76 |
| Chow Breakpoint Test | 9299*** | |
Notes: “Inflation Differential” is the difference between the inflation rate for mainland China and the Taiwanese inflation rate, and “Money Growth Differential” is the difference between the money growth rate in mainland China and the Taiwanese money growth rate.
(See also the explanatory notes to Table 6.2.)
mainland Chinese and Taiwanese money growth and inflation rates. We would expect any such relationship to be strongest after the August 1948 reform when the rate of exchange between the taipi and the new gold yuan was fixed notwithstanding a tremendous surge of inflationary pressure on the mainland. In Table 6.3, we examine the effects on capital inflows of money growth and inflation differentials between mainland China and Taiwan over the full sample and over the pre-August 1948 subsample. Although the indicated effect of the inflation differential on capital inflows is actually ambiguous given the mixed significant negative and positive coefficients, the lagged money growth differential is significant at the 99% level with the expected positive sign.[102]
The overall dependence of the Taiwanese variables on mainland Chinese “forcing variables” receives further confirmation if we apply Grangercausality tests to our set of five variables (details provided in Burdekin and Whited, 2005). As discussed in Chapter 5, these tests examine the extent to which movements in one variable can be explained by past movements in another - in this case yielding results in line with the inferences drawn from Table 6.2 earlier. First, capital inflows exert causal effects on both Taiwanese inflation and Taiwanese money growth. Second, Chinese money growth and Chinese inflation also Granger-cause Taiwanese inflation, as suggested in Table 6.214 Third, Taiwanese money growth does not Granger-cause Taiwanese inflation. The only differences from the implications derived from Table 6.2 are that there is no confirmed causal effect of Chinese money growth on Taiwanese money growth in the Granger tests and that there is a suggested causal effect of Taiwanese inflation on Taiwanese money growth that was not indicated in the prior regression results.15
In general, we find considerable support for Taiwan’s inflation at the end of the 1940s being driven by imported inflationary pressure from mainland China. The overvaluation of the gold yuan relative to the Taiwanese taipi after the August 1948 reform helped encourage the flow of excess money from mainland China to Taiwan. The importance of this reform is indicated both by the graphical display and by the identification of an August 1948 structural break in our empirical testing. We also find evidence that the inflows into Taiwan were themselves responsive to the money growth
the August 1948 reform, in contrast to the very sharp movements later on (Figure 6.2), likely lies behind this result.
14 Further estimation of impulse response functions confirms that the suggested causal effects of the Chinese variables on Taiwanese inflation and the effects of capital inflows are economically significant in terms of their magnitudes. One standard deviation shocks to Chinese money growth and Chinese inflation produce an up to 10% shift in Taiwanese inflation across the different lag orders. Similar-size shifts in Taiwanese money growth and Taiwanese inflation follow a one standard deviation shock to the level of capital inflows. (The impulse responses were calculated using the Monte Carlo method with 100 repetitions and are robust to changes in the ordering of the variables.)
15 The implication that Taiwanese inflation Granger-causes Taiwanese money growth but that Taiwanese money growth does not Granger-cause Taiwanese inflation matches the conclusions drawn by Makinen and Woodward (1989) and Quddus, Liu, and Butler (1989) based on their bivariate causality testing with these two variables. This is also consistent with the potential feedback from inflation to future rates of money growth in high inflation OpisodesemphasizedbySargentandWallace (1973). Surprisingly, LinandWu (1989) reach opposite conclusions even though they, like us, control for the role played by the mainland Chinese variables in their causality testing. Lin and Wu’s other finding, however, that Chinese inflation Granger-causes Taiwanese inflation remains in line with our results. differential between mainland China and Taiwan - that is, the more money growth in mainland China exceeded that in Taiwan, the greater the extent to which this excess money seems to have flowed into Taiwan through capital inflows.