Principles of Evidence-Based Medicine ^202
The purpose of this overview is to review and describe the research methodologies used in the medical literature. These methodologies serve as the scientific basis of evidence-based medicine.
Given the limitations of space, this review is far from comprehensive. For a more complete overview, the reader is encouraged to obtain a series of articles published in The Lancet (1-11). This epidemiology series provides a readable but more detailed overview, a discussion of various research designs, and articles that specifically focus on randomized trials (7-11).Epidemiologic Studies
Clinical research can be broadly subdivided into two categories—1) experimental and 2) observational—based on whether or not the investigator assigns the exposures (Fig. K-1). Experimental studies can be divided into randomized and nonrandomized trials. Observational studies can be divided into analytic studies (studies with a comparison group) and descriptive studies. Analytic observational studies include cohort studies, case-control studies, and cross-sectional studies. In cohort studies, groups are compared based on an exposure of interest and participants are tracked forward in time for the outcome of interest. In case-control studies, groups are chosen based on the outcome of interest and are traced back to the exposure. Cross-sectional studies are analogous to a snapshot in time; the researcher observes the exposure and the outcome at one time point. Descriptive studies, by definition, have no comparison group. They include case reports and case-series reports. In descriptive studies, investigators cannot evaluate associations or make causal implications. These reports often are interesting clinical vignettes but have limited scientific merit.
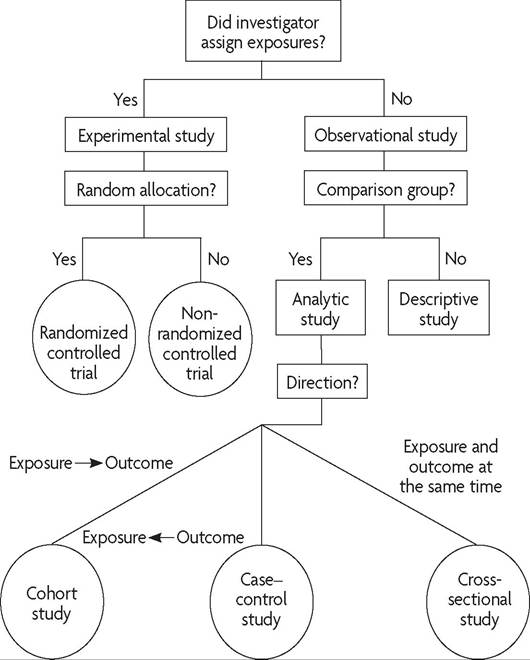
Fig.
K-1. Algorithm for classification of types of clinical research. (Reprinted with permission from Grimes DA, Schulz KF. An overview of clinical research: the lay of the land. Lancet Copyright 2002;359:57-61.) ^Not all research methods are created equal (Fig. K-2). The randomized clinical trial is the least likely to be subject to serious biases. Cohort, casecontrol, and cross-sectional studies are common observational analytic studies. In fact, observational studies dominate the women’s health literature (12). Observational studies are more susceptible than are experimental designs to many types of bias that can distort the researcher’s results and conclusions.
id="Picutre 21" class="lazyload" data-src="/files/uch_group75/uch_pgroup318/uch_uch7368/image/image021.jpg">
Fig. K-2. A hierarchy of clinical studies.
The choice of research methodology is very important. The reader must first consider the question of whether the study design is appropriate for the specific research question. Descriptive studies are appropriate to describe a highly unusual case or collection of cases. These studies may provide valuable information about the frequency, natural history, or possible determinants of a condition and thus may generate hypotheses. However, descriptive studies cannot test hypotheses on causality or association. Analytic observational studies are particularly appropriate in assessing an association or relationship between an exposure and an outcome when a randomized trial is not feasible or ethical. Cohort studies proceed in a logical sequence in which the exposure precedes the outcome of interest. Cohort studies, however, may require very large sample sizes, especially for outcomes of interest that are rare. A case-control study is a more efficient design with which to address an association between a rare outcome and an exposure of interest, and this type of design may be more feasible when many years are required to develop the outcome of interest. Case-control studies may be counterintuitive to clinicians, because the population under study is selected on the basis of the outcome (ie, these studies “begin at the end”) (13).
The randomized trial is the methodology of choice when a researcher or clinician is interested in the effectiveness of a particular therapy or wishes to provide the highest level of evidence for an association. When properly done, the randomized trial approximates the controlled experiment of basic science. The hallmark of this study design is the assignment of participants to exposures based purely on chance. A randomized trial reduces the likelihood of bias when it is properly implemented (with sufficient sample size). Thus, differences in outcomes can be attributed to the exposure or to the arm of a trial rather than to differences in baseline characteristics of the participants.
Randomized Clinical Trials
The randomized clinical trial is the standard by which all other methodologies are evaluated. The major advantages of a randomized clinical trial compared with an observational study are its ability to avoid selection bias and its strength of causal inference. The randomized clinical trial is the best design for controlling the influence of known and unknown confounding variables.
In a randomized clinical trial, participants are randomly assigned to an exposure of interest. Performing a randomized clinical trial involves five basic steps:
1. Assemble the study population.
2. Evaluate baseline characteristics.
3. Randomly assign participants to two or more study groups.
4. Apply an intervention or placebo, preferably in a blinded fashion.
5. Monitor the groups and measure outcome variables (blindly, if possible).
Embedded in these five steps are other methodologic issues that should be considered in a properly performed randomized clinical trial. Inclusion and exclusion criteria that are appropriate to the research question must be determined carefully. Participants with a contraindication to the intervention must be excluded. When measuring baseline characteristics, the researcher should consider important predictors of the outcome and confounding variables.
In addition, an adequate sample size should be determined, and plans for recruitment should be consistent with these calculations.As an illustration of the five steps listed previously, consider the following example. In a report published in the American Journal of Preventive Medicine, the U.S. Preventive Services Task Force gave screening young women for Chlamydia trachomatis infection an “A” recommendation (see Table K-1) (14). One of the most important studies supporting this recommendation was a large randomized trial of screening in a health maintenance organization in Seattle (15). This trial evaluated the effectiveness of screening and treating unmarried, asymptomatic women (aged 18-34 years) for C trachomatis. The study population selected for this trial was believed to be at high risk based on a risk score that incorporated age, race, parity, douching, and having two or more sexual partners in the previous 12 months. Participants were then randomly assigned to two groups: 1) those receiving routine screening and 2) those receiving no routine screening. Baseline characteristics were evaluated to ensure that the two groups were similar at randomization. The intervention was applied, and the outcomes were carefully measured. With routine screening for C trachomatis, the incidence of pelvic inflammatory disease (PID) was reduced from 28 cases per 1,000 women-years to 13 cases per 1,000 women-years (relative risk [RR], 0.44; 95% confidence interval [CI], 0.2-0.9).
In randomized trials, it is extremely important to assign patients in a truly random fashion (eg, with a random-number table or computer-generated random assignment), rather than by hospital number or day of the week. It also is important to conceal the assignment (eg, with opaque envelopes) to avoid foreknowledge of the treatment assignment. In this way, investigators are unable to manipulate the randomization to get patients into their preferred treatment groups. It has been demonstrated that trials in which inadequate or unclear allocation concealment was used yielded up to 40% larger estimates of the effect than did trials in which adequate concealment was used (16).
When properly implemented, random allocation and concealment can help avoid bias or imbalances in important baseline factors that can influence the outcome of interest. Blinding the investigator and the participant to the group assignment (the double-blind approach) is a methodological strength. By using this method, the participant follow-up and evaluation of the outcome will be performed in a strictly objective manner, uninfluenced by group assignment. When analyzing a randomized clinical trial,
Table K-1. Standard Recommendation Language of the U.S. Preventive Services Task Force ^
| Recommendation | Language[******] |
| A | The USPSTF strongly recommends that clinicians routinely provide [the service] to eligible patients. (The USPSTF found good evidence that [the service] improves important health outcomes and concludes that the benefits substantially outweigh harms.) |
| B | The USPSTF recommends that clinicians routinely provide [the service] to eligible patients. (The USPSTF found at least fair evidence that [the service] improves important health outcomes and concludes that benefits outweigh harms.) |
| C | The USPSTF makes no recommendation for or against routine provision of [the service]. (The USPSTF found at least fair evidence that [the service] can improve health outcomes but concludes that the balance of the benefits and harms is too close to justify a general recommendation. |
| D I | The USPSTF recommends against routinely providing [the service]. (The USPSTF found at least fair evidence that [the service] is ineffective or that harms outweigh benefits.) The USPSTF concludes the evidence is insufficient to recommend for or against routinely providing [the service]. (Evidence that [the service] is effective is lacking, of poor quality, or conflicting and the balance of benefits and harms cannot be determined.) |
Abbreviation: USPSTF, U.S.
Preventive Services Task Force.one should remember the principle of “once randomized, analyze.” In other words, once a patient is randomized to an intervention arm, he or she should be analyzed in that group regardless of what happens after randomization. If a patient who was randomized to a group receiving a new antibiotic experiences adverse effects and stops therapy, that patient should be analyzed in the antibiotic group, not dropped from the analysis. This is referred to as intention-to-treat analysis. A randomized clinical trial in which many of the patients have been dropped from the analysis should be scrutinized carefully. Reports of clinical trials should attempt to minimize exclusions after randomization and to perform intention-to-treat analysis.
Randomized clinical trials have many advantages. In the hierarchy of clinical research, the randomized clinical trial provides the greatest strength of causal inference and is the optimal methodology to test the efficacy of treatment programs. If performed properly, randomization protects against confounding and selection bias—error due to systematic difference in characteristics of the study participants and individuals excluded from the study. Double-blinding will help ward off problems of ascertainment bias, diagnostic suspicion bias, and detection bias. Randomized trials with adequate sample size also are the methodology of choice for the evaluation of small or moderate effects. In observational studies, bias might easily explain and account for small to moderate differences (17).
The disadvantages of a randomized trial include expense, feasibility, and ethical issues surrounding the randomization of patients to intervention or placebo. For example, patients with syphilis cannot be randomized ethically to a treatment or a no-treatment group. Another disadvantage is the possible lack of external validity; a randomized trial, when properly done, should have internal validity (ie, it should measure what it sets out to measure), but it might lack external validity. External validity is the ability to generalize the results of a trial to the overall population or to a population of interest. Doing so may not be possible because of the strict inclusion and exclusion criteria of the trial and the fact that patients who consent to participate in a randomized clinical trial may differ from nonparticipants. Finally, randomized trials often are prohibitively expensive to conduct. The cost of large trials can be tens of millions of dollars.
Observational Studies
Observational studies can be divided into analytic studies and descriptive studies. Analytic observational studies include a comparison group and include cohort (longitudinal or follow-up) studies, case-control studies, and cross-sectional studies. Descriptive observational studies include caseseries reports and case reports. Descriptive studies have no comparison group. Most epidemiologic studies in the reproductive health literature are observational studies (18). Of original research articles published in the journal Obstetrics & Gynecology in 2012, 85% were classified as observational.
Cohort Studies
A cohort study differs from a randomized clinical trial in that it does not have a randomization scheme that determines which patients receive the intervention or exposure. A cohort study is carried out by assembling a group of individuals who have been exposed to an intervention and comparing this group with a control group of patients who have not been exposed. These two groups are monitored over time and evaluated for a specific outcome of interest. An excellent example in the reproductive health literature is the Nurses’ Health Study, one of the most comprehensive cohort studies ever performed (19, 20). Thousands of nurses have been monitored over time with comprehensive interviews and medical record reviews to evaluate various risk factors (eg, oral contraceptive use and estrogen therapy) and the development of disease (eg, cancer and cardiovascular disease).
Cohort studies are more subject to systematic (nonrandom) error than are randomized clinical trials and, thus, are weaker than randomized clinical trials in establishing causation. Because a clinician’s decision to recommend a specific therapy and a patient’s choice to accept therapy are clearly nonrandom decisions, the strength that the two groups are equal at baseline (provided by random allocation in a randomized trial) is lost. For example, women who take oral contraceptives may have very different baseline characteristics than women who use other forms of contraception or no contraception, and these characteristics may be related to the outcome of interest. In cohort studies, women who receive an intervention may be cared for or evaluated differently from women who do not receive the intervention. For example, a woman taking oral contraceptives is more likely to be seen by a physician regularly than a woman who has had a tubal sterilization. As a result, there is an increased chance of detecting an abnormality in the woman taking oral contraceptives. This type of bias is called detection bias.
In all epidemiologic studies, it is extremely important for investigators to identify and control for confounding variables (ie, factors associated with the intervention or exposure and the outcome of interest) (Box K-1, Fig. K-3). Cohort studies can attempt to control for confounding variables and differences in baseline characteristics through stratification and multivariable analysis. However, it is impossible to control for unknown or unmeasured confounding variables. Because of the major sources of bias just described, associations should be interpreted with caution because small or modest effect sizes may be due to residual confounding or bias.
By definition, randomized trials are prospective in design; they start with groups exposed to an intervention and monitor them over time for the outcome of interest. Cohort studies also proceed forward in time, from exposure to outcome, but they may be carried out either prospectively or retrospectively. If patients are enrolled in a cohort study, grouped on the basis of their exposure, and then monitored longitudinally, the study is clearly prospective. However, it also is possible to look back in time (retrospectively) to assemble a group of patients who were and were not exposed
Box K-1. What Is a Confounding Variable?
Confounding comes from the Latin word confundere, to mix together; thus, some authorities refer to confounding as a “mixing of effects.” A confounding variable is a variable that can cause or prevent the outcome of interest, is not the causal pathway as an intermediate variable, and also is associated with the factor under investigation. Consider the relationship between oral contraceptives and cervical neoplasia. A woman's sexual history (eg, onset of intercourse or new partners) may be a confounding variable in this relationship. Sexual history is related to the outcome (cervical neoplasia) and also may be related to the exposure (oral contraceptives).
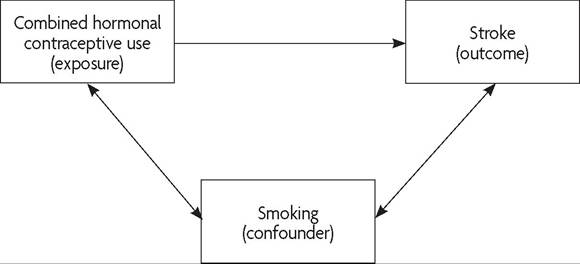
Fig. K-3. Example of confounding. Cigarette smoking may be associated with combined hormonal contraceptive use (exposure) and outcome of interest (stroke). An analysis should control for the effect of smoking on the outcome of interest. ^
at some time in the past and to monitor them to the present time. This type of cohort study is called a retrospective cohort study. In prospective and retrospective cohort studies, the study moves in the same direction: forward in time. However, data gathering may be prospective (forward in time) or retrospective (backward in time). Prospective cohort studies often require large sample sizes (for uncommon and rare outcomes) and long periods of follow-up. Thus, these studies can be very expensive and time-consuming. The case-control study can overcome some of these logistical obstacles.
Case-Control Studies
It has been said that a case-control study “begins at the end” (Fig. K-4) (13). Cohort studies and randomized clinical trials begin with patients exposed to an intervention or risk factor and monitor these patients for the development of the outcome. Case-control studies select patients on the basis of whether they have the outcome of interest. The outcome could be a disease, if the investigation is evaluating risk factors for the disease, or it may be an ultimate outcome, such as alive or dead in a study of cancer prognosis. Cases, or patients with the outcome, are compared with controls, or individuals without the outcome, to determine whether there is an association between an exposure and the outcome of interest. Therefore, the design in a case-control study is, by definition, retrospective. As a result of the process of selecting individuals based on the outcome or disease,
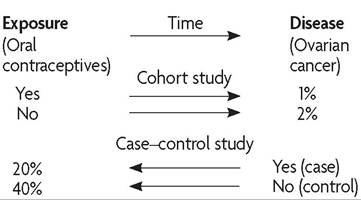
Fig. K-4. Examples of cohort and case-control studies of the relation between oral contraceptives and ovarian cancer. ^
case-control studies typically study only one outcome, but they may evaluate several exposures.
The major advantage of case-control studies is that they are highly efficient. Often they require the fewest patients to demonstrate an association and can be done in less time and with less money than other studies, especially when the disease in question is rare or takes years to develop (eg, cancer or cardiovascular disease). Consider the following example of a case-control study. Women with hereditary ovarian cancer and a pathogenic mutation in either BRCA1 or BRCA2 were compared with a group of controls without ovarian cancer. The investigators assessed the patients’ past exposure to oral contraceptives and noted that oral contraceptive use was associated with a 50% reduction in the risk of ovarian cancer (21). If this study was done as a cohort study or randomized trial, it would take decades to evaluate the development of ovarian cancer in a cohort of women taking oral contraceptives.
Despite their advantages, case-control studies are easy to do poorly and are prone to many biases. One of the major challenges in case-control studies is choosing an appropriate control group, which is critical in these studies. For example, the Women’s Health Study was a multicenter casecontrol study to evaluate the relationship between PID and the intrauterine device (22). Barrier contraception protects against sexually transmitted diseases and PID. Thus, the choice of control group (condom users) resulted in an inflated estimate of the relationship between the intrauterine device and PID. In general, the control group should be representative of individuals who are at risk of the disease, and individuals in the control group should have the same opportunity for exposure as case patients. Controls should be similar to the cases in all important respects, except for not having the outcome of interest. Because the health outcome is known at the start in these studies, this knowledge may influence the measurement and interpretation of data (observer bias). In addition, participants enrolled in these studies may have difficulty recalling medical history or exposures. If case participants are more (or less) likely to remember an exposure than control participants (ie, there is differential recall), then the study may be subject to recall bias. As observational studies, case-control and cohort studies are susceptible to many other types of bias. A careful reader of the literature will search for bias and uncontrolled confounding when interpreting the results of observational studies.
Studies also may be “nested,” or set within an existing cohort study, such as nested case-control or nested cohort studies. In these nested studies, information previously obtained during the cohort study (eg, blood samples) is evaluated for a subset of participants with and without the outcome of interest. Cases are participants with the outcome or disease of interest. Control participants are selected at random from the population without the outcome of interest (nested case-control). For example, in a nested case-control study of risk factors for uterine rupture, black women were found to have a lower risk of rupture compared with white women (23). In a nested cohort study, exposure groups are selected from within a large, established cohort.
Cross-Sectional Studies
Another type of observational analytic study is the cross-sectional study (also called a prevalence study or frequency survey). The cross-sectional study can be thought of as a snapshot of a group of individuals, some of whom have the disease (outcome) and exposure and some of whom do not. Individuals who have the disease of interest are considered prevalent cases. The difference between prevalence and incidence is important, because these terms often are misused in medical writing. Incidence refers to new cases that have developed over a specified time. Prevalence is the proportion of individuals in a population who have the disease at a specific time.
Using a cross-sectional study design, an investigator can evaluate associations between disease and exposure but cannot establish a temporal relationship between them. As an example, consider a hypothetical crosssectional study of the relationship between serum prolactin levels and the use of oral contraceptives. A large group of young women are assembled, some of whom are taking oral contraceptives (exposure group) and some of whom are not. Prolactin levels are determined for all the women. The researchers may find an association between oral contraceptive use and elevated prolactin levels. However, they cannot conclude that oral contraceptive use causes elevations in prolactin levels. It is possible that women with elevated prolactin levels are more likely to have irregular bleeding and, thus, are more likely to be prescribed oral contraceptives. Because cross-sectional studies use prevalent cases rather than incident cases, a temporal relationship cannot be established, and the information provided can be misleading.
A cross-sectional study design often is used to evaluate diagnostic tests (24). To illustrate the concepts of diagnostic test performance, consider a cross-sectional study to evaluate the performance of a laboratory test for the diagnosis of PID (25). A group of women with signs and symptoms consistent with upper genital tract infection come to an emergency room to have blood drawn for the test and have a laparoscopy for the definitive diagnosis of PID. The result of the evaluation is summarized in a 2?2 table (Fig. K-5).
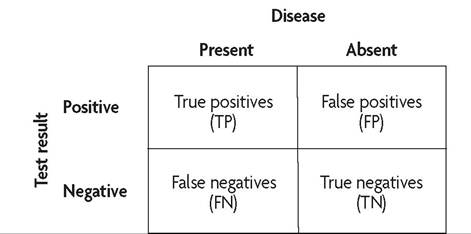
Fig. K-5. Example of a 2 ? 2 table illustrating diagnostic test characteristics of sensitivity and specificity. Sensitivity is defined as TP∕(TP + FN); specificity, TN/(TN + FP); positive predictive value, TP/(TP + FP); and negative predictive value, TN/(TN + FN).
Diagnostic test performance is characterized by a test’s sensitivity and specificity. Sensitivity is the ability of a test to correctly identify patients with the disease of interest; of all the diseased patients, sensitivity is the proportion of patients who test positive (true positives/diseased = true positives/[true positives + false negatives]). Specificity is the ability of a test to correctly identify patients without the disease of interest (true negatives/ nondiseased = true negatives/[true negatives + false positives]). For sensitivity and specificity, one must think “vertically” based on the 2 ? 2 table shown in Figure K-5. These test characteristics deal with the extent to which diseases are diagnosed correctly.
Receiver operating characteristic curves are another way to visualize sensitivity and specificity cutoffs for diagnostic tests. In these curves, test sensitivity is plotted on the Y axis, and (1 - specificity) on the X axis. A test that follows the diagonal line (the line between [0.0] and [1.1]) represents the flip of a coin. An ideal test will have high sensitivity and high specificity. Researchers can measure the area under the receiver-operating characteristic curve to compare two or more tests. As an example, erythrocyte sedimentation rate was compared with C-reactive protein level for the diagnosis of PID (Fig. K-6). Neither test performed very well, but C-reactive protein test had a greater area under the curve (25).
Generally, clinicians are more interested in the likelihood of the disease given a positive or negative test result (the predictive values of the test). Predictive values are calculated by determining the percentage of positive (or negative) tests that correctly predict the presence (or absence) of the disease of interest. For predictive values, one must think horizontally. Positive predictive value is the percentage of women with a positive test who actually have the disease (true positives/ positive tests = true positives/ [true positives + false positives]). The negative predictive value is the percentage of women with a negative test result who do not have the disease (true negatives/negative test results = true negatives/[true negatives + false negatives]). Predictive values depend on the prevalence of the disease in a population. For example, if a disease is extremely rare, it will be difficult to have a high-positive predictive value, even if sensitivity and specificity are high. Predictive values can be calculated from the standard 2 ? 2 table based on the formulas listed earlier. Predictive values also may be determined by way of Bayes’ theorem.
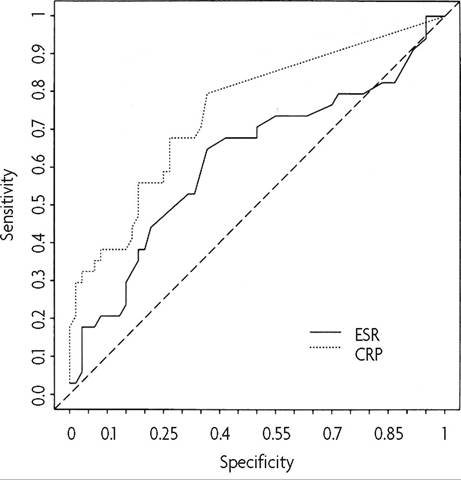
Fig. K-6. Receiver operating characteristic curves for C-reactive protein and erythrocyte sedimentation rate. Abbreviations: CRP, C-reactive protein; ESR, erythrocyte sedimentation rate. (Reprinted from Peipert JF, Boardman L, Hogan JW, Sung J, Mayer KH. Laboratory evaluation of acute upper genital tract infection. Obstet Gynecol 1996;00:030-6.) ^
Likelihood ratios are an additional way to evaluate information from a diagnostic test. These calculations use sensitivity and specificity to estimate the likelihood of an outcome given a positive or negative test result. The likelihood ratio of a positive test is calculated as sensitivity∕(1 - specificity), whereas the likelihood ratio for a negative test is the inverse. Large likelihood ratios (eg, higher than 10) suggest that the diagnostic test may be useful to “rule in” a disease, whereas small ratios (eg, lower than 0.1) may “rule out” a disease. Likelihood ratios also may be used to calculate the posttest probability of a disease (posttest probability = pretest probability x likelihood ratio).
Descriptive Studies
Case reports and case-series reports are types of descriptive studies. These studies represent the least sophisticated of study designs. The purpose of descriptive studies is to assess and describe a finding in a case or group of cases. Descriptive studies are severely limited by the lack of a comparison group and by the potential bias of the investigators.
Establishing cause and effect is not possible in a descriptive study. Because they are hypothesis generating, descriptive studies may serve as the basis for future analytic studies. For example, in a case-series report of seven women who developed functional ovarian cysts while taking phasic contraceptive pills, the authors stated that “phasic contraceptive pills may be a threat to patient health and safety” (26). This report led to further investigation and refutation of these conclusions (27).
Systematic Reviews of Medical Evidence
Meta-analysis
In clinical research, meta-analysis is a commonly used tool used in the systematic review and aggregation of data from randomized controlled trials or observational studies. Obstetrics and gynecology has led other medical specialties in attempting to perform a systematic review of all randomized trials conducted in its discipline (28). One example is the Cochrane Library, which includes the Cochrane Database of Systematic Reviews. This electronic database began in England to review perinatal data, and it has expanded to include reviews of many areas of medicine (29). Combining data with meta-analysis can increase statistical power and the ability to evaluate treatment effects and complications in clinical trials, as well as associations between risk factors and disease in etiologic research. In addition, by combining results from several studies, generalizability may be increased. Meta-analysis is especially useful when sample sizes of individual clinical trials are too small to detect an effect or when a large trial is too costly and time-consuming to perform. For example, when investigators performed a meta-analysis to evaluate the efficacy of oral β-agonist maintenance therapy in delaying delivery and decreasing the incidence of preterm birth and its complications, they found no benefit of oral β-agonist maintenance therapy (30). A decision analysis performed to assess the use of magnesium sulfate for seizure prophylaxis in women with mild preeclampsia demonstrated that either strategy (using or not using magnesium) is acceptable because the neonatal and maternal outcomes were nearly identical (31).
A meta-analysis should adhere to specific methodological principles (28). Because the technique is a synthesis of existing studies (most commonly, randomized trials), an explicit study protocol should be developed to outline study inclusion and exclusion criteria. The researchers should provide some assessment of the combinability of the studies, including tests of homogeneity when appropriate. An evaluation and measurement of potential biases should be performed. The statistical methods used, including sensitivity analysis, should be described. Lastly, the authors should provide a discussion regarding the applicability of the results.
Decision Analysis
Decision analysis is a quantitative approach to evaluate the relative values of different management options (32). The process begins by systematically breaking down a clinical problem into its components and creating a decision tree, or algorithm, to represent the components (parameters) and decision options. Consider the problem of preventing early-onset group B streptococcal disease. A decision analysis was performed to address three different approaches to prevent early-onset neonatal group B streptococcal disease (32).
Probability values for each of the parameters in the decision tree are estimated from a review of the medical literature and expert opinion. The decision tree is then analyzed with statistical methods, and a net value for the different decision options in relation to one another is determined. A technique called sensitivity analysis is used to test how variations in these probabilities can affect the conclusions of the decision analysis. Factors that can be measured, such as mortality, are easier to analyze than are outcomes, such as quality of life.
Economic Analysis
The use of economic analysis has increased in the medical literature (33). For example, the issue of screening for cystic fibrosis by identifying prenatal carriers has been addressed with this technique (34). Economic analysis, including cost-benefit and cost-effectiveness analyses, is another type of systematic review. Economic analysis is similar to decision analysis but focuses on monetary cost. Once a decision analysis is performed on a specific clinical problem, data on costs of various management options are compared. A cost-effectiveness analysis compares the costs of different options to determine the best care for the least cost. Cost-benefit analysis includes some consequences of the decision options that are nonmonetary, such as years of life saved or disability avoided. For example, using a decision analytic model, investigators demonstrated that a policy of elective cesarean delivery for ultrasonographically diagnosed fetal macrosomia of nondiabetic women is economically unsound (35).
Economic analyses, however, are not without limitations. Often it is difficult to put a monetary cost or a utility on a clinical outcome, and these estimates often are highly subjective. In addition, many cost-effectiveness studies reported in the obstetric and gynecologic literature have been found to have important methodological shortcomings (36). Therefore, the reader must be highly cautious in interpreting some of these findings and should have some basic knowledge about the methodological standards of these reports.
Statistics in Reproductive Health Research
Hypothesis Testing and Types of Error
The concept of hypothesis testing forms the basis for most statistical testing. The hypothesis of a study often is phrased in the form of a null hypothesis (H0) that there is no difference present. Research studies should have a clear statement of their hypothesis before the research begins. A hypothetical example of a null hypothesis is as follows: There is no association between the use of low-dose oral contraceptives and the development of endometrial cancer. If one rejects the null hypothesis (H0), then an alternative hypothesis (HA) that some association exists is accepted. An alternative hypothesis could be the following: The use of low-dose oral contraceptives reduces the risk of developing endometrial cancer.
An association, however, may be clinically important or trivial. It is important to distinguish between statistical significance (which can be achieved with large sample sizes, regardless of the effect size) and clinical significance. Consider a study of 2,000 women who are randomized to receive antibiotic A or B to be treated for cervical C trachomatis infection. If the cure rate in the 1,000 women taking doxycycline is 95%, and the cure rate for the other drug is 97%, then there is a statistically significant difference (P=.02). However, this difference of 2% may not be considered clinically significant.
Research studies, like diagnostic tests, are not infallible. Two specific errors are of concern to epidemiologists and researchers: the type I error (α) and the type II error (β). A type I error occurs when a statistically significant difference is found in a study when there truly is no difference. The level of type I error is based on the choice of level of statistical significance. A significance value of P <.05 implies that the risk of type I error, or the possibility that a positive study finding was because of chance alone, is 5%. A type II error is the chance that a study finds no difference when a difference truly does exist. A study’s power is its ability to detect an association when one truly exists (Power = 1-type II error, or 1-β ). Therefore, a 20% chance of a false-negative study translates to 80% power. The chance of a type II error is related inversely to sample size and to the statistical power of the study. Increasing a study's sample size can reduce the chance of a type II error (37).
Investigators should calculate the required sample size before beginning a study to avoid the problem of a type II error. Many clinical trials have described a therapy as ineffective when, in reality, the therapy may have a clinically meaningful effect but the trial was not of sufficient size to detect it (38).
Probability Values Compared With Point Estimates and Confidence Interval Estimation
Although the use of P values and hypothesis testing is firmly entrenched in the medical literature, confidence interval estimation and the use of point estimates are more informative for researchers and readers (39). Many authorities favor the use of point estimates (eg, RR) and their 95% CIs to the calculation of P values (40). A relative risk is the risk of the outcome in the exposed population relative to that in the unexposed, or control, population. A relative risk greater than 1 implies an increased risk, and a relative risk less than 1 implies a protective effect. For example, the relative risk of endometrial cancer in women who are more than 22.7 kg overweight is 10, or a 10-fold increased risk. The risk of ovarian cancer in women with pathogenic mutations in the BRCA1 or BRCA2 gene is reduced by 60% in women who have used combination oral contraceptives for 6 years or more relative to women who did not use oral contraceptives. When the 95% CI excludes 1, then the results are statistically significant at the POncol 2005;97:497-500.
**Taylor S, Kuhn L, Dupree W, Denny L, De Souza M, Wright TC Jr. Direct Comparison of liquid-based and conventional cytology in a South African screening trial. Int J Cancer 2006;957-62.
ttRoncoG1 CuzickJ1 Pierotti P, Cariaggi MP1 DaIIaPaImaP, Naldoni C, et al. Accuracyofliquid based Versusconventionalcytology: Overallresultsofthe Uewtechnologiesforcervical cancer screening: randomized controlled trial. BMJ 2007;335:28.
Fig. K-7.(A) Relative sensitivity at cutoff high-grade squamous intraepithelial lesion or worse. (B) Relative specificity at cutoff high-grade squamous intraepithelial lesion or worse. (Reprinted from Arbyn M, Bergeron C, Klinkhamer P, Martin-Hirsch P, Siebers AG, Bulten J. Liquid compared with conventional cervical cytology: a systematic review and meta-analysis. Obstet Gynecol 2008;111:167-77.) in obstetrics and gynecology. Obstet Gynecol 1997;89:628-33. [PubMed] [Obstetrics & Gynecology] ^
29. Starr M, Chalmers I, Clarke M, Oxman AD. The origins, evolution, and future of The Cochrane Database of Systematic Reviews. Int J Technol Assess Health Care 2009;25(suppl 1):182-95. [PubMed] [Full Text] ^
30. Macones GA, Berlin M, Berlin JA. Efficacy of oral beta-agonist maintenance therapy in preterm labor: a meta-analysis. Obstet Gynecol 1995;85:313-7. [PubMed] [Obstetrics & Gynecology] ^
31. Cahill AG, Macones GA, Odibo AO, Stamilio DM. Magnesium for seizure prophylaxis in patients with mild preeclampsia. Obstet Gynecol 2007;110: 601-7. [PubMed] [Obstetrics & Gynecology] ^
32. Rouse DJ, Owen J. Decision analysis. Clin Obstet Gynecol 1998;41:282-95. [PubMed] ^
33. Macones GA, Goldie SJ, Peipert JF. Cost-effectiveness analysis: an introductory guide for clinicians. Obstet Gynecol Surv 1999;54:663-72. [PubMed] ^
34. Doyle NM, Gardner MO. Prenatal cystic fibrosis screening in Mexican Americans: an economic analysis. Am J Obstet Gynecol 2003;189:769-74. [PubMed] [Full Text] ^
35. Rouse DJ, Owen J, Goldenberg RL, Cliver SP. The effectiveness and costs of elective cesarean delivery for fetal macrosomia diagnosed by ultrasound. JAMA 1996;276:1480-6. [PubMed] ^
36. Smith WJ, Blackmore CC. Economic analyses in obstetrics and gynecology: a methodologic evaluation of the literature. Obstet Gynecol 1998;91:472-8. [PubMed] [Obstetrics & Gynecology] ^
37. Peipert JF, Metheny WP, Schulz K. Sample size and statistical power in reproductive research. Obstet Gynecol 1995;86:302-5. [PubMed] [Obstetrics & Gynecology] ^
38. Freiman JA, Chalmers TC, Smith H Jr, Kuebler RR. The importance of beta, the type II error and sample size in the design and interpretation of the randomized control trial. Survey of 71 “negative” trials. N Engl J Med 1978;299: 690-4. [PubMed] ^
39. Grimes DA. The case for confidence intervals. Obstet Gynecol 1992;80:865-6. [PubMed] [Obstetrics & Gynecology] ^
40. Rothman KJ. A show of confidence. N Engl J Med 1978;299:1362-3. [PubMed]
41. Arbyn M, Bergeron C, Klinkhamer P, Martin-Hirsch P, Siebers AG, Bulten J. Liquid compared with conventional cervical cytology: a systematic review and meta-analysis. Obstet Gynecol 2008;111:167-77. [PubMed] [Obstetrics & Gynecology] ^
42. Peterson HB, Kleinbaum DG. Interpreting the literature in obstetrics and gynecology: II. Logistic regression and related issues. Obstet Gynecol 1991;78: 717-20. [PubMed] [Obstetrics & Gynecology] ^
43. Scott JR. Adapting to the times [editorial]. Obstet Gynecol 2007;109:2-3. [PubMed] [Obstetrics & Gynecology] ^
44. Scott JR. Green journal refinements [editorial]. Obstet Gynecol 2007;109: 1264-5. [Obstetrics & Gynecology] ^
Resources
American College of Obstetricians and Gynecologists. Reading the medical literature. Washington, DC: ACOG; 1998. Available at: http://www.acog.org/Resources_ And_Publications/Department_Publications/Reading_the_Medical_Literature. Retrieved June 28, 2013.
Centre for Health Evidence. Available at: http://www.cche.net. Retrieved August 29, 2013.
Cochrane Collaboration. Available at: http://www.cochrane.org. Retrieved August 29, 2013.
More on the topic Principles of Evidence-Based Medicine ^202:
- American College of Obstetricians and Gynecologists (ed.) Guidelines For Women's Health Care: A Resource Manual. 4th edition. — American College of Obstetricians and Gynecologists,2014. — 907 p., 2014
- Index
- XII USUL AL-FIQH: BEYOND TRADITION1
- CONCLUSION
- Precolonial Antecedents