Critical Events During the Swing Limb Advancement Task
Swing limb advancement is the last task that must be accomplished to complete the gait cycle, and, as shown in Table 16.3, this task contains four phases and six critical events.
There are two critical events in pre-swing: passive knee flexion to 40 degrees and479
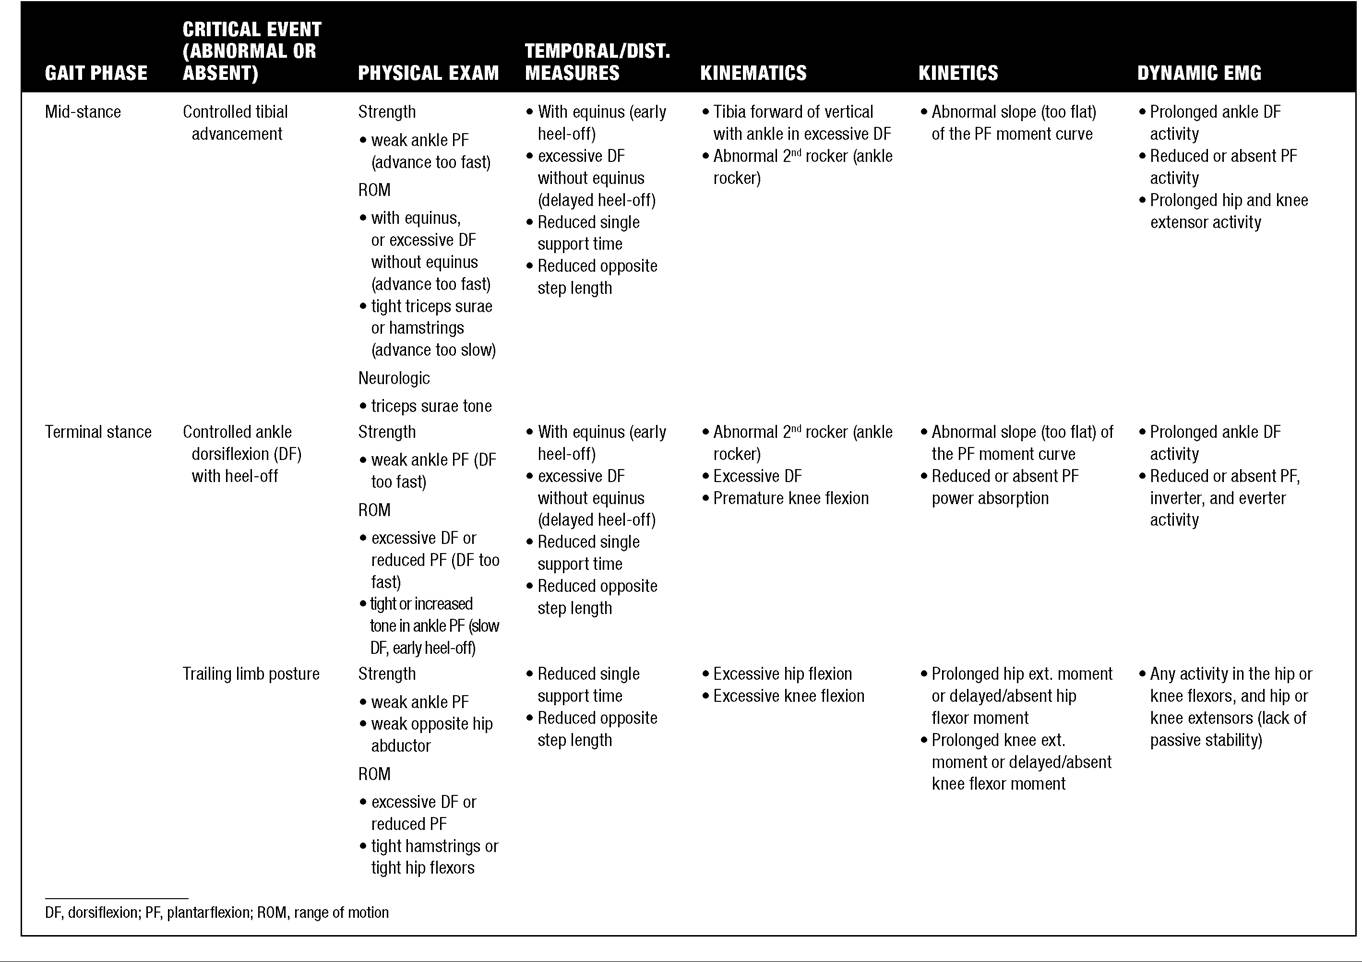
rapid ankle plantar flexion. As previously discussed, pre-swing is an important transitional phase that, while still a component of stance period, is functionally more associated with preparing the trailing limb for the swing period to come. Achieving 40 degrees of knee flexion before the foot leaves the ground is essential. This is because once the foot is airborne, the leg acts as a compound pendulum, so further knee flexion is completely dependent on concentric contraction of the hip flexors, including the adductor longus, and the inertia of the lower leg and foot (36). At normal walking speeds, knee flexion during pre-swing requires no active muscle contractions around the knee (passive). It occurs by a complex mechanism that involves continuation of tibial advancement as the forefoot rocker continues from terminal stance; unloading of the limb as weight is transferred to the new stance limb; continued concentric contraction of the triceps surae, which produces rapid plantar flexion that propels the knee joint in front of the ground reaction force vector, and concentric contraction of the adductor longus to initially accelerate the thigh forward (31).
All of these actions push the ground reaction force vector so far behind the knee that it collapses in the absence of an equalizing knee extension moment produced by the quadriceps that normally are silent during pre-swing. So weakness in the plantarflexors, hip flexors, or adductor longus all have an adverse effect on achieving the necessary knee flexion.
Since a trailing limb posture with hip extension to 10 degrees past neutral amplifies the effect of the third rocker to shift the tibia forward, hip flexion contracture can also reduce the ability of the knee to passively flex to 40 degrees, despite the fact that such a contracture often prevents the knee from fully extending at terminal stance. Furthermore, it is interesting that because of the hip extensor component of the biarticulate hamstrings, inappropriate activation or tightness of these open-chain knee flexors can inhibit passive knee flexion in pre-swing by resisting the hip flexors and adductor longus as they attempt to accelerate the thigh. Problems with this critical event can be identified from the sagittal plane knee kinematics, the hip moments and powers, and the hip knee and ankle dynamic EMG. Problems with rapid plantar flexion, which is necessary to produce sufficient knee flexion in pre-swing, are also evident from the ankle kinematics, kinetics, and dynamic EMG. Since the critical events in this phase are so dependent upon concentric contraction and power generation at the hip and ankle, interventions to replace hip flexor and ankle plantar flexor strength are somewhat limited to AFOs that can return plantar flexion moment in pre-swing or enhance the third rocker, or stretching, lengthening, or weakening muscles that may be inhibiting hip flexion using neurolytic agents or surgical procedures (42).In initial swing, the only critical event is to achieve maximum knee flexion of at least 60 degrees. If 40 degrees of knee flexion has been achieved at the end of pre-swing and the hip flexors and adductor lon- gus stop firing before the end of initial swing, then in the absence of inappropriate quadriceps or hamstring activity, sufficient knee flexion should occur naturally during this phase. The point of maximum knee flexion must occur before the end of initial swing (not during mid-swing or terminal swing), since this is the point where the swinging limb must be at its shortest functional length to successfully clear the ground.
The ankle dorsiflexors (pretibials) are firing concentrically at this time to bring the foot from its point of maximum plantar flexion at the end of pre-swing to at least neutral by the end of initial swing so that toe clearance can be assured in mid-swing. In this phase, kinematics can be used to quantify the progress of the swinging limb, joint moments in the sagittal plane should be near zero, and dynamic EMG can be used to identify inappropriate muscle firing. Of particular interest in this phase is the activity of the rectus femoris. This biarticulate muscle initially is active in late pre-swing to assist with accelerating the thigh forward. At the moment the foot leaves the ground, continued activity of the rectus femoris may assist with hip flexion, but may have the negative consequence of providing openchain knee extension through the patellar ligament. Since it has been shown that the brain uses the rectus femoris to accelerate the thigh to selectively control step length and cadence during swing (36), if hip flexor angular velocity is initially slow and 40 degrees of knee flexion was not achieved at the moment of foot-off, the rectus femoris may increase its activation in initial swing to serve as an auxiliary hip flexor. This abnormal compensatory activity of the rectus femoris is in an effort to produce increased thigh acceleration, but because of its biarticular structure, it yields the negative effect of producing a larger knee extension moment, exacerbating the problem of insufficient knee flexion in swing. Whether the rectus femoris is firing as a compensatory mechanism or because of incorrect motor control associated with upper motor neuron injury, if it continues to be active at the end of initial swing, it may contribute to the abnormality known as stiff-knee gait, the common name given to the gait abnormality of insufficient knee flexion in swing period. If kinematic and electromyographic evidence (reduced knee flexion peak and/or slope and prolonged activation) exist, then a rectus femoris transfer to the semimembranosus or sartorius may harness this inappropriate activity, or more likely, prevent concentric knee extension from limiting peak knee flexion in swing and thereby disrupt swing limb advancement. The rectus femoris transfer for the treatment of stiffknee gait is a surgical procedure that was conceived as a direct result of using IGA techniques (43) and has been supported by a series of laboratory investigations and long-term follow-up (44,45,46,47,48,49). It is now considered the standard of care for the treatment of stiff-knee gait when evidence from IGA confirms that the rectus femoris is responsible for failure to achieve the critical event of obtaining maximum knee flexion of 60 degrees during initial swing.The two critical events during mid-swing are both related to achieving toe clearance as the limb swings through the lowest point in its arc of motion and it is at greatest risk to inadvertently make contact with the ground. These critical events are maximum hip flexion to 30 degrees and neutral ankle dorsiflexion. The hamstrings may fire near the end of mid-swing to begin decelerating the forward movement of the thigh or to slow down the cadence, but generally these muscles should be silent until terminal swing. Note that after the swinging limb clears the floor, there is typically no further need for hip flexion, and additional hip flexion will only decrease the likelihood of achieving the final critical event during terminal swing: knee extension to neutral. Children with cerebral palsy and other patients with upper motor neuron disease have a difficult time motor programming the previous two phases of motor activity, and often display excessive knee and hip flexion with peak values later than normal during mid-swing. Kinematics and dynamic EMG can help identify these incorrect patterns, and the usual procedures of stretching, lengthening, or injecting the offending muscles may be useful if they can permit the critical events in pre-swing and initial swing to occur. The critical event of neutral dorsiflexion is usually the responsibility of the ankle dorsiflexors, which typically initiate concentric activity in pre-swing. The pretibial muscles generally reduce their activity in this phase since they no longer need to concentrically contract from the plantar flexed position and are only needed to hold the foot against gravity.
If they are weak or if there is an upper motor neuron injury preventing normal motor control, foot drop will result, which will adversely affect toe clearance and necessitate compensatory mechanisms of circumduction at the hip, increased ipsilateral pelvic obliquity (hip hiking) or contralateral early heel-off (vaulting). The most common solution to this problem is to prescribe an AFO with a plantar flexion stop to hold the foot in the correct position throughout swing period. In children and adults with TBI, dynamic EMG can be used to determine if the lack of dorsiflexion during swing is related to incorrect cortical control or an inability to correctly motor-plan the dorsiflexion activity. In the latter, training with biofeedback of muscle contraction may improve foot clearance during swing and eliminate the requirement of using an AFO.The final critical event in the gait cycle is knee extension to neutral during terminal swing. This represents the last opportunity of the swinging limb to reposition the foot prior to weight acceptance, and if this critical event is achieved, a sufficiently long step length will result. In typically developing children and normal adults, hamstring activity will begin during this phase to decelerate the swinging lower limb so that a small amount of knee flexion (Reduced knee extensor power absorption
• Abnormal hamstring activity
• Weak ankle PF
ROM
• Excessive DF or reduced PF
• Prolonged stance period
• Excessive DF early or reduced PF late in preswing
• Reduced peak PF power generation
• Inappropriate cocontraction of ankle PF, DF
• Weak hip flexors
ROM
• Tight rectus femoris
• High variability in swing period or step length
• Incorrect slope in knee flexion wave
• Slow ankle DF
• Reduced or absent ankle DF activity
• Weak hip flexors
ROM
• Tight hamstrings
• High variability in swing period or step length
• Abnormal pelvic obliquity (hip hike) or hip abduction (circumduction)
• Premature knee flexor power absorption
• Premature hamstring activity
• Weak ankle DF
ROM
• Tight ankle PF
• High variability in swing period
• Any PF activity
• Weak hip flexors or knee extensors
ROM
• Tight hamstrings
Neurologic
• Hamstrings tone
• High variability in swing period or step length
• Compensatory and excess hip flexion for limb clearance
• Reduced or absent ankle DF activity
DF, dorsiflexion; PF, plantarflexion; ROM, range of motion.
(spastic, athetoid, ataxic, and mixed), more than 70% are classified as having spastic cerebral palsy, as is the subject of this case study.
“LD” is a nonverbal 13.5-year-old male with spastic diplegia and developmental delays. His mother had an uncomplicated pregnancy, and he was born full-term, but in his first year of life he demonstrated delayed developmental milestones and did not start walking until age 6. He is also hearing-impaired with cognitive, behavioral, and oral motor dysfunction. Previous treatments included oral baclofen, which had little effect on gait performance, and bilateral hinged AFOs. He had no neurologic or orthopedic surgical procedures performed prior to his visit to the cerebral palsy clinic at our institution, after which LD was referred to our motion laboratory for instrumented gait analysis. His family reported an increased incidence of tripping and falling over the previous 15 months with fast walking and a perceived reduction in overall gait performance. They also reported that the left leg was now turning out more than in the past.
The physical examination performed on the day of the gait analysis measured LD's height as 165 cm, his weight as 63 kg, and he had equal leg lengths. No fixed joint contractures were found, but he showed a popliteal angle of -65 degrees bilaterally, consistent with hamstrings tightness. We measured a thigh-foot angle of 35 degrees external on the left, 25 degrees external on the right, slight hindfoot valgus, moderate forefoot abduction, and moderate pes planus bilaterally. Ely and Thomas tests were normal, and there was no appreciable spasticity (1 on the Ashworth scale) in the hamstrings, quadriceps, peroneals, tibialis posterior, toe flexors, or triceps surae bilaterally. Strength information from manual muscle test of the major muscle groups was inconclusive due to the inability of the subject to perform an isolated muscle contraction and his difficulty understanding instructions due to cognitive limitations. However, the therapist performing the physical examination reported that most muscle groups should be at least in the range of 3-4 by observing other functional activities and by noting that the subject is an independent, limited community ambulator.
Radiographs taken at the time of the analysis showed slight adduction of the proximal femurs but no sign of femoral head uncovering and otherwise normal hip joints bilaterally. Standing anterior/posterior (A/P) and lateral radiographs of the foot showed forefoot abduction, uncovering of the talus, midfoot collapse, and a reduced height of the medial longitudinal arch (see Fig. 16.14). This was consistent with evidence of increased pressure at the navicular during the physical exam and redness caused by the orthotics in the same area.
Observational gait analysis using slow-motion video recordings while the subject walked barefoot in
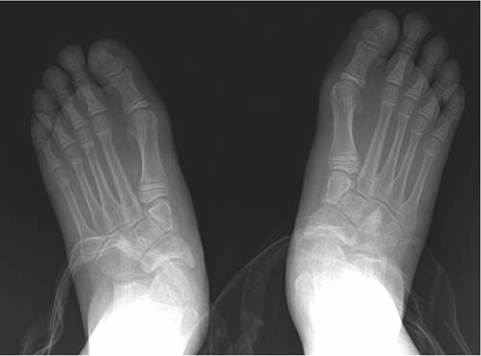
Figure 16.14 Bilateral A/P radiograph of the feet of the subject described in case study. This radiograph is commonly required when the subject presents with pes planus, to better understand the structural alignment of the foot.
the laboratory showed a stiff-knee gait pattern during initial swing phase, reduced peak knee flexion in midswing, insufficient knee extension during terminal swing, and a reduced dynamic knee range-of-motion throughout the gait cycle, all observed bilaterally. LD shows a foot-flat initial contact bilaterally, with no sign of a heel or first rocker (see Fig. 16.13). At the ankle, LD showed premature tibial advancement during loading response and mid-stance with delayed heel-off bilaterally. In the frontal plane, LD demonstrated moderate lateral trunk lean during loading response on both sides consistent with a compensated Trendelenburg's gait pattern, suggesting weakness of the hip abductors.
The instrumented gait analysis included temporal- spatial measures, 3D kinematics, 3D kinetics, and dynamic EMG recorded from six muscles bilaterally using bipolar surface electrodes. Because of the report of pes planus, a plantar pressure recording was included to document the existence of excessive pressure in any area of the foot. The temporal-spatial recordings showed an average cadence of 103 steps/minute (88% normal) and an average walking speed of 51 meters/ minute (65% normal). The left side average step length was 0.54 meters (80% normal) and the right side was slightly less at 0.47 meters (70% normal). There were no appreciable differences in gait symmetry or timing of gait events between the left and right sides, with the exception of a slightly longer single limb support time on the left that was not considered clinically significant (95% normal on the left, 89% normal on the right).
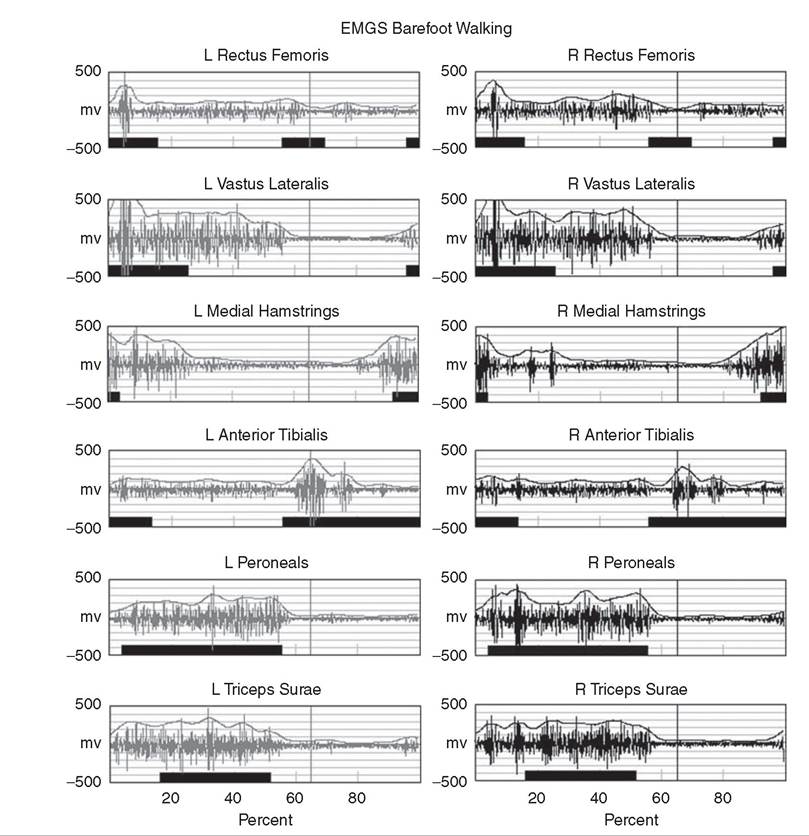
Kinematic, kinetic, and dynamic EMG data from both legs for the barefoot trial are shown in Figures 16.15, 16.16, and 16.17, respectively. On the
Gen
-2.5
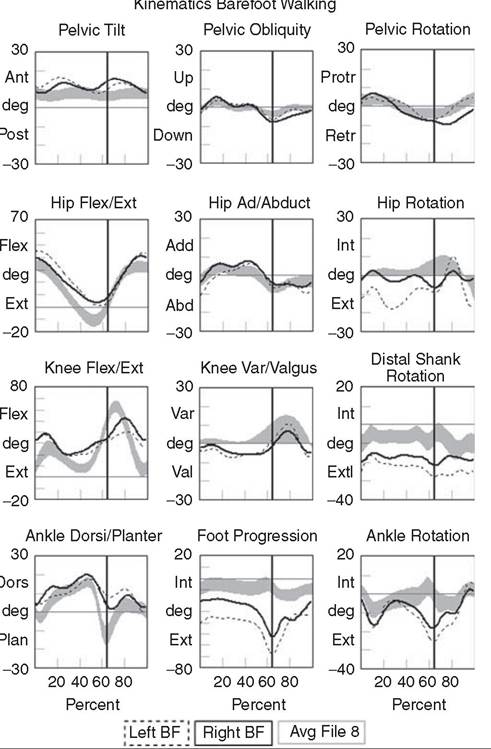
Figure ib.15 Inree-Uimensionai Kinematic graphs constructed from a representative trial from the instrumented gait analysis of the 13.5-year-oid case-study subject, “LD.” The solid line describes the right side, the dashed line shows the left side, and the gray band is from the age-matched normal database collected in the laboratory and used as a reference.
kinematic and kinetic curves, the right side is represented by a solid line and the left side uses a dashed line, and for comparison, a gray band is included on each graph representing the ensemble averages from our typically developing child database for this age group. The gray bands correspond to +/- 1 standard deviation across the ensemble average for that graph. For the EMG data shown in Figure 16.17, the right side is darker, the left side is lighter, and the black bar at the bottom of each graph is a normal timing reference.
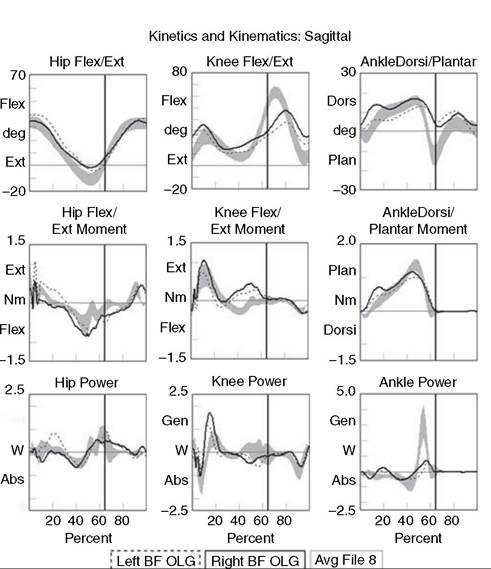
Figure 16.16 Three-dimensional graphs of sagittal plane kinematics, sagittal plane joint moments, and total joint power for the hip, knee and ankle constructed from a representative trial from the instrumented gait analysis of the 13.5-year-old case-study subject, “LD.” The solid line describes the right side, the dashed line shows the left side, and the gray band is from the age matched normal database collected in the laboratory and used as a reference.
There are a variety of ways to review these data systematically, including evaluating each joint or segment in sequence starting either proximally or distally, evaluating all graphs for a particular data type first and then moving on to the other categories, or reviewing all data for a particular phase of gait and then advancing to the next phase until the cycle is completed. Which of these procedures to follow is a matter of personal preference, and is sometimes dictated by the complexity of the case, but for the novice, it is a good idea to consistently follow the same procedure or review sequence until you are comfortable recognizing the significance of each graph individually. We typically start with the kinematic graphs and work distally from the pelvis, scanning the graphs across all phases of the gait cycle to identify deviations from the normal reference. We focus first on the portions of the curve that have the largest deviation from the reference data and then attempt to describe these deviations in the context of the 8 gait phases and 13 critical events described previously and summarized in Table 16.3. As needed, we jump to the subject's kinetic and EMG data for additional evidence to explain the absence of a critical event at a specific phase of the gait cycle, and using all of the evidence gathered in the analysis, develop a logical rationale for the subject's unique gait pattern or abnormality.
In the case of LD, we see evidence of slightly increased anterior pelvic tilt starting during loading
I Avg EMG Control ] Left BF ∣ Right BF]
Figure 16.17 Filtered and time normalized EMG for 12 muscles of the lower extremity for a representative trial from the instrumented gait analysis of the 13.5-year-old case-study subject, “LD.” The black bars at the bottom of each graph are constructed from published normal EMG activations and are used as reference values. The smooth curve above the EMG activation is a processed EMG signal obtained by rectifying and integrating the raw EMG.
response and reaching a peak of approximately 18 degrees at mid-stance on the left and 14 degrees on the right (Fig. 16.15, first row). This gives rise to a pattern often seen in diplegia called a “double bump” as the pelvis tilts slightly forward during weight acceptance on each side. It is often associated with weakness of the hip extensors and lack of shock absorption more distally, and can be attributed to reduced performance in the critical event of hip stability during loading response. Another cause could be tight hip flexors, but this is unlikely given that the Thomas test from the physical examination was negative. The existence of the second bump in the pattern during pre-swing and initial swing comes from the same mechanism occurring at loading response on the contralateral side. It is reflected in the ipsilateral pelvic tilt because the pelvis is, of course, a single segment and the graphs of each hemipelvis section are 180 degrees out of phase. Pelvic obliquity and pelvic rotation are near normal bilaterally until foot-off and the beginning of initial swing, when the right hemipelvis drops and retracts slightly compared to the normal reference and the left side. This suggests that the compensated Trendelenburg’s gait pattern observed is not completely effective at maintaining appropriate pelvic position on the right side during initial swing, possibly due to weaker hip abductors on the left side during loading response. All of these compensations can be attributed to difficulty achieving the critical event of hip stability during loading response and are evidence of proximal weakness during the task of weight acceptance.
Moving to the hip joint, LD shows increased hip flexion during loading response, decreased hip extension during terminal stance and pre-swing, and increased hip flexion at terminal swing bilaterally. Notice that the shape and range-of-motion for the hip flexion curve is virtually the same as the average normal curve, except that it is shifted up toward increased flexion by about 10 degrees. This is approximately the same amount that the corresponding anterior pelvic tilt curve is offset from its normal value. These two graphs are often coupled since hip joint angles are calculated relative to the pelvis, the more proximal segment. The lack of hip extension at terminal stance is the most significant limitation here, since it negatively affects the ability to achieve a trailing limb posture during terminal stance, which is essential to achieving maximum stride length on the contralateral side. Moving to Figure 16.16 and the sagittal plane kinetics at the hip joint, we see no significant deficits in the hip moment curve bilaterally, but a reduced hip power generation at pre-swing, approximately 70% normal on the left and 50% normal on the right. Since sufficient power generation at the hip is necessary to achieve the critical event of passive knee flexion to 40 degrees during pre-swing, and is also a necessary precursor to accomplish the task of swing limb advancement (50), reduced power generation at the hip may contribute to LD's increased incidence of tripping when trying to walk at higher speeds.
Returning to Figure 16.15, the transverse plane motion at the hip shows near normal hip rotation on the right side, but increased hip external rotation of approximately 10 to 15 degrees on the left side. This suggests that some of the reported external foot position on the left can be attributed to the hip. Looking distally down the kinematic chain, we see additional contribution to the final foot progression angle occurring at the knee (distal shank rotation, left approximately 20-25 degrees external, right approximately 10-15 degrees) and to a much lesser extent at the ankle bilaterally, yielding a final foot progression angle of approximately 40 degrees on the left and 20 degrees on the right during mid-stance and terminal stance. We use the term “distal shank rotation” here rather than knee rotation to highlight that the recording includes the external “twist” of the tibia or tibial torsion in the graph rather than just the amount of rotation occurring between the thigh and shank segment. The modified Helen Hayes marker set used to produce these curves assumes that the ankle joint axes and knee joint axes are offset in the transverse plane by the amount of the tibial torsion and normally wouldn't include this offset. We prefer to include the tibial torsion in this curve to better understand the contribution of tibial torsion to the overall foot progression angle, and therefore, call it the distal shank rotation to avoid confusion. It is good practice to have a clear understanding of how the link-segment model is calculating a particular quantity before utilizing it for clinical decision-making, and this curve in particular is frequently affected by vague or unstated model assumptions. To conclude the rotational assessment, we see a large peak in the external foot progression angle (left approximately 70 degrees external, right 50 degrees external) that corresponds to a lateral whip of the foot at foot-off, most likely as a compensatory mechanism to help with limb advancement. This large external foot progression angle with the left about 20 degrees greater than right, is consistent with the parents' description, and from the kinematic analysis, can be attributed to both the thigh and shank on the left, and from compensatory mechanisms at the foot and ankle bilaterally.
The analysis now moves distally to the knee, where some of the most significant gait deviations exist. In Figure 16.15, the bilateral knee flexion/exten- sion curves show increased knee flexion (relative to the normal reference) during loading response, decreased knee extension during terminal stance, decreased and delayed peak knee flexion during initial swing (left more severe), and increased knee flexion during terminal swing and initial contact. This has the appearance of compressing the knee sagittal plane curve into the middle range of the normal reference, with a shallow rising slope from mid-stance through initial swing (left = 52 degrees/second, right = 65 degrees/sec, normal = 240 degrees/sec), and decreased dynamic range at the knee over the entire gait cycle (left = 24 degrees, right = 31 degrees, normal = 60-70 degrees). The existence of swing period gait deviations at the knee prevents the most important critical event in swing from being accomplished: achieving maximum knee flexion of at least 60 degrees. Their presence also provides evidence of a bilateral stiff-knee gait pattern that, as previously described, adversely affects the task of swing limb advancement. But when taken together, this combination of excessive knee flexion in stance and insufficient knee flexion in swing has the effect of disrupting all other critical events associated with normal knee function, including controlled knee flexion during loading response, achieving trailing limb posture during terminal stance, passive knee flexion to 40 degrees during pre-swing, and finally reaching full knee extension during terminal swing. With this many critical events absent, altered, or delayed, all three fundamental gait tasks are compromised. Therefore, in order to see any significant improvement in walking ability, these critical events need to be restored, which by necessity prioritizes any intervention directly affecting knee range of motion during the gait cycle. To find support for specific interventions, we return to the kinetic and EMG recordings shown in Figures 16.16 and 16.16, respectively. In the top row of Figure 16.17, we see that both the left and right rectus femoris EMG recordings show muscle activation beginning late in initial swing and continuing until terminal swing, with a small peak in initial swing slightly before peak knee flexion. This abnormal EMG activity in combination with insufficient peak knee flexion in initial swing and a shallow slope of the knee curve during pre-swing provide strong evidence to support the use of a rectus femoris transfer procedure bilaterally 46,49). When successful, this procedure can improve both the peak knee flexion in swing and the slope of the knee flexion wave starting in pre-swing, addressing two missing critical events at the knee. To address the other affected critical events, we must review the kinetics and EMG recordings during initial contact, loading response, mid-stance, and terminal swing phases. With greater than 20 degrees of knee flexion throughout stance period, there is a significant force demand on the knee extensors during weight acceptance and single limb support. Evidence of this can be found in the large knee extensor moments during loading response and terminal stance, shown in the middle graph of Figure 16.16, and the prolonged stance phase EMG activity of the vastus lateralis and rectus femoris shown in Figure 16.17. These findings are consistent with a mild “crouch gait” deformity, set up by the limitation in knee extension at terminal swing.
While LD is able to overcome this biomechanically disadvantaged position and maintain an upright posture at this time, as he matures and grows heavier, any increase in knee flexion during stance may increase the demand to a level greater than he can withstand, which would severely limit his overall gait performance. It is reasonable here to consider the more aggressive surgical procedures that have been shown to improve knee function in cases of persistent crouch gait, namely a knee extension osteotomy to reduce knee flexion contracture and patellar advancement to treat patella alta and improve the function of the quadriceps (51). Since LD showed no significant knee flexion contracture on physical examination or radiographic signs of patella alta, and the crouch deformity was considered mild since he could achieve 20 degrees of knee flexion at terminal stance, these surgical procedures were deemed unnecessary at this time. However, since there was evidence of tight hamstrings on physical examination (popliteal angles of -65 degrees) and the EMG recording of the medial hamstrings (third row, Figure 16.17) showed premature onset in mid-swing, the team felt hamstring lengthening procedures would be appropriate. Nonsurgical techniques such as phenol injections to the hamstrings could be considered here, but with strong evidence for rectus femoris transfer and the ease of performing a hamstring lengthening at the same time as the rectus procedure, the surgical path seemed most appropriate for this patient. Furthermore, the combination of these two procedures has the best chance of restoring all missing critical events at the knee in the shortest amount of time to prevent continued progression of the crouch gait deformity as LD grows larger through adolescence.
To complete the instrumented gait analysis, we move distally once more to the remaining graphs describing the ankle and foot. The sagittal plane ankle kinematics graph in the lower-left corner of Figure 16.15 provides evidence of what was seen during the observational analysis: increased dorsiflexion at initial contact and no sign of a first or heel rocker during loading response. This is consistent with the foot-flat initial contact observed, and is shown on the kinematic graph as an increasing slope in the first 10% of the gait cycle starting at 5 degrees of dorsiflexion, rather than a decreasing slope starting from a near-neutral ankle position for the normal reference. The right side shows increased dorsiflexion continuing into mid-stance, with a peak at about 15% of the gait cycle, after which the dorsiflexion stabilizes and then increases at a more normal rate (slope of the ankle curve) near the upper extreme of the normal reference until the beginning of terminal stance. After beginning in a dorsiflexed position at initial contact, the left side dorsiflexion increases at a normal rate, tracking closely the slope of the reference value and providing evidence of a near-normal second or ankle rocker. Following peak dorsiflexion in terminal stance, the period of rapid ankle plantar flexion during pre-swing begins, which is associated with the third or forefoot rocker. Unfortunately, maximum plantar flexion stops at a joint angle of approximately 8 degrees dorsiflexion on the left and 2 degrees dorsiflexion on the right—clearly insufficient compared to the normal reference. The ankle then maintains a dorsiflexed position throughout swing period bilaterally. Considering these elements together and describing them in terms of fundamental gait tasks and critical events, we begin to see a clear picture of the impact of these gait deviations at the ankle. First, we have evidence that during weight acceptance LD is missing a heel-first initial contact and controlled ankle plantar flexion (first rocker) bilaterally. Second, during single limb support, controlled tibial advancement (second rocker) is altered on the right and controlled ankle dorsiflexion (DF) with heel rise is delayed bilaterally. Finally, while starting the task of swing limb advancement, rapid ankle plantar flexion (third rocker) in pre-swing is reduced bilaterally. Fortunately, LD does maintain sufficient dorsiflexion in mid-swing to clear his foot so as not to compound the lack of knee flexion and stiff-knee pattern already affecting swing limb advancement. As with the analysis at the knee, failure to achieve these critical events at the ankle represents significant gait dysfunction and must be addressed. Additional insight can be obtained from the kinetic graphs on the rightmost column of Figure 16.16 and the EMG recordings in the lower three rows of Figure 16.17. As is seen on the right side of Figure 16.16, the combination of foot-flat initial contact, increased knee flexion, and increased ankle dorsiflexion during loading response places a large demand (external moment) on the ankle plantar flexors, and they respond by increasing the net ankle plantar flexion moment (internal moment) during loading response and the early portion of mid-stance. This is most likely a compensatory response to the external demand, and is accomplished by prematurely activating the peroneals and triceps surae during terminal swing, initial contact, and loading response. Notice that the peak in right ankle dorsiflexion at approximately 15% of the gait cycle is accompanied by a peak in the plantar flexion moment and just preceded by a small peak of ankle plantar flexor power absorption, shown in the lower-right graph of Figure 16.16. The ankle power curve then reverses to produce a small amount of power generation at the point in the cycle (mid-stance) when continued ankle dorsiflexion is briefly reversed and the ankle plantar flexion moment returns to normal levels. This suggests that although biomechanically disadvantaged by foot position and excessive knee flexion, the ankle plantar flexors initially absorb energy during loading response as the tibia falls forward, but then limit excess dorsiflexion with a brief burst of power generation at the ankle at the beginning of mid-stance. Since the physical examination was inconclusive, it isn't clear whether this is due to true ankle plantar flexor strength or simply the resistance or viscoelastic behavior of the muscluloten- don unit. Regardless, it does explain the early dorsiflexion peak in the ankle sagittal plane graph and suggests there is some eccentric control over tibial advancement during loading response and mid-stance.
However, ankle function is not as good during terminal stance and pre-swing, when the powerful concentric contraction of the triceps surae is needed to produce rapid ankle plantar flexion. The strongest evidence of this is shown in the reduced ankle power generation during pre-swing in Figure 16.16, where the power generation is approximately 25% normal on both sides. Since power generation is normally larger at the ankle than at any other joint, and substantial power generation from both the hip flexors and ankle plantar flexors is necessary to produce passive knee flexion during pre-swing, this is a profound deficit that affects both the knee and the hip, and is the strongest evidence of plantar flexor weakness in the analysis.
The experienced gait analyst might cite the delayed heel-off and short step length of this “calcaneal gait” pattern as obvious indicators of calf weakness. While this may be true, the ankle power data provides a strong quantitative justification for such a claim, and has the added benefit of gauging the degree of dynamic plantar flexor weakness that occurs at this critical point in the gait cycle. This evidence, along with the excess dorsiflexion during stance period and our concerns about more severe crouch gait deformity as LD matured, eliminated any thoughts of a tendo- achilles lengthening or intramuscular lengthening of the gastrocnemius for this subject.
Based on the results of the instrumented gait analysis and the other physical examination and radiographic evidence, and following consultation with the patient and his family, our clinical team recommended that LD undergo bilateral rectus femoris transfers to the semitendinosis, bilateral hamstring lengthenings, bilateral Evans calcaneal lengthenings, and a left tibial osteotomy of approximately 20 degrees internal. The rectus femoris transfers were clearly indicated from both kinematic and dynamic EMG evidence and the presence of a stiff-knee gait pattern. The hamstring lengthenings were supported by physical examination and IGA data, and could be efficiently performed in conjunction with the rectus transfers. Since there were no previous surgical procedures performed on the hamstrings, we prefer to transfer the rectus femoris to the semitendinosis, although we have found no evidence to rule out the other potential transfer sites of sartorius or gracilis (49). The Evans calcaneal lengthenings were primarily supported by the radiographic evidence that showed significant uncovering of the talus and forefoot abduction with mid-foot collapse. While not always a part of our IGA procedure, for this case, a foot plantar pressure measurement from each limb was recorded using a two-meter pressure plate mounted in the motion laboratory walkway after the force platform array. These recordings confirmed the existence of pes planus and showed an increased pressure under the first metatarsal heads and medial border bilaterally, with the pressures higher under the left foot. This information, combined with concerns expressed by the family regarding LD's flat feet, as well as the clinical team's hope that a more rigid and properly aligned foot could improve the power generation capability of the ankle plantarflexors during pre-swing, convinced us to add this procedure to the list. The left tibial osteotomy was warranted based on the rotational kinematic findings that showed a distal shank rotation of approximately 15-20 degrees greater than normal, a foot progression angle approximately 25-30 degrees greater than normal (including the contribution from the external hip rotation that was believed to be compensatory), and the family's concerns about the limb asymmetry and increasing external foot position.
Finally, bilateral leaf-spring ankle foot orthoses were prescribed to provide some plantar flexor assist and to help control tibial advancement in the presence of the weak plantar flexors that would most likely persist after LD recovered from his surgical procedures. However, we are hopeful that the improved biomechanical position, increased knee flexion in swing phase, increased knee extension at initial contact, and more rigid foot that we expect will result from these surgical interventions will reduce the physical demands of walking sufficiently for the AFOs to be discontinued once LD fully recovers. While a follow-up gait analysis to confirm our recommendations could not been included here since it had not been completed at the time of this writing, it really isn't the purpose of this case study to demonstrate our gait analysis prowess using a single sample. Rather, we hope this clinical example serves to illustrate how instrumented gait analysis and a systematic analysis procedure based on functional decomposition of the gait cycle can be used to make complex clinical decisions for the pediatric patient with gait dysfunction.
More on the topic Critical Events During the Swing Limb Advancement Task:
- Critical events link gait IMPAIRMENTS TO POSSIBLE INTERVENTIONS
- III Timetable of important events and laws
- Agents and Doers, Actions and Actional Events
- The Great Recession that began in the fall of 2008 was caused by a series of complex and connected events.
- TECHNICAL FACTORS OF NEEDLE ELECTROMYOGRAPHY
- Integrity as dissonance reduction