Cell growth and differentiation
While a definition of growth might seem to have a commonsense answer, characterizing growth is not simple. The question is what do we mean when we say growth? The simple answer might be—it got bigger.
However, it is important to understand that changes in mass can occur for a variety of reasons. For example, under some circumstances, it is possible to accumulate fluids in the interstitial spaces between cells so that edema occurs. This can occur in female 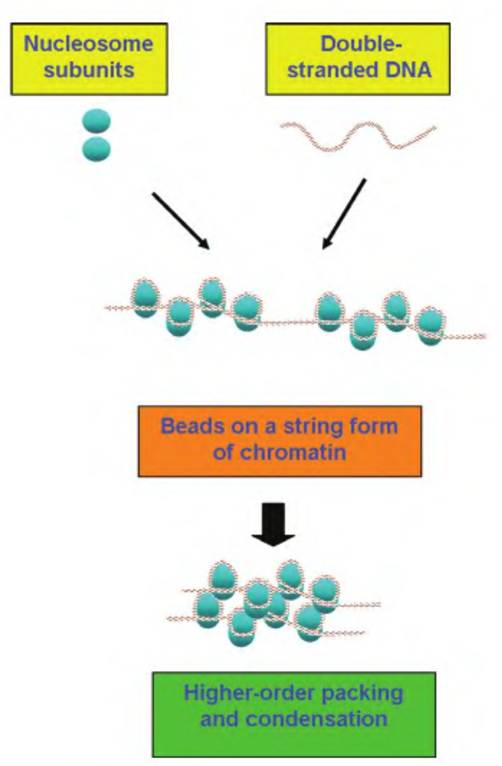
Fig. 2.14. DNA and histone relationships. DNA-binding proteins as well as the histones and nonhistones form complexes (nucleosome subunits) that allow the coiling of DNA into compact particles that make up chromatin. This can be envisioned first by the formation of subunits to create the core particle followed by the coiling of DNA around the structure. This produces a structure described as beads on a string. Further packing and condensation leads to a higher order of structure and remarkably organized packaging of DNA.
humans as the stages of the menstrual cycle wax and wane. Another example is the mammary edema that frequently occurs as cows or goats approach parturition or the facial edema that can occur as a side effect of steroid treatments. But these increases in size would not be considered growth. In most instances, growth depends on an increase in cell number. This is called hyperplasia. It is also possible for cells to increase in size; this is called hypertrophy. Both of these processes are involved in growth. It is also possible to increase the noncellular constituents between cells (extracellular proteins and complex carbohydrates) and affect an increase in tissue mass. This can be considered growth as well. This suggests that really understanding growth requires an understanding of the specific types of cells that might be dividing to affect an increase in tissue or organ mass as well as products that these various cells might be synthesizing.
In many cases, it is possible to obtain a more detailed view of growth by measuring specific tissue components. For example, at any given moment, only a small fraction of the total cells in a tissue or organ are actively synthesizing DNA in preparation for cell division. For a brief period just before the cell divides, it will have duplicated its chromosomes so that it will have twice (2n) the normal complement of DNA. However, since this typically is occurring in only a small fraction of cells, measuring the total tissue content of DNA is an effective, quantitative way to determine changes in growth. After all, an increase in the DNA content of a tissue or organ can usually only be explained by an increase in cell number. Realization in the early 1960s that the DNA content of cells is essentially constant (with the exception of the generally small proportion of cells that are undergoing DNA synthesis in preparation for cell division at a given moment) ushered in a host of studies to estimate number based on total DNA content. Techniques to accurately and easily measure DNA have evolved so that assay of DNA is now a primary means used to determine if growth is due to an increase in hyperplasia. Data in Table 2.4 illustrate the dramatic changes in mammary growth from birth
Table 2.4. Mammary parenchymal growth in heifers and ewes.
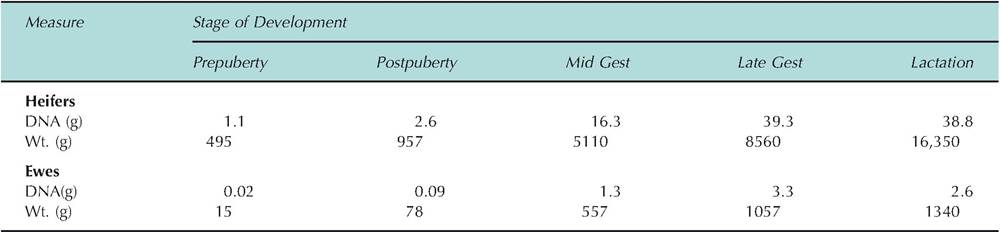
Data adapted from Sejrsen et al. (1982, 1986), Keys et al. (1989), Smith et al. (1989), and McFadden et al. (1990).
to lactation in Holstein heifers and crossbred ewes. Measured as trimmed udder weight or parenchymal DNA, mammary growth is greatest during gestation. However, relative lack of change in DNA from late gestation into lactation compared with trimmed udder weight suggests that DNA is a better measure of cell growth, since increased weight may be accumulated secretions. This method is especially valuable when combined with careful dissection of the mammary gland to distinguish the parenchymal portion (regarded as the functional tissue of an organ) from the stromal tissue of the mammary gland.
Even with careful dissection of the mammary gland to remove apparent connective tissue, there are clearly nonglandular cellular elements, that is, blood vessels, lymphatic vessels, nerves, fibroblasts, adipocytes, and white blood cells, which contribute to the DNA content of the parenchymal tissue compartment. This illustrates the difficulty of accurately and precisely estimating growth at the tissue level. Regardless, classic studies in a variety of lactating species give direct evidence that the number of mammary epithelial cells is proportional to milk production. Indeed, the correlation between total parenchymal DNA and milk production averages about 0.85.A more acute, dynamic means to evaluate cell proliferation utilizes either radioactively tagged thymidine (a nucleotide base that is unique to DNA) or the analog bromodeoxyuridine (BrdU), which incorporates into growing DNA strands like thymidine does. In these cases, animals to be tested are injected with the test substances, or in vitro experiments with cells or tissue incubated in culture are exposed to radiolabeled thymidine or BrdU. After an appropriate period of time, tissues are removed and the quantity of material incorporated is measured. The greater the rate of incorporation (or the proportion of cell nuclei that are labeled), the greater the growth rate, since only cells in the S phase (period of DNA synthesis prior to cell division) of the cell cycle accumulate these compounds. Figure 2.15 provides an example of changes in mammary tissue cell growth induced by the treatment of heifers with bovine growth hormone (bST) and shows that the effect is primarily in the epithelial cells of the mammary gland. However, other components may also be excellent measures of growth. For example, an increase in muscle tissue would be an evidently desirable attribute for a lamb producer. Quantification of such an effect might be better confirmed by measuring total muscle protein rather than DNA.
Clearly, the question of growth is complex, but understanding and regulating rates and types of tissue growth are key elements of many aspects of animal agriculture.
For example, lamb or beef producers are concerned with getting their animals to market weight at an appropriate body composition as rapidly and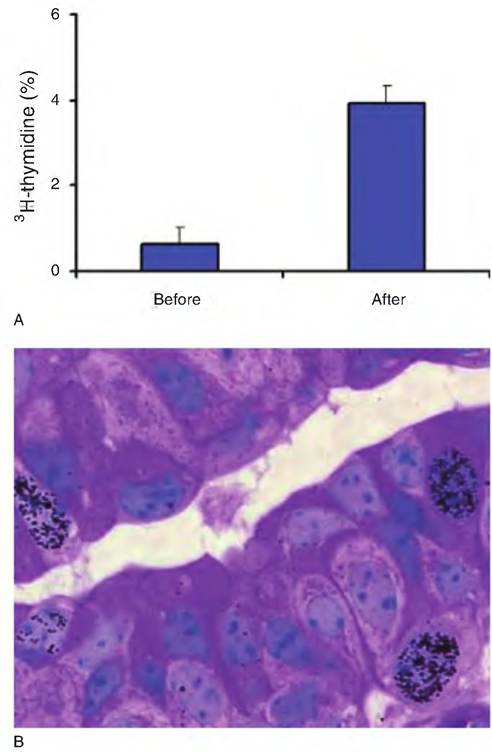
Chapter 2
Fig. 2.15. Proliferation and cell growth. Panel A shows proliferation of bovine mammary epithelial cells indicated by the percentage of epithelial cell nuclei incorporating tritiated thymidine in prepubertal heifers before or after a 1-week treatment with bovine growth hormone. Panel B shows a histological section of mammary tissue from a heifer that was injected with BrdU 2 hours prior to tissue collection. Cells that have incorporated BrdU (indicating these cells were in the S phase of the cell cycle) have been detected by immunocytochemistry using a specific antibody. Several cells that were synthesizing DNA are indicated by the presence of dark granules over the cell nucleus. Panel A is adapted from Berry et al. (2003). Panel B is courtesy of Dr. Steve Ellis, Clemson University.
cheaply as possible. However, at a whole-body level, the integration of multiple organ systems ultimately explains the rate of growth and tissue composition of individual animals. It is also apparent that growth of all but the simplest life forms is irregular. All tissues do not grow the same rate or at the same times for that matter. Commonly observed changes in stature, degrees of fatness, or morphology (secondary sex characteristics, for example) are familiar when we consider aging. The evident differences in rates and patterns of growth among different tissues or organs are the essence of development.
Chapter 2
Table 2.5. Effect of colchicine on structural differentiation of mammary alveolar cells.
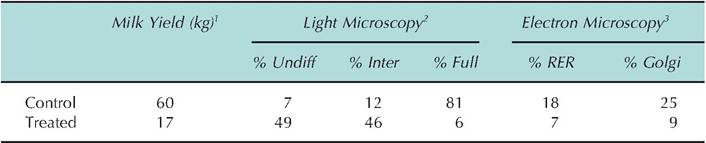
1MiIk yield is given as kilogram produced per udder half during week three postpartum.
2Light microscopy data are the percentage of epithelial cells classified as undifferentiated, intermediately differentiated, or fully differentiated.
3EIectron microscopy data is the percent of cellular area occupied by rough endoplasmic reticulum or Golgi membranes and vacuoles.
Data adapted from Nickerson and Akers (1983) and Akers and Nickerson (1983).
For many tissues, not only must new cells be created, but these cells must acquire the capacity to carry out specific functions. The changing growth and development of the mammary gland or uterus during the reproductive cycle provides excellent examples of cellular differentiation. Analysis of mammary tissue at the light microscopy level, especially if the tissue is embedded in a plastic resin (compared with more traditional paraffin), allows an estimation of the proportion of alveolar epithelial cells, which fall into various classes of structural differentiation. Table 2.5 gives data to illustrate how evaluation of cell differentiation can be physiologically relevant. In this experiment the effect of arresting cell growth and cell differentiation was studied. Two diagonal mammary glands of each of two pregnant Holstein heifers were infused with colchicine every second day from 1 week prior to parturition until calving. Twice-daily milking began at calving, and the drug treatment was discontinued. Data for mammary biopsies obtained on day 21 of lactation are given. Clearly, measures of mammary epithelial cell structural differentiation correlate well with function. In this experiment, treatment with colchicine during the period just before calving prevented the normal structural differentiation of the epithelial cells. This in turn markedly impaired the functioning of the mammary gland despite the fact that drug treatment was discontinued immediately after calving. The point of this is to illustrate how changes in cell differentiation are closely related to cell function.
Stages of the cell cycle
The cell cycle is a description of the events the cell undergoes from the time of its initial creation until it divides. However, there is a great deal of variation between cell types as to how quickly they progress through the cell cycle.
Some cells divide very rapidly indeed. For example, once stem cells of the immune system are activated, clones of lymphocyte cells can be generated in a matter of days. Other cells—for example, neurons—are believed to almost never divide. Although early Cytologists thought that cells that were not in the mitotic phase of development were inactive because of the absence of marked visual changes, this is not true. Cells without apparent mitotic figures or morphological changes were said to be in a resting or interphase period. It is now appreciated that these interphase cells carry out the normal functioning of tissues, for example, secretion of pancreatic enzymes or excretion activity of the kidney. The only "rest" at this time is from activities directly leading to cell division. As a general rule, once cells acquire their terminal functional activity, for example, many glandular epithelial cells, they effectively cease dividing and are referred to G0 cells. These cells are progressively degraded and lost but are replaced by the daughters of undifferentiated cells within the tissue. Dogma suggests that G0 represents a terminal state so these cells cannot be induced to return to a path leading to cell division; however, control of cell growth is an active area of research.For cells that are not terminally differentiated, the interphase period encompasses three subperiods. After the initial division to create the cell, it enters G1. During this time, the cells are metabolically active, rapidly synthesizing necessary proteins and creating new cellular organelles. However, the time that the cell spends in G1 can vary from a few hours in rapidly growing tissues to periods of weeks or even years. Once signals are produced to continue toward cell division, the cell enters the S or DNA synthesis phase. As G1 ends the centrioles begin to replicate. During the S phase, the cell DNA is replicated so that the cell produces new histones and chromatin so that it has two complete copies of each of the chromosomes. As indicated in our discussion of growth, incubating cells with radioactivity tagged thymidine and measuring the rate or degree of incorporation provides a valuable tool to study cell growth. This is because appreciable amounts of thymidine are only incorporated into cells that have entered the S phase of the cell cycle. Once duplication is completed, the cell enters G2. This is generally the shortest of the interphase periods, lasting only a matter of minutes. During this time the cells complete synthesis of enzymes and other proteins required for chromosomal migration, and the active process of mitosis is the last stage of the cell cycle. Figure 2.16 illustrates the sequence of stages in the cell cycle as well as changes in cellular DNA content during the cell cycle.
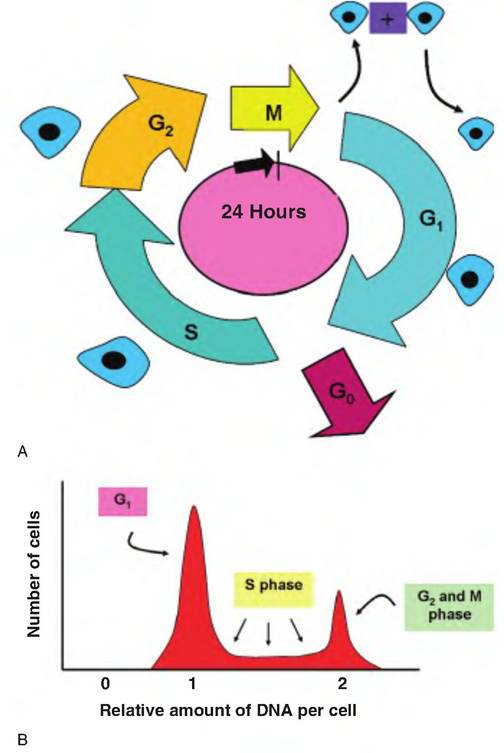
Fig. 2.16. Cell cycle analysis. A typical cell cycle is divided into four phases. Following division, the cell enters a phase called G1 (G = gap). In most cases, the cell undergoes hyperplasia at this time, and when appropriately signaled it passes into S phase for replication of the DNA. Notice the cell illustrated increases in size as it progressed through the cell cycle. Once synthesis is completed, the cell enters G2, which allows for completion of the final steps before the cell begins mitosis (M) and the creation of two daughter cells. Many cells can also enter a somewhat quiescent phase (G0) during which time the cell carries out usual functions but remains in a nondividing state.
Stages of mitosis
The pattern of cell division is virtually identical among all cell types. The process begins at the end of G2 as chromosome condensation becomes apparent and ends with cytokinesis, the physical separation of daughter cells into two independent cells. Simply stated, mitosis is a coordinated series of events that allows the duplicated DNA produced during the S phase of the cell cycle to be divided between two identical daughter cells. Once begun, mitosis typically lasts less than 1 hour. For this reason, in histological sections of most tissues, it is relatively rare to observe mitotic figures. Exceptions are in samples of very rapidly growing tissues, for example, tumors or perhaps the crypts of the small intestine. On the other hand, if rapidly growing tissues are treated with colchicine or some other microtubule-disrupting agent, the number of dividing cells will become more apparent since the cells become arrested in various stages of the mitosis. This has been especially useful for the study of cells grown in culture.
It is reasonable to ask how cells in different phases of the cell cycle can be identified and if the durations of phases are different for different cell types. Because cells require a period of time for growth, even the cells in rapidly developing tissues require several hours to complete the cell cycle. For many mature tissues, a cycle time of 16-24 hours is typical. An extreme example of short duration occurs in early embryonic cell growth. Because the cells spend little time in Gj or G2, cell hypertrophy does not occur, and the time spent in a combination of S and then M phase may be only a matter of 60 minutes or less. The rate of proliferation in these cells can approach rates usually only observed for bacterial cells. This process serves to essentially subdivide the fertilized oocyte into many smaller cells. As for tracking cells in phases of the cycle, those in S phase can be identified by supplying them with labeled molecules of thymidine (some DNA repair occurs even in nondividing cells). The label is often radioactive, in the form of 3H-thymidine, or chemical, in the form of BrdU, a synthetic analog of thymidine (see Fig. 2.15). Figure 2.17 outlines the events and stages associated with mitosis.
From microscopic study, the passage from the last period of interphase (G2) into prophase is gradual. Chromatin, which is relatively diffuse, begins to condense into recognizable chromosomes. In the prior S phase, the chromosomes were duplicated. In this new configuration, each chromosome is made up of two identical arms or threads called chromatids. Each chromatid pair is held together by a small, dense structure called a centromere. Newly duplicated centrioles separate in the cell to become polarized at opposite ends of the cell to create the spindle poles.
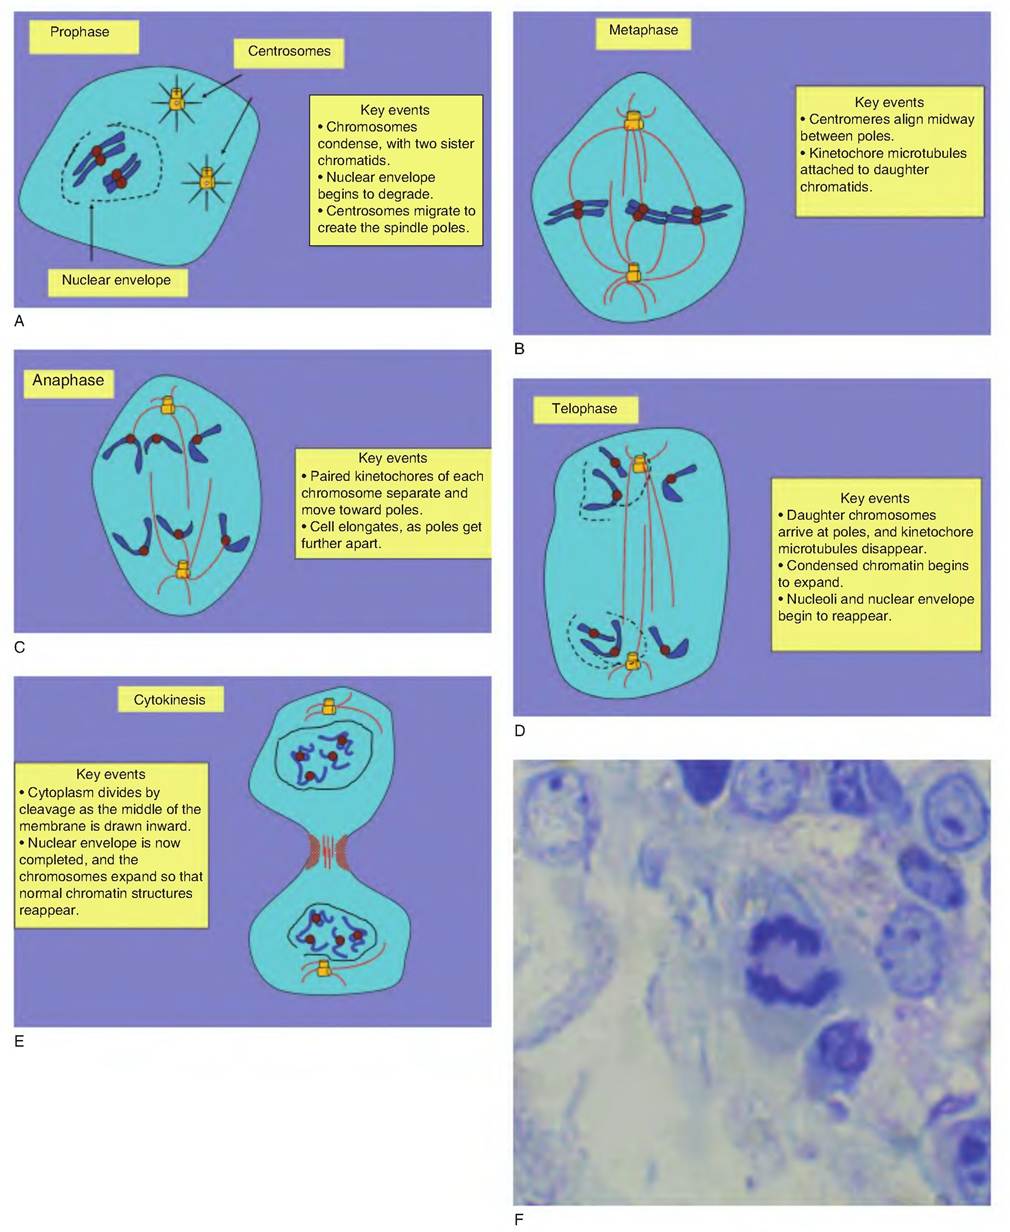
Fig. 2.17. Stages of mitosis. Mitosis is typically divided into five phases: (A) prophase, (B) metaphase, (C) anaphase, (D) telophase, and
(E) cytokinesis. These involve first the condensation of chromatin into chromosomes, formation of spindle pole, division and migration of daughter chromatids, and finally, cleavage to create daughter cells. Panel F in this figure shows a dividing mammary cell caught in anaphase.
This occurs as the nucleolus disappears and the nuclear matrix and envelope disassemble. As the chromosomes condense and become visually apparent, each of the polarized centrioles becomes a focal point for the creation of a new assembly of microtubules. This growth of microtubules mimics a starburst pattern and is aptly called aster formation. These events occur during early prophase. Late in prophase, elongating microtubules attach to protein-DNA complexes (Idnetochores) in the region of the centromere of each chromatid pair. The kinetochore microtubules are critical for the role they play in subsequent separation and migration of chromosome pairs. Other microtubules create the mitotic spindle to maintain the polar orientation of the centrioles. Metaphase is the next well-defined event in mitosis. It is characterized by the appearance of the chromosomes aligned along the center or equator of the spindle. The organization of chromosomes in a plane between the poles is called the metaphase plate creation and is one of the more distinct, readily recognizable phases of mitosis.
Sudden separation of the sister kinetochores identifies the start of anaphase. Within minutes, each of one chromatid pair (now called a chromosome) is pulled to one of the spindle poles. The arrival of all of the daughter chromosomes at each pole and dissolution of the kinetochore microtubules marks the beginning of telophase. Remaining polar microtubules elongate, a new nuclear envelope coalesces around each polarized cluster of chromosomes, and the compacted, dense chromatin expands and nucleoli reappear. The final stage of mitosis, cytokinesis, is characterized by the appearance of a cleavage furrow between the cells. This narrows, and finally, the remaining elements of the mitotic spindle are broken, and two independent cells are created.
Regulators of cell division
It is difficult to study the details of cell division and especially regulation in intact tissues or whole animals. Thus, much of the detailed understanding has come from cell culture experiments. When normal mammalian cells are maintained in culture, they usually can only be propagated for about 50 cell divisions. After this, the cells enter a senescence period and eventually die. Despite the obvious limitations, the study of culture cells has been scientifically invaluable.
Mammalian cells were first cultured in clotted blood, and for many years, efforts to routinely grow cells in culture failed, despite efforts to supply well-recognized nutrients. Cells could be maintained only if serum was included with the nutrients. In the absence of serum, cells would typically stop growing and become arrested in G0. It is now known that serum supplies critical GFs, and even now, for routine growth of cells, fetal bovine serum is often added to cell cultures. Platelet-derived growth factor (PDGF) was one of the first GFs discovered. Like many GFs, its existence was hypothesized from effects observed with cells in culture. Specifically, it was found that fibroblasts would proliferate in culture if serum were added but not with addition of plasma. Since serum is the liquid that remains after the blood clots, this suggested that the clotting process liberates a soluble agent from the blood cells or platelets that are contained within the clot. Subsequent experiments showed that extracts prepared from isolated platelets were also able to stimulate growth of fibroblasts. These observations eventually lead to the isolation, purification, and identification of PDGF In a physiological sense, it is easy to visualize a role for PDGF in wound healing. With clot formation following an injury, liberation of PDGF at the site acts to stimulate the proliferation of fibroblasts in and around vessel walls. Since fibroblasts synthesize and secrete collagens, their role in healing and scar tissue formation is obvious. More than 50 proteins are now known to function as GFs. However, it is important to appreciate that not all cells respond to this entire myriad of possible stimulators. Only those cells that express receptor proteins for a given GF are capable of responding. However, it is also possible to crudely divide GFs into those that affect a broad spectrum of cells, for example, insulin-like growth factor one (IGF-I), from those that impact only a specific population of cells, for example, erythropoietin, which causes proliferation of red blood cell progenitor cells. We will discuss some of these specific GFs in subsequent chapters.
Regardless of external agents that act to initiate cell division, this must involve the activation of specific genes that control DNA synthesis. Cell-cycle control relies on two classes of proteins. The first, cyclin- dependent protein kinases (Cdk), cause phosphorylation of selected enzymes. As we will see in our study of cell metabolism, a general feature of many regulatory proteins is that either adding or deleting phosphate groups dramatically alters function. The second class of proteins, the cyclins, bind to the Cdk proteins and thereby regulate their enzymatic activity. Cyclins get their name from the fact that they undergo a cycle of synthesis and degradation with each cell division. This means that the periodic assembly, activation, and disassembly of cyclin-Cdk complexes are critical elements in cell proliferation. As with most cellular activities, understanding the details of gene expression is central to understanding cellular function; for cyclins, it is easy to visualize the significance of synthesizing these proteins at just the ideal moment during the cell cycle. Conversely, inappropriate synthesis or failure of disassembly is likely important when cell growth becomes uncontrolled, that is, in tumor formation.