Cell signaling
The complex interface between the nervous and endocrine systems continues at the cellular level. You have already learned that many neurotransmitters act by binding to receptors on the surface of postsyn- aptic cells.
These binding reactions ultimately induce a biochemical process in the target cells that, if sufficient, causes the generation of an action potential in that cell.A substance that binds to a receptor is called a ligand, for example, when insulin binds to its specific receptor on the surface of liver cell. However, this can become complicated. If we stick with the insulin family, there are other hormones called insulin-like growth factors, that is, insulin-like growth factor one (IGF-I) and insulin-like growth factor two (IGF-II). Based on the names you would likely suspect that these growth factors must have some attributes that are similar to insulin. You would be correct. These molecules have similar but not identical structures. This means that insulin can also bind to specific IGF-I receptors on target cells. However, this is usually not physiologically important because the affinity (a measure of how easily the binding occurs) of the binding is much less than for IGF-L You can envision the relevance of affinity this way: a ligand with high affinity for a receptor occupies a greater proportion of the receptors at a much lower concentration than if the ligand for the receptor has a low affinity for the receptor. Does this have practical significance? The answer is absolutely yes.
For example, at normal circulating concentrations, insulin molecules would rarely interact with an IGF-I receptor. However, with diabetes or other situations when insulin concentrations are chronically increased, the greater abundance of insulin molecules can "overcome" the fact that insulin has low affinity for the IGF-I receptor.
As another example, many synthetic steroids have been engineered so that they have greater affinity for receptors than the native molecule, that is, testosterone versus synthetic anabolic steroids.The classic definition of a hormone is as follows. A hormone is a signaling molecule that is secreted by a ductless (endocrine) gland into the bloodstream where it travels to a site some distance away and acts on a target cell. Except for the transport period in the bloodstream, this pattern is not different from that of regulators that are secreted into the extracellular fluid to act on target cells only a few millimeters or micrometers away from the site of production. At the mechanistic level, there are many parallels between the effects of neurotransmitters, classic hormones, and growth factors. Indeed, as understanding has evolved, it is now recognized that many growth factor-, hormone-, or neurotransmitter-like molecules can impact target cells at multiple levels.
For example, a paracrine action refers to a molecule released from a signaling cell that acts to impact neighboring cells. An example of this is the production of IGF-I by stromal cells of the mammary gland. This growth factor subsequently stimulates the epithelial cells of the adjacent mammary ducts or alveoli. Autocrine stimulation indicates that the signaling molecule impacts the same cells that produced the molecule. Juxtacrine refers to the stimulation of immediately adjacent cells.
Both neurotransmitter and peptide hormones interact primarily with receptors located in the plasma membrane of the target cells. For these regulators, this means that this binding event triggers biochemical changes inside the target cells that are responsible for the hormone effects that are observed. Since the hormone or ligand does not enter the target cell, this pattern of action is known as a second messenger mechanism. In other words, the hormone binding to the receptor is the "first" messenger and the biochemical mediator released inside the target cell is the "second" messenger.
Our goal is not to overwhelm you with details, but we think it is important to have some appreciation of the various biochemical pathways that are involved in explaining how surfaceacting hormones function. We begin by illustrating some of the types of surface receptors.As shown in Table 12.1, based primarily on structure, these receptors (remember they are all proteins) can be grouped into the four classes. Seven-transmembrane- domain receptors are one of the largest groups. These receptors all contain an amino terminal piece or domain followed by seven hydrophobic segments that form loops that span the plasma membrane. The last of the seven loops ends in a hydrophilic domain that protrudes into the cytoplasmic portion of the cell. So you can imagine a bit of the receptor protein at the outer surface of the cells and a bit protruding into the cytoplasm of the cell. Most of these receptors rely on the activation of G proteins to elicit their effects. Examples of these receptors include those for PTH, luteinizing hormone (LH), and melanocyte-stimulating hormone (MSH).
A second class of receptors is single-transmembrane domain receptors. These receptors span the plasma membrane and have intrinsic tyrosine kinase activity; in other words, the binding of the ligand to receptor activates enzyme action. Do you recall that kinases are involved in phosphorylation reactions? This group
Table 12.1. Major structural classes of surface-acting receptors.
Seven-Iransmenbrane domain receptors
Aclrenocortotropic hormone (ACTH)
β adrenergic
Glucagon
Growth hormone releasing hormone (GHRH)
Luteinizing hormone (LH)
Melanocyte-Stimulating hormone (MSH) Parathyroid hormone (PTH)
Thyroid-stimulating hormone (TSH)
Thyrotropin-releasing hormone (TRH)
Single-transmembrane receptors
Epidermal growth factor (EGF)
Insulin
Insulin-Iike growth factor one (IGF-I)
Platelet-derived growth factor (PDGF)
Cytokine receptor superfamily
Erythropoietin
Growth hormone (GH)
Interleukins
Leptin
Prolactin (PrI)
Guanyl cyclase-linked receptors
Natriuretic peptides
includes insulin, IGF-I, epidermal growth factor (EGF), and others.
A third group is structurally similar to the second but the receptors have no intrinsic tyrosine kinase activity. Instead, functional activity depends on ligand binding, causing the activation of soluble transducer molecules located in the cytoplasm. In this case, ligand binding causes molecules in the cytoplasm to interact with the receptor, which then produces a cascade of reactions. Receptors for prolactin (Prl) and growth hormone (GH) are examples of this type of receptor.
A fourth group acts via guanylyl cyclase or adenylyl cyclase and synthesis of cGMP or cAMP, respectively. Epinephrine, for example, binds to its surface receptor and in conjunction with a stimulatory G protein activates adenylyl cyclase, which causes the conversion of ATP to cAMP. This pathway was the first example demonstrating the second messenger mechanism of hormone action. Figure 12.1 provides a schematic view of the structural variations between these types of surface receptors.
Mechanisms of cell surface hormone signaling
In addition to classification based on structure, receptor proteins for hormones, growth factors, and neurotransmitters are also classified by the signal transduction method that is employed. lon-channel-linked receptors are common in the nervous system and are involved
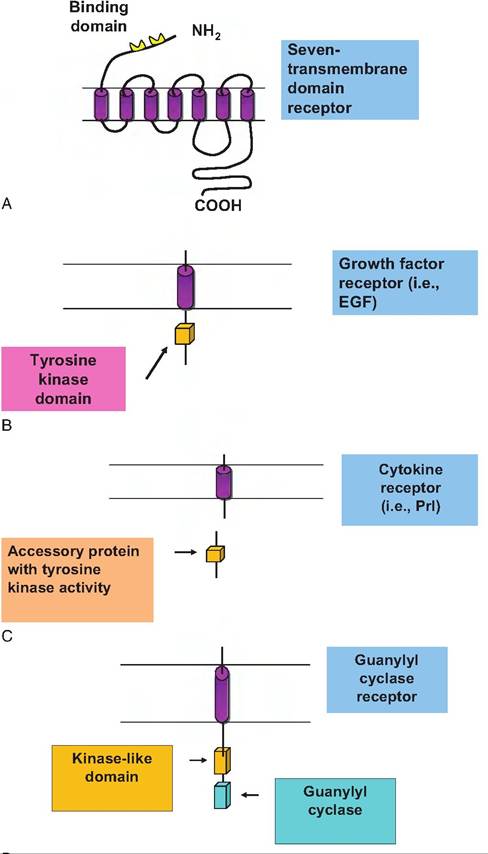
Fig. 12.1. A schematic view of the structural variations between types of cell surface receptors. From the top to bottom are illustrations of (A) a seven-transmembrane domain receptor, (B) a single-transmembrane domain receptor with kinase activity typical of many growth factors, (C) receptors with no intrinsic tyrosine kinase activity but activation by soluble transducer molecules, and (D) receptors dependent on guanylyl cyclase or adenylyl cyclase and synthesis of cGMP or cAMP.
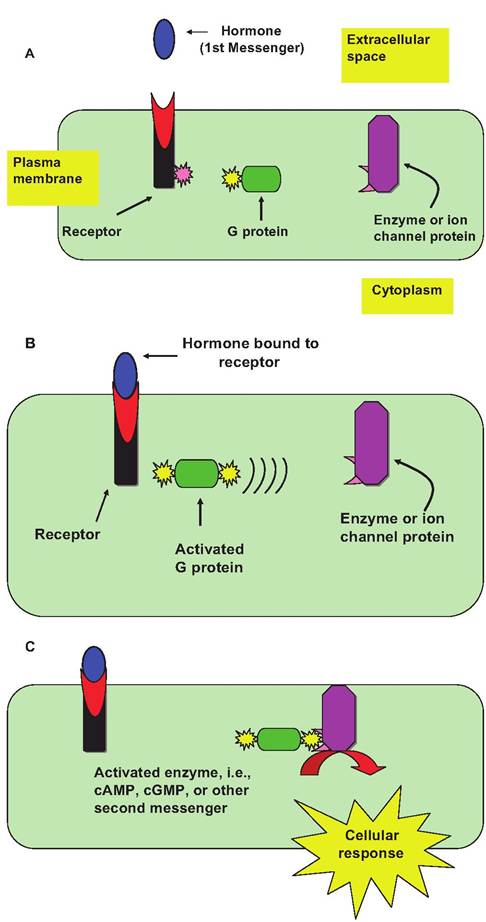
Fig. 12.2. Example of a G-protein linked hormone mechanism of action.
Activation of the receptor is induced by the binding of hormone (first messenger) (panel A). This leads to a conformational change in the cytoplasmic tail of the receptor to allow binding of a complementary G-protein and activation (panel B). This activated complex links to a second membrane-bound protein (enzyme or ion channel) to increase the intracellular concentration of an intracellular mediator (second messenger), which is responsible for the effect associated with hormone action (panel C).in rapid signaling, usually between electrically excitable cells. G-protein-linked receptors function by modifying the activity of a separate plasma membrane- anchored protein, which may be an enzyme or may act as an ion channel. Briefly, interaction between the receptor and the anchored membrane protein is mediated by the action of a third protein, a trimeric GTP- binding protein (G protein). If this target protein is the enzyme type, activation alters the concentration of an intracellular mediator (e.g., cyclic GMP, cyclic AMP, diacylglycerol, or inositol triphosphate). It should be understood that G protein hormone-mediated effects can be inhibitory or stimulatory. The illustration in Figure 12.2 depicts a response if a stimulatory G protein variant (Gs) is activated in response to hormone binding. The result is an increase in the intracellular concentration of a second messenger molecule.
Let's suppose, however, that the illustrated target cell also has receptors for another hormone whose effect is mediated by an inhibitory G protein variant (Gi) and that the second messenger molecule is the same. In this case, hormone binding to the receptor would activate Gi with the effect of inhibiting the production of the second messenger. This suggests that the overall response of the cell to these two hormones would depend on the relative concentration of the two receptors on the cell surface and ratio of circulating concentrations of the two hormones in the blood available to interact.
This possibility is illustrated in Figure 12.3.As Figure 12.3 suggests, complex interactions control the concentrations of even a single second messenger molecule in target cells. Just imagine the possible control points. Using this illustration as an example, what regulates the rate of synthesis of G proteins or the rate at which cAMP molecules are degraded? What about the rate of synthesis of the adenylyl cyclase enzyme or expression of the receptor subtypes? On the other side of the coin, how many molecules of the hormones are available in the blood to bind to the receptors on the cell surface? Overlap in signaling pathways, changes in secretion of hormones, and alterations in expression of cell receptors provide many opportunities for regulation of cell response to hormones or growth factors.
Common membrane enzymes regulated by G proteins include adenylyl cyclase and phospholipase C. Changes in activity state of adenylyl cyclase depend on Gs or Gi proteins to influence capacity of the enzyme to convert ATP to cyclic AMP (cAMP). Cyclic AMP binds to a cytosolic protein, cyclic AMP dependent protein kinase (A-kinase). This allows regulatory protein (subunits) to detach from inactive A-kinase. These active enzymes cause phosphorylation of proteins unique to particular target cells. These phosphorylated proteins have potent biochemical effects, including activation of other enzymes or gene activation.
Other G proteins function by activating (or inhibiting) the inositol phospholipid-signaling pathway. Effects are initiated by hormone receptor binding, which allows binding to an inactive G protein. Binding of GTP displaces GDP and the G protein is activated. Activated G protein translocates within the plasma membrane and activates phospholipase C (PLC). PLC cleaves the phospholipid phosphoinositol 4,5-bisphosphate (PIP2) to yield diacylglycerol (DAG) and inositol 1,4,5 triphosphate (IP3). DAG activates specific protein kinases and IP3 triggers the release of Ca2+ ions. Increased Ca2+ stimulates activity of specific enzymes, thus acting as a second messenger, or it binds the regulatory protein calmodulin.
Other binding reactions lead to the activation of gua- nylate cyclase. This enzyme catalyzes the conversion
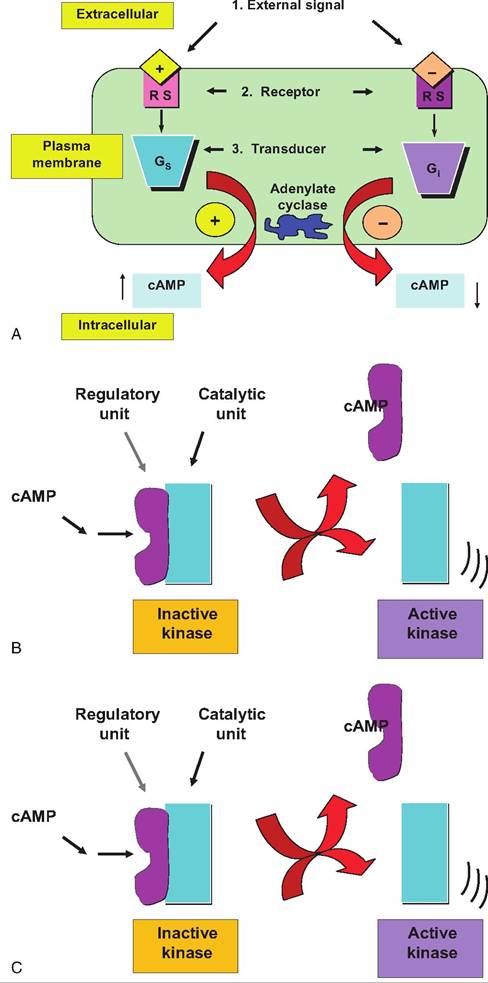
Fig. 12.3. Stimulatory versus inhibitory G proteins. In this example the target cell expresses receptors for two hormones, both of which impact the synthesis of the second messenger cyclic AMP.
However, one induces the activation of a stimulatory G protein (Gs) and the other an inhibitory G protein (Gi). This suggests that the balance between the actions of these two antagonistic pathways controls pathways affected by cAMP abundance. What would you predict if the expression of receptors for one of the hormones suddenly tripled? The lower portion of the figure illustrates a possible model for activation of a kinase enzyme with increased free cAMP concentrations. The cAMP binds to a regulatory subunit allowing the catalytic subunit to phosphorylate its substrate protein. Changes in phosphorylation state can either stimulate or inhibit the actions of the target protein (depending on the particular protein).
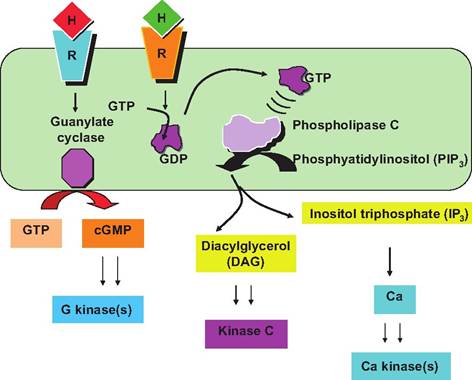
Fig. 12.4. Phospholipase C signaling pathways. A variety of second messengers DAG, IP3, and Ca can be produced by factors that stimulate phospholipase C in the plasma membrane.
of GTP into cyclic GMP (cGMP), which can act as a second messenger like cAMP. Some of these other second messengers are illustrated in Figure 12.4. To finish our discussion of G proteins, if the target protein acts as an ion channel, activation acts to change permeability of the membrane for that ion. The G protein- linked receptors make a very large family of surface receptors, including the oxytocin receptor we discussed earlier related to the milk ejection reflex.
A third class of surface-acting signaling molecules is the enzyme-linked receptors. Essentially, the binding of the hormone to the receptor activates the receptor (or directly linked protein) so that it capable of phosphorylating cellular proteins. Phosphorylation alters activity of the affected protein. Some agriculturally relevant signaling molecules include the mammary active regulators IGF-I, insulin, EGF, and vascular endothelial growth factor (VEGF); these are all examples of tyrosine-specific protein kinases (Butler et al., 1998; Adams et al., 2000).
To illustrate some of the cellular and molecular detail of these receptor types we focus on the interaction of IGF-I and its receptor. This is because IGF-I is an excellent example of a receptor kinases. Secondly, IGF-I is important in animal agriculture and medicine. IGFs are intimately tied to normal development (muscle growth, mammary growth, and reproduction), diabetes, and some cancers. In animal agriculture, growth is critical, and use of GH as a tool to increase milk production and development is also linked to IGFs (Akers, 2006). Figure 12.5 illustrates an example of one of these receptor types, specifically the insulin and insulin-like growth factor receptors.
IGF-I and IGF-II regulate cell growth, cell differentiation, maintenance of cell function, and prevention of apoptosis. Research with IGF-I and IGF-II was initially centered on the somatomedin hypothesis, which proposed that these two growth factors mediated somatotropin (GH) effects on postnatal growth. Since those early experiments, the view has evolved that the IGFs are also important local actors. These peptides can interact with several related cell surface receptors. The primary signaling receptor for IGF-I (IGF-IR) is a tyrosine kinase receptor structurally similar to the insulin receptor. Members of this family of proteins share a hetero tetrameric structure. IGF-IR binds with IGF-I with high affinity (Kd ~ InM), but affinity for insulin binding is about 500 times lower.
IGF-II binds with high affinity to a receptor that is identical to a receptor for mannose-6-phosphate, but the receptor has no known intracellular signaling function. The affinity of this receptor for IGF-I is about 100-fold lower than for IGF-II and it does not recognize insulin.
For IGF-I binding to its receptor to be effective, two cellular processes must come together. First, the binding reaction must transmit a signal through the plasma membrane to regulatory molecules located on the cytoplasmic face of the membrane. Second, a signal is needed to cause localization and interaction of the internal receptor domain with downstream effector molecules of the signal transduction cascade. Activation of IGF-IR produces intracellular molecules that mediate at least four distinct, but overlapping, signaling pathways. This likely explains multiple effects linked to IGF-I activation reported in various cells types or in the same cell type under differing physiological conditions.
In addition to receptors and the intracellular signaling cascade, there are also six IGF-I binding proteins (IGFBPs) and nine related proteins (IGFBP-rP) that affect the actions of IGF-I (Clemmons, 1998).
Mechanisms of action for prolactin (Prl) and growth hormone (GH), two protein hormones with long- recognized importance in growth and development and mammary function, have only recently been elucidated. Prolactin receptor (PrlR) and growth hormone receptor (GHR) are simple proteins with a single transmembrane domain. The hormone has two sites capable of binding to its receptor protein. Initially the hormone binds (site 1) to create an inactive complex. This hormone-receptor complex then diffuses within the membrane to bind with a second receptor (site 2). This causes receptor homodimerization and formation of an active complex (Fig. 12.6). Although it had been known that stimulation with Prl or GH caused tyrosine phosphorylation of a number of cellular proteins, the cytoplasmic domains of the receptors have no inherent enzymatic activity. This means that hormone binding and dimer formation must activate other kinases. A breakthrough came with the discovery of
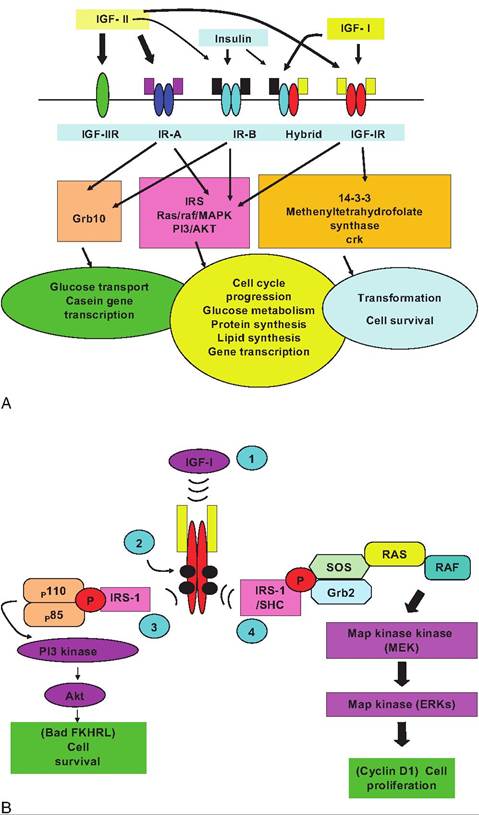
Fig. 12.5. Diagram of components of the insulin and IGF family of proteins and receptors. The upper portion illustrates binding of IGF-I, IGF-II, and insulin to related receptors. The thickness of the arrows varies with affinity of binding. The center of the figure indicates phosphorylation signaling cascades linked to binding of ligands to different receptors. The bottom panel shows cellular events most closely related to receptor binding, but the overlap in binding, signaling, and response is also apparent. The example is on activities in mammary tissue, but similar responses also occur in other tissues. Panel B illustrates some of the details of the signal transduction pathways for IGF-I. Of course the process is initiated by binding of IGF-I to its receptor (1); this leads to autophosphorylation of the tyrosine residues of the β subunits of the receptor (blacked circles). This phosphorylation cascade allows for binding of IRS proteins (3) and their phosphorylation. This change makes available binding sites for recruitment of other intracellular signaling molecules (i.e., the p85 and pl 10 subunits of PI3 kinase), resulting in enzymatic activity that converts membrane-bound lipids like 3,4 inositol phosphate into active second messenger molecules (inositol triphosphate). These molecules combine with phosphoinositide-dependent kinase-1 to activate AKT. AKT signaling is linked with IGF-I stimulation of protein synthesis. PI3K-linked signaling is associated with inhibition of apoptosis (as described in the text) as well as IGF-I stimulation of glucose transport. In addition to this pathway, IRS-1 with SHC bind to the receptor and are phosphorylated as well (4). Activation of MAPK (mitogen-activated protein kinase) signaling proceeds through recruitment of a complex composed of Grb2 and son of sevenless (SOS), which is recruited from the cytoplasm to the cell membrane. This allows SOS to come in close position to RAS (a GTP-binding protein named for the RAS gene first identified in viruses that cause sarcoma in rats). This catalyzes a RAS GTP/GDP exchange. This then activates RAF kinase, which in turn activates MAPK or MEK1. Targets of this cascade include members of the Ets and forkhead transcription factor families. Regulation ultimately of these transcription factors explains how IGF-I binding to its receptor can produce alterations in gene expression that modify proliferation, differentiation, and apoptosis in target cells. Figures are adapted from Hadsell and Bonnette (2000), Hadsell et al. (2002), Clemmons and Maile (2003), and LeRoith and Roberts (2003).
Janus tyrosine kinase 2 (JAK2) appearing after receptor dimerization. This kinase belongs to a family with four members, JAKl, JAK2, JAK3, and Tyk2, each of which act in signaling of various cytokine receptors. For PrlR and GHR, JAK2 is especially important. With PrlR, JAK2 is constitutively associated with the receptor but with GHR the enzyme associates with the receptor only after hormone binding and dimer formation (Goffin and Kelly, 1997; Hynes et al., 1997).
The signaling pathway depends on JAK2-induced phosphorylation of a transcription factor called signal transducers and activators of transcription (STATs). One of these, STAT5, is specifically for Prl stimulation of the casein gene expression in mammary tissue.
It is sometimes easy to dismiss these detailed biochemical studies as esoteric. However, basic information derived from studies of our domestic species will yield techniques to improve the control of growth and performance of our animals in unexpected ways. This is a very complex and important area of research. Our goal is not to overwhelm you with details of cell signaling, but to give you an appreciation of the intricate, even elegant myriad of controls that are possible in regulation of hormone and growth factor action after they bind to their respective receptors.
Mechanisms of internal hormone cell signaling
Hormone receptors (steroid hormones, thyroid hormones, retinoic, and vitamin D), adapted orphan receptors (peroxisome-proliferator-activated receptors PPAR Jcz, β∕δ, and γ], Liver X receptors Jcz and β] and retinoid X receptors Jez, β, and γ]), orphan receptors, and other nuclear receptors serve to activate functions linked to a plethora of structurally diverse, small, hydrophobic molecules that pass across the plasma membrane of target cells to act internally. Activated receptors for these agents, that is, those bound by ligand, act essentially as transcription factors.
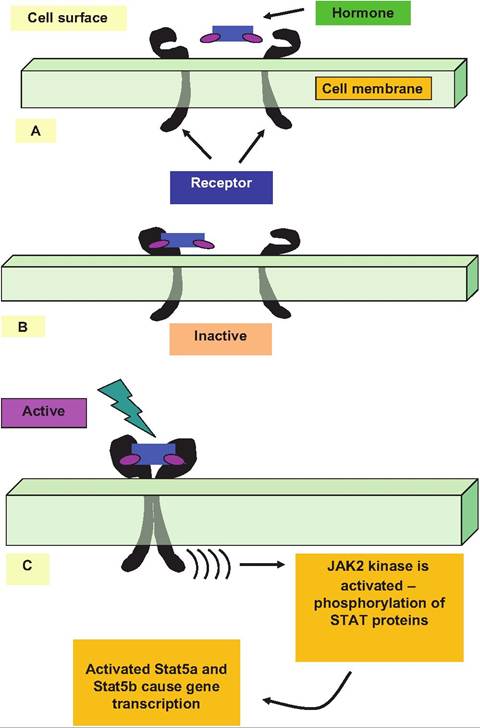
Fig. 12.6. Ligand-induced receptor homodimerization. The hormone first binds with the receptor to create an inactive complex (A). Binding with a second receptor produces a dimer (B). This produces an activated complex (C). The active complex stimulates JAK2 kinase, which phosphorylates Stat proteins. As a dairy example, Stat5a and Stat5b are closely involved in Prl stimulation of milk protein gene transcription. Receptor activation can also stimulate other signaling pathways, including mitogen-activated protein (MAP) kinase and protein C kinase (PKC).
These receptors constitute a complex of at least 48 members that are involved in a myriad of functions, including hormone signaling, cell differentiation, and cell metabolism (Kurakula et al., 2013). The receptor proteins for these hormones and agents have a hydro- phobic region near the C-terminal end of the protein that binds directly to the hormone. A more hydrophilic domain of the receptor binds to DNA when the hormone-receptor complexes translocate to the nucleus. These segments of the receptor proteins are homologous between the various receptors. Specifically, there are nine highly conserved Cys residues that occur in Cys-X-X-Cys sequences, the so-called zinc-finger arrangement. Binding releases associated proteins called chaperones so the newly formed hormone-receptor
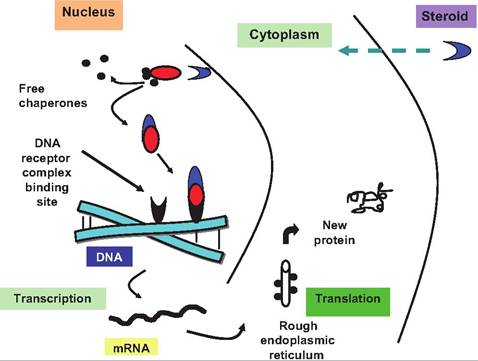
Fig. 12.7. Steroid hormone mechanism of action. The hormone diffuses into the nucleus and binds to a receptor-chaperonin complex. Binding allows the chaperone proteins to dissociate and the activated hormone receptor combination binds to specific sites on the DNA. This triggers the transcription of certain genes and production of new mRNA. The new mRNA is translated and new proteins are made. These new proteins are responsible for the biological effects of the hormone.
complex can attach to a specific region of the DNA. This association allows transcription of the gene(s) adjacent to this binding site. Thereafter, transcription of the specific gene(s) occurs and the new mRNA is processed and transported to the ribosome for translation. These newly minted proteins are responsible for the hormone effects observed (Fig. 12.7). A reasonable view is that steroid hormone family receptors are essentially ligand-activated transcription factors. A general rule is that responses to these hormones are slower than for the surface-acting peptides.
However, evidence for extracellular or surface actions for steroid hormones includes reports of specific binding of radiolabeled steroid hormones to cell membranes and very rapid response that can occur following addition of steroid hormones to target cells. For example, testosterone rapidly stimulates transport of glucose, calcium, and amino acids into kidney cells. There is also evidence for binding of steroid hormones to gamma amino butyric acid (GABA) receptors in nerve cells and associated rapid changes in ion flow into the cells. At least one G protein-linked receptor (GPR30) that is activated by estrogen has been identified. Indeed, it appears to explain a part of the resistance to the antiestrogen tamoxifen that occurs in some breast cancer patients (Ignatov et al., 2012). Thus, some effects linked with steroid hormone action may well depend on surface actions (Levin, 2011). The point here is to remind you that endocrine research is rapidly expanding, so it is foolish to make dogmatic conclusions about hormone mechanisms of action. New findings and discoveries are continually being incorporated into our understanding.
Estrogen, progesterone, cortisol, triiodothyronine (T3), retinoids, and others are potent stimulators of target cells in domestic animals. Effects of a variety of steroid family hormones will be discussed in subsequent sections as well as in other chapters. The essential feature of this section is to emphasize the primary differences in the mechanism of action for surfaceacting versus other hormones.
Receptors and regulation
As you have surmised from your reading to this point, controlling the actions of hormones and growth factors is critical in homeostasis. Alterations in internal cell signaling are important but it is also important to appreciate general factors that affect the ability of hormones to function. Hormones elicit their biological effects by binding with high-affinity receptors. Ligand binding to its receptor is governed by the law of mass action (illustrated in the following).
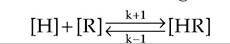
In this expression, [H] is the hormone concentration, [R] is the receptor concentration, and [HR] is the concentration of the hormone-receptor complex; k + 1 and k - 1 are rate constants for creation and dissolution of the [HR] complex, respectively. At equilibrium conditions, these terms can be written as shown here:
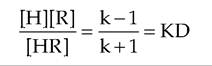
KD is the equilibrium dissociation constant that describes the affinity of the ligand-receptor interaction; that is, the lower the value of the KD, the higher the affinity. In practical terms, high affinity means that low concentrations on the ligand (hormone or growth factor) are sufficient to bind to the receptor. On average, when the concentration of the hormone is equal to the value for the affinity of the receptor, 50% of the receptor will be bound. Typical affinity estimates for common receptors are in the range of 10 '' to l(T10M∕L. For example, the affinity of prolactin receptor for membranes of mammary cells is about 2 ? 10 'j∖4∕L. A concentration of 50ng∕mL is approximately equal to the affinity value. This is relevant because normal blood (basal) concentrations range from 5ng∕mL to 75ng∕mL. So the affinity of the receptor ensures that normal circulating concentrations prolactin can effectively impact target cells.
You might ask how it is possible to measure the affinity of various receptors for their hormone ligands or to measure very low-circulating concentrations of hormones. As is often the case, technology advances were critical. Soon after techniques were developed for the radiolabeling of hormones, it became clear to a number of researchers that measuring the amount of isotope bound to a target tissue, cells, or cell fractions could be used to estimate the number of receptors. Radiolabeling refers to the incorporation of a radioactive isotope into the structure of the hormone. For proteins, iodine is the most common isotope used for this purpose. Analogous to thyroid hormones that have dietary iodine incorporated into the ring structure of their tyrosine amino acids, test tube reactions are used to chemically incorporate radiolabeled iodine. If this is done using either I125 or I131 isotopes of iodine, the protein is effectively labeled or tagged. Assuming the protein is still biologically active, that is, that the site where the iodine molecule incorporated does not impair the binding reaction, the newly labeled protein can be used to measure the quantity of receptor in a tissue or cell preparation. This is typically done by allowing the iodinated hormone (called hot or tracer) to bind and then in parallel tubes adding an excess of nonradiolabeled (cold) hormone. The difference in binding of isotope between samples with and without the competing cold hormone is a relative indicator of receptor number. Figure 12.8 is an example illustrating prolactin receptor binding in the membranes from the ovine mammary gland.
In this example, a series of tubes all containing equal amounts of cell membrane suspended in buffer were incubated with the same quantity of radiolabeled hormone (64,500 cpm [counts per minute] per tube equal to Ing). Notice in the absence of competition that the membranes bound about half of the total
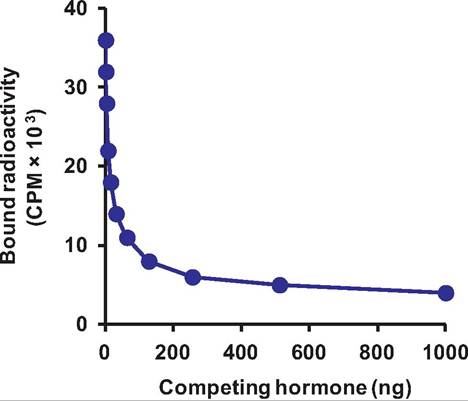
Fig. 12.8. Receptor assay. In this example, increasing concentration of ItonracIioIabeIecI prolactin (competing hormone) displaces binding of radiolabeled prolactin to receptors on cell membranes prepared from mammary glands of lactating sheep.
added, -38,000 cpm. Sets of tubes then received increasing quantities of cold hormone (noniodinated) ranging from 0 (total binding tubes) to 512ng per tube. The data presented are the average of three samples at each concentration. After a period of time to reach, the tubes were centrifuged. The membrane formed a pellet in the bottom of the tube and the liquid was removed. The amount of radioactivity remaining in the pellets was then measured by placing the samples in a gamma counter. This machine measures the amount of radioactivity in cpm. As you can see, addition of increasing amounts of cold hormone displaced about 90% of the bound radioactivity once the hormone concentration reached about a 100-fold excess (-100 ng) compared with the quantity of radio- actively labeled material added. Notice that adding greater quantities of cold hormone has very little further effect. The radioactivity that cannot be competed away even in the presence of excess cold is called nonspecific binding. The radioactivity that is displaced (specific binding) reflects the number of receptor molecules in the sample. In addition, if displacement is studied using either a graded concentration of cold displacement or a saturation of binding using known graded increasing concentrations of tracer, it is possible to calculate the affinity of the binding reaction as well as estimate the number of receptors.
Specifically, if it is assumed that total receptor concentration R0 = [HR] + [R], the equation given earlier can rearranged to give the following expression:
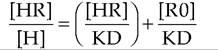
This is the Scatchard equation, which provides that when the ratio of bound over free ligand ([HR]∕[H]) is plotted against bound ligand concentration ([HR]), the slope of the line is defined by -1 / KD, the !/-intercept by RO/KD and the x-intercept by R0. These computational methods, based on knowledge of bound and free concentrations of hormone determined experimentally, give information about the apparent affinity of the receptor and the total concentration of receptors in the preparation. Examples of a saturation curve and Scatchard plot are illustrated in Figure 12.9.
In practice, the affinity of a given receptor for its ligand is generally stable; however, the number of receptors can vary dramatically in response to treatments or physiological status. Thus, a major mechanism for regulating the effects of a hormone or growth factor is to alter the number of target cell receptors that are synthesized. This is really fundamental when you consider the initial equation describing the law of mass action given earlier in the chapter. If the number of available receptors is reduced, and the hormone concentration stays the same, the number of hormone-
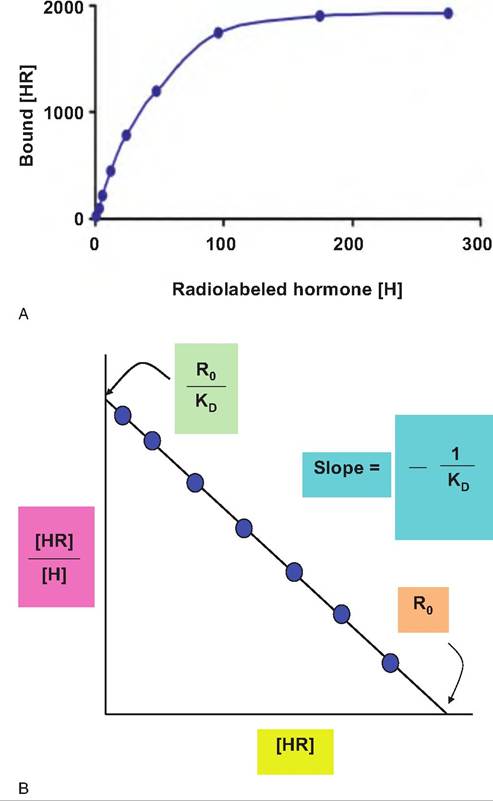
Fig. 12.9. Saturation binding and Scatchard plot. A hypothetical ligand saturation curve (upper) and Scatchard analysis of receptor binding (lower) is shown. The Kd represents the dissociation constant, RO the total receptor concentration and [HR] and [H] concentrations of the bound and free ligand, respectively.
receptor complexes that can be formed is correspondingly reduced. This also suggests that changes in the other element of the equation, hormone concentration or [H], are also important in determining responsiveness. Indeed, circulating concentrations of many hormones are dramatically altered with time or in response to physiological stimuli. For example, in monogastric species, consumption of a meal high in carbohydrates stimulates the secretion of the hormone insulin. This means that the capacity of insulin to drive glucose into storage is improved because of the increased blood concentration. Even if the concentration of insulin receptors is not changed, the effect of insulin is enhanced; this is the essence of the law of mass action. With more insulin, the odds of generating the [HR] complexes are improved. As time passes, the
peak in insulin concentrations decreases, so its effect is diminished because of reduced receptor binding.
To summarize, not only are there complex changes in signal transduction pathways that modify hormone responses, but changes in hormone receptor number or hormone concentration also modify effectiveness. A change in the number of receptors can result from the synthesis of more hormone receptors, that is, more mRNA, transcription, and translation, or in some cases by simply making available receptors that were previously unavailable. Such receptors might be bound to other proteins that mask the hormone-binding site. If this inhibitor is removed, the number of available hormone receptors is increased and, everything else being equal, response to the hormone is enhanced. As we discuss specific endocrine organs we will provide some examples of changes in receptor number that correspond with alterations in function.
One common response to prolonged increases in circulating concentrations of a particular hormone is receptor downregulation. This is essentially a homeostatic response to prevent overstimulation. These mechanisms are vital but not foolproof. For example, hypersecretion of growth hormone prior to puberty can lead to gigantism but after puberty, acromegaly can occur. In some breeds of beef cattle, large size and muscle development are at least partially attributed to alteration in the growth hormone-insulin-like growth factor axis. This suggests there has essentially been genetic selection for what was initially a mutation in growth control.
In other cases, increased secretion of a hormone stimulates the synthesis of other hormone receptors. For example, late in gestation, as parturition approaches, circulating concentrations of estrogen increase. This produces increased synthesis of oxytocin receptors in the uterus. This adjustment promotes the birth process at the appropriate time; increased uterine oxytocin receptors early in gestation would not be desirable.
Molecules that bind to receptors with high affinity are classified as either agonists or antagonists. Agonists are ligands that trigger the usual response associated with hormone action. However, if you use the pharmaceutical industry as an example, many drugs act to either mimic or block naturally occurring ligandbinding reactions. The same general idea applies to hormone receptor interactions. Some synthetic versions of steroid hormones are much more potent than the corresponding naturally occurring versions. This may reflect an increased affinity of the receptor for the analog compound so that more [HR] complexes are maintained, therefore enhancing response. Other possibilities are that the analog is longer lived, that is, not subject to normal degradation pathways or some other mechanism. Antagonists bind to the receptor but fail to activate usual effector mechanisms. Since they occupy the receptor, normal agonists are prevented from action so hormone response declines.
In a few cases, receptors are available in several fold surplus relative to those required for a maximum physiological response. Having these spare receptors seems a waste but it is suggested that this allows a seeming mismatch between low-circulating concentrations of the hormone and relatively low-affinity receptors to still be effective. Going back to the law of mass action, by increasing the number of available receptors, this guarantees that an adequate number of receptors will be bound for appropriate action despite the presence of less-than-saturating concentrations of hormone in circulation.
Measuring circulating hormone concentrations
The development of radioimmunoassay (RIA) techniques in the late 1960s and early 1970s ushered in a golden age for the study of endocrine regulation of lactation, reproduction, and growth in domestic animals. Although bioassays had served to establish general themes (changes in pituitary Prl, GH, FSH or LH in correspondence with major reproductive events, e.g., puberty, pregnancy, lactation), widespread availability of RIA methods for Prl, GH, oxytocin, progesterone, estrogen, and other hormones allowed study of hormone secretion on a scale previously unimagined. These techniques replaced the bioassays and allowed the accurate measurement of circulating blood or tissue concentrations of many hormones. Hormones and growth factors are typically present in only picogram (pg) or nanogram (ng) quantities per milliter of plasma. For the first time it became possible to determine correspondence between the secretion rate and pattern of secretion. As an offshoot of methods for radiolabeling purified hormones for use in biochemistry and receptor-binding studies, RIA methods were subsequently developed.
A brief history explains the idea behind the RIA. Dr. Rosalyn Yalow, who was working at the Veterans Administration Hospital, Bronx, NY, was considering the possibility that some of her diabetic patients were producing antibodies against insulin. To test this idea she reasoned that if this were true it could be tested by incubating blood serum from suspect patients with radioactively tagged or labeled insulin. This was about the time when techniques for radiolabeling proteins for receptor studies were also developed. The idea was that if antibodies against insulin were present that they would bind to the insulin and thereby prevent insulin from having its normal physiological effects. After an incubation period with added radiolabeled insulin the samples were passed over a gel filtration column. The key point is that antibodies are very large proteins compared to insulin. Radiolabeled insulin that is not bound to an antibody would pass through the column more slowly than insulin in the bound state. Specifically, small molecules are retarded in the column (they can migrate into all small spaces that make up the gel matrix) but large complexes of antibody plus insulin would quickly be eluted from the column. Second, she could estimate rates of passage by measuring the amount of radioactivity in fractions that eluted from the column. If the sample contained antibodies, the rate of passage would be much faster with a control sample. She did find that some diabetic patients made antibodies against insulin.
However, our focus is on what happened later. She and her collaborators, started to work on the question of whether antibodies might not be used to somehow measure hormone concentrations. This is similar to the example shown in Figure 12.8 that illustrates the competition of radiolabeled Prl on receptor proteinsites by adding increasing amounts of nonradiolabeled Prl. Essentially, could antibodies be used to first bind radiolabeled hormone and the rate of competition be used to estimate the amount of hormone in an unknown sample? The answer turned out to be yes. This was a major accomplishment. In fact, Dr. Yalow shared the Nobel Prize for medicine in 1977 for her pioneering efforts to develop RIA for protein hormones. The other winners that year were Drs. Andrew Schally and Roger Guillemin for their competing efforts to discover hypothalamic hormones that control secretion of anterior pituitary hormones.
Several things are required to develop an RIA for measuring hormone concentration. First, a source of purified hormone is needed. This was fortuitous in Dr. Yalow's research since insulin has been purified from porcine or bovine pancreatic tissue since the 1930s for use in diabetic patients. Because of recombinant DNA technology much of the insulin currently in clinical use utilizes the human insulin gene spliced into Escherichia coli. By the way, this biotechnology revolution has altered much more than possibly esoteric study of endocrinology; an increasing number of agricultural products that are produced in this manner—bovine GH or bST to increase milk production or the rennet used in cheese making—readily come to mind.
The purified hormone is needed to make the radio- labeled tracer and is used to generate a standard curve in the assay procedure. A source of purified hormone is also necessary to produce antibodies that recognize the hormone under study. The antibody (often simply a dilution of serum from an immunized host animal) that specifically binds to the hormone is called the primary or first antibody. A common RIA technique is called the double antibody RIA. This procedure requires the use of another antibody solution. For example, if guinea pigs were immunized against bovine insulin the animals would have antibodies that recognize or bind bovine insulin in their bloodstream. Blood or serum samples from these animals could be used to provide the first antibody source needed in an RIA. As part of the procedure, there is also a need for more general antibodies that recognize any guinea pig antibody; in other words, anti-guinea pig gamma globulin antiserum (gamma globulin is the class of proteins to which antibodies belong). Most often a large animal (sheep or goat) is used for this purpose. Briefly, the sheep or goat is immunized with a mixture of purified guinea pig gamma globulins. It is important to realize that these antibodies recognize antibodies from the guinea pig. They do not recognize the hormone (bovine insulin in our example). The purpose of these second antibodies is to create a complex that can be precipitated by simple centrifugation. They are added in excess so that all of the available primary antibody molecules are captured. Since the tracer is competed from binding sites on the first antibody, much of the tracer can be lost when the tubes are decanted following centrifugation. Table 12.2 summarizes these required reagents. Let's now consider the procedure of how the double antibody RIA assay is performed.
A normal procedure requires the creation of standard curve and dilution of unknown samples followed by addition of the reagents in a prescribed sequence. A typical pattern is illustrated in the following:
• Day 1—label tubes and add dilutions of standards and unknowns in assay buffer to appropriate tubes (usually 500 μL total volume).
• Day 2—add tracer (a dilution of radiolabeled hormone -30,000 cpm per tube; usually 100 μL)
• Day 2—add diluted first antibody to all tubes except total count and background tubes (usually 100 μL).

• Day 3—add diluted second antibody to all tubes except the total count tubes (usually 100 μL).
• Day 3-6—incubate the assay tubes at 4C.
• Day 7—add cold assay buffer (usually 1 mL) and immediate centrifuge all tubes except the total count tubes. Decant the liquid and measure the radioactivity remaining in each tube.
There are now variations on this basic procedure, for example, many commercial RIA kits use tubes that have the first antibody bound to the surface of the tube. This eliminates the need for the second antibody and centrifugation but basic principles remain the same. The fundamental idea is that competition for tracer bound to the primary antibody by hormone in unknowns to be evaluated is compared with the competition that occurs when known amounts of purified, nonradiolabeled hormone are added to assay tubes. In other words, the amount of radioactivity remaining in tubes containing unknown samples is compared against a standard curve. While most procedures now rely on computer programs to crunch the numbers and calculate concentrations rather than interpolation of results from a graphical plot of the standard curve, the ideas can be readily illustrated this way. Let's consider a set of results (Table 12.3) from a RIA standard curve for bovine insulin and some radioactivity values for some unknown samples.
The values listed are averages for replicates of 3-4 tubes or duplicates for the total count tubes. Total count tubes are simply the average of two tubes that contain 100 μL of the tracer solution but nothing else. These tubes are set aside and counted along with the other assay tubes to provide a measure of how much of the tracer was added to each of the assay tubes. Remember that all the tubes had 100 μL of the same diluted solution of tracer at the start of the assay or
Table 12.3. Example bovine insulin RIA data.
| Tube No. | Description | Radioactivity Remaining (cpm)’ | % Bound |
| 1,2 | Total count | 32,650 | |
| 3-5 | Background | 555 | |
| 6-9 | Total binding | 12,950 | 100 |
| 10-12 | Std 0.1 ng/tube | 11,551 | 88.7 |
| 13-15 | Std 0.2 ng/tube | 9981 | 76.0 |
| 16-18 | Std 0.4 ng/tube | 8800 | 66.5 |
| 19-21 | Std 0.8 ng/tube | 7311 | 54.5 |
| 22-24 | Std 1.6 ng/tube | 5564 | 40.4 |
| 25-27 | Std 3.2 ng/tube | 4026 | 28.0 |
| 28-30 | Std 6.4 ng/tube | 2507 | 15.7 |
| 31-33 | Std 12.8 ng/tube | 1856 | 10.5 |
| 34-36 | Unknown 1 | 10,369 | 79.2 |
| 37-39 | Unknown 2 | 7256 | 54.1 |
1Data given as average counts per minute (cpm).
~33,000 counts per minute (cpm) each in this example. Radioactivity is more accurately described in terms of disintegrations per minute (dpm) because this takes into account the efficiency of the counting device. However, use of cpm is acceptable to describe relative differences in radioactivity, especially if there are no issues with variation in counting between samples. This is not typically an issue with higher energy isotopes such as I125. Tubes 3-4 received all of the same solutions as the other assay tubes, except buffer instead of 100 μL of first antibody solution. Because the tracer is an iodinated protein it can stick nonspecifically to surfaces. The radioactivity or cpm remaining in these tubes provides a measurement of background or nonspecific binding. The values for percent binding have the background cpm subtracted prior to calculation. Tubes 6-9 are called total binding tubes because they contain tracer and all the necessary antibodies but no competing hormone, that is, neither added standard nor unknown. Notice that in the absence of any competition about 39% of the total tracer added is bound to the antibody TB/TC ? 100 [12,950/32,650 ? 100 = 39.7%]. For the purpose of creating the standard curve, this total binding or zero competing value provides a reference point for comparison to create the standard curve and is called the 100% binding value.
Now consider the radioactivity values for tubes 10-12 and 31-33. For those that had 0.1 ng of nonradiolabeled insulin added, the radioactivity is slightly less than for the total binding tubes (12,950 vs. 11,551); expressed as a percent of the total binding sample, this is 88.7%. As you scan down the listing with increasing amounts of nonradiolabeled (cold) insulin added, the remaining Tadioactivitybecomes progressively smaller and smaller. For example, with the addition of 6.4ng of cold insulin, bound radioactivity equals 2507 cpm or 15.7% of total binding. Clearly, there is a negative relationship between the concentration of competing cold insulin and the amount of tracer bound to the antibody. Data for tubes 34-36 are the average for replicated samples (100 uL of serum) taken from a cow prior to the infusion of glucose. Bound radioactivity averages 10,639 cpm or 79.2% of total binding. Data for tubes 37-39 is the average for replicate samples (100 μL of serum) from the same cow 10 minutes following an IV infusion of glucose. Bound radioactivity averages 7256 cpm or 54.1% of total binding. Could you now extrapolate from the standard curve to estimate the ng of insulin in each of these samples?
Figure 12.10 shows a plot (insert) of percentage of radioactivity bound versus nanogram of cold insulin added. While this simple plot clearly shows this negative relationship, it is mathematically more complex to extrapolate from this curve. However, a simple transformation serves to linearize the shape of the curve so that extrapolation is simpler. Specifically, concentrations of cold hormone are expressed on a log scale (x-axis) and the percent binding (y-axis) as a logit transformation. In practice, these calculations are usually done via computer program but comparing the two plots (Fig. 10.10) illustrates the utility of the transformation. For example, consider the data for unknown 1 (tubes 34-36; 10,669 cpm; 79.2% binding) and the corresponding dashed line (Sl) in Figure 10.10. The intersection with the x-axis suggests this corresponds to ~0.22ng of insulin in 100 μL of serum or 2.2ng∕mL, that is, each mL (0.22ng ? 10 = 2.2ng∕mL). The second unknown (S2) suggests an interaction at about 0.85ng, so this corresponds with 0.85ng∕100μL or 8.5ng∕mL. This indicates a nearly fourfold increase in serum insulin within 10 minutes after administration of glucose.
The RIA methodology has been a powerful technology to measure not only hormones but other proteins
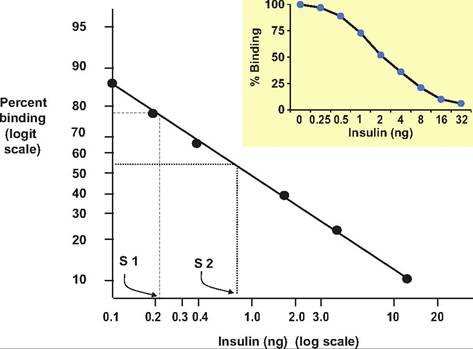
Fig. 12.10. RIA standard curve standard plot. The insert shows the relationship between percent binding and amount of added insulin on a simple arithmetic plot. Conversion to Logit-Log transformation of the same data produces a straight-line relationship that simplifies extrapolation for calculating unknown values (S 1 and S 2).
and molecules. For isotope labeling, some steroids are labeled with tritium (3H) or carbon 14C. In addition, to produce antiserum to detect steroids and other small poor antigens, the molecules are often linked with larger proteins or peptides. Although traditionally hormones were tagged with radioactivity, a number other immunoassay techniques have evolved to avoid the use of isotopes and costs associated with possible safety issues or waste disposal. In these assays the antigen is linked to an enzyme, fluorescent tag, or chemiluminescent label to produce the tracer solution. For example, many enzyme-linked immunoabsorbent assays (ELISAs) that depend on antibody-coated microtiter plates and enzyme-labeled reporter antibodies can be as sensitive as traditional RIA procedures.
Despite the advancements allowed by use of the RIA, it is nonetheless important to remember that the method depends on antibody-antigen binding so that it is possible with highly specific antibodies (e.g., monoclonal antibodies) that fragments of hormones might be detected in addition to intact molecules. Since the method does not distinguish biologically active hormones, some caution in interpretation of results is also warranted.
Endocrine and growth factor signaling
By this point you might be wondering, "How can I build a framework to add some sense to this seemingly bewildering array of first and second messengers, receptor types, and signaling cascades to really understand relationships with physiology?" Traditionally, hormones were classified based on their effects. One such classification scheme is illustrated in Table 12.4. For example, glucocorticoids (cortisol and relatives) were named for their capacity to affect carbohydrate metabolism, hence the metabolic classification. The pituitary hormones were named because of their trophic effects, that is, their capacity to induce secretions of hormones in other endocrine glands. However, GH, for example, has impacts on metabolism, growth, cardiac function, and secretion of IGF-I from the liver. Prl is associated with more than 100 specific physiological activities. Other hormones were named based on their gland of origin, that is, thyroid hormones. While such classifications have logic, there can be confusion and problems. For example, the actions of the glucocorticoids can be much more diverse than just those that impact carbohydrate metabolism. These effects are only a subset. Second, it is possible that structurally similar hormones can signal target cells by a common receptor. For example, as illustrated in Figure 10.5, insulin and IGF-I have distinct receptors. The affinity of insulin for the IGF-I receptor is lower than the affinity of IGF-I, but, for example, what would happen in a diabetic state with elevated concentrations circulating insulin? Despite the lower affinity, it is likely that under these conditions insulin could more likely signal via its native receptor as well as IGF-L
Table 12.4. Functional classification of hormones.
| Class | Examples | Actions |
| Kinetic | Oxytocin, epinephrine | Uterine contractions, milk ejection Pigment secretion |
| Metabolic | Cortisol Insulin Triiodothyronine | Carbohydrate mobilization Glucose uptake Metabolic rate |
| Morphogenic | Estrogen GH Testosterone | Gamete production, tissue development, sex characteristics General body growth Gamete production, secondary sex characteristics |
| Behavior | Estrogen Testosterone Prl | Estrus Aggression Nest building and other maternal actions |
These complications and the burgeoning data coming from molecular biology and cell biology studies suggest that hormones and growth factors would be more logically classified based on the receptor through which these molecules signal target cells. This has certainly revolutionized our understanding of cell signaling in that we now understand that there are broad families of hormones and growth factors that share similar mechanisms of action. For example, until the structural details of the receptors became available, who would have combined leptin, Prl, and erythropoietin into the same class of molecules? This does not mean that we plan to abandon a traditional discussion of the major endocrine glands and their products. It is, however, important to appreciate that understanding of the endocrine system and its physiology is an area of rapidly evolving research and study.
The hypophyseal-pituitary axis
For many years the pituitary gland was called the master endocrine gland. This was because of the large number of hormones that it produces and their widespread physiological effects throughout the body. However, since negative feedback loops and secretion of hypothalamic hormones ultimately regulate secretion of the pituitary hormones, the question of master and servant is a real one. Regardless, the pituitary hormones are essential and critically important in control of animal functions directly related to animal agriculture productivity, that is, rate of growth, muscle development, reproduction, and lactation. This is where we will begin our survey of major endocrine glands, their products, and their actions.
Secretion of the hormones of the anterior pituitary is tightly linked to secretion of other hormones that are produced by cells located in nuclei of the hypothalamus. Although these releasing hormones (or releasing inhibiting hormones, in some cases) are produced only in very small amounts, they are able to impact the activity of cells of the pars distalis because of a unique arrangement of blood vessels between the hypothalamus and the anterior pituitary. This is called the hypothalamic-hypophyseal portal blood system. Simply stated, venous blood that drains from the hypothalamus mixes with arterial blood and passes to the anterior pituitary before it goes into the general venous circulation. The importance of this special anatomical relationship was confirmed by elegant experiments in the 1960s and 1970s that showed that placing a foil barrier between the hypothalamus and pituitary markedly inhibited the secretion of all of the anterior pituitary hormones except PrL Although the secretion of the hypothalamic releasing hormones was not prevented by this procedure, diversion of these secretions into the general circulation, diluted the concentrations so much that the capacity of regulated secretion of anterior pituitary hormones was lost. Of course, the pituitary gland must also receive oxygenated arterial blood. Arterial branches of the circle of Willis supply most of this blood.
Pituitary overview
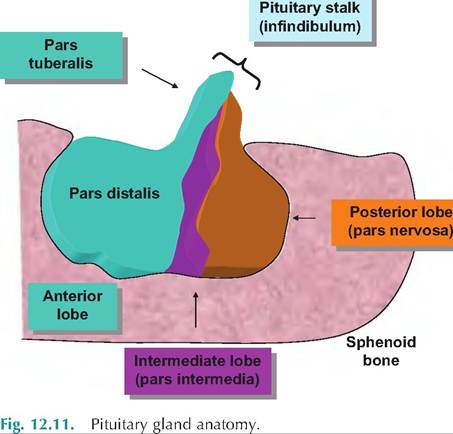
The pituitary gland or hypophysis is located at the very base of the brain in a depression of the sphenoid bone of the lower skull called the sella turcia. This obviously provides a great deal of protection for this important endocrine gland. It is divided into three divisions or lobes. The largest is the adenohypophysis or anterior pituitary. Much of the anterior lobe contains cords of closely compacted epithelial cells, which secrete many of the more familiar pituitary hormones, that is, GH, Prl, FSH, and so on. This hormone- Synthesizing region, called the pars distalis, accounts for most of the tissue mass. However, a smaller tongue of tissue extends up and around the pituitary stalk to form a part of the anterior lobe called the pars tuberalis. A smaller region of tissue, the pars intermedia or intermediate lobe, is sandwiched between the anterior pituitary and the second largest division called the posterior pituitary or pars nervosa. As you might have guessed from its name, this region of the pituitary gland has a very different cellular structure than the anterior lobe. The cells of the region are in fact neurosecretory cell nerve endings and associated supporting cells. The hormones of the posterior pituitary are actually synthesized by cell bodies of the hypothalamus but released from the neural cells that populate the posterior pituitary. Figure 12.11 illustrates the basics of the pituitary gland.
Many of the pituitary hormones are called trophic hormones. This refers to the fact that these hormones generally stimulate the secretion of hormones by other endocrine glands in addition to other biological effects. For example, consider follicle-stimulating hormone (FSH). In females, FSH stimulates the ovarian follicles, which synthesize and secrete estrogen and/or progesterone (following ovulation). In males, FSH and LH are involved in spermatogenesis, but they also promote testosterone production. There are often many overlapping biological actions between hormones. The secretion of one hormone can enhance the action of another. This is called a synergistic effect. In other situations, secretion of one hormone is necessary for another to be effective; this can be described as a permissive effect. In fewer situations, two hormones can have opposing or antagonistic effects. It is important that the secretion of the anterior pituitary hormones be adequately controlled. We will discuss the importance of the hypothalamus shortly, but secretion of these hormones is controlled by negative feedback loops. This type of regulation can involve the anterior
pituitary hormones directly; that is, continued secretion of high amounts of the hormone negatively impacts the pituitary to reduce further synthesis and/ or secretion of the hormone. In other cases the negative feedback involves the target stimulated by the particular trophic hormone. Negative feedback can also occur by altering the rate of secretion of the hypothalamic hormones that stimulate the secretion of the anterior pituitary hormones. We will provide examples of these feedback loops as we discuss individual hormones.
The epithelial cells of the anterior pituitary, specifically the pars distalis, were first described based on their morphology and staining characteristics. For example, some populations of the cells stained with basic dyes and were identified as basophils. Other populations stained with acidic dyes and were dubbed acidophils. Cells that stained poorly with either class of dyes were identified as chromophobes. Various physiological experiments or pathological events that tracked changes in reproduction, growth, or other factors slowly lead an appreciation of cell types that were connected with the secretion of specific hormones. For example, lactating animals were shown to have pituitaries with an increased number of acidophils. This was coupled with increased Prl secretion, thus linking Prl secretion with acidophils. Generally, acidophils include both somatotrophs that secrete GH or somatotropin and Iactotrophs that secrete Prl. Under usual circumstances the acidophils account for 50-70% of the cells. The basophils include the FSH and LH secreting gonadotrophs, Cortiotrophs that secrete adrenocorticotropic hormone (ACTH), and thyrotrophs that secrete thyroid-stimulating hormone (TSH). More recent studies have utilized specific immunocytochemical techniques to localize specific hormones to particular pituitary cells. Results of these studies suggest that some cells may secrete more than one hormone. For example, Prl and GH staining has been noted in the same cells. Such cells are called mammo- Somatotrophs. In humans they are most frequently noted within pituitary tumors. Regardless, this suggests that the cells of the pars distalis may display much more plasticity with respect to secretion of hormones that was once thought. Table 12.5 provides a listing of the anterior pituitary hormones and their major trophic targets.
Table 12.5. Hormones of the anterior pituitary gland.
| Hormone | Abbreviation | Tropic Target |
| Growth hormone | GH or STH | Liver |
| Prolactin | Prl | None |
| Adrenocorticotropin | ACTH | Adrenal cortex |
| Thyroid-stimulating hormone | TSH | Thyroid |
| Follicle-stimulating hormone | FSH | Ovary—testes |
| Luteinizing hormone | LH | Ovary—testes |
Secretion of these pituitary hormones is closely coupled with the hypothalamus. Figure 12.12 illustrates relationships between the hypothalamus and the pituitary gland. The key idea is that particular groups of nerve cells (nuclei) in the hypothalamus secrete hormones that act on the adjacent anterior pituitary. For example, growth hormone releasing hormone (GHRH) is 44-amino acid peptide produced in the arcuate nucleus from a larger precursor molecule of 107 or 108 amino acids. Most of the activity of the GHRH resides in the first 29 amino acids of the molecule, since experiments have shown that infusions of the truncated version are as effective as the full-length version of the molecule. Many of the hypothalamic peptides appear in other places in the body. For example, D cells of the pancreatic islet cells also secrete the tetradecapeptide somatostatin (GHIH). These hormones and their corresponding pituitary target hormones are listed in Table 12.6.
It seems that other agents are frequently being identified that have impacts on secretion of pituitary hor-
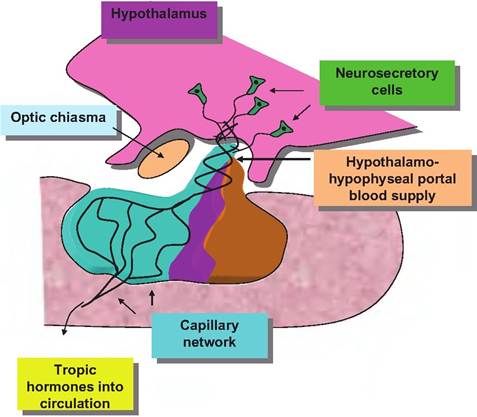
Fig. 12.12. Relationship between the hypothalamus and the anterior pituitary.
mones. For example, ghrelin is a potent Secretagogue for GH that is found in both the GI tract and central nervous system, with the highest concentrations in the stomach. On a weight basis it is even more potent than GHRH in stimulating secretion of GH. It also stimulates hunger and in many respects may act as a counter to leptin, which induces satiety (Kirsz and Zieba, 2011).
Kisspeptins are a group of related peptides that are produced from a 145-amino acid precursor that leads to cleavage products 10-14 amino acids in length. Kisspeptin-Secreting neurons are present in the hypothalamus, including the periventricular nucleus, preoptic nucleus, and arcuate nucleus. The neurons send projections to the medial preoptic nucleus, which is rich in cells producing gonadotropin-releasing hormone. Thus, kisspeptin is believed to act on GnRH neurons to stimulate GnRH secretion. Kisspeptin neurons also are apparently sensitive to changes steroid hormones which are involved in control of GnRH and thereby secretion of FSH and LH. Kisspeptins appear to be especially important in regulation of the onset of puberty (Amstalden et al., 2011; Pinilla et al., 2012).
The hypothalamic hormones were first described because of their effects on the anterior pituitary hormones. It is now known that many of these substances also function as neurotransmitters. The reverse is also true. A number of molecules first described as neurotransmitters also function as classic hormones; that is, the same substance might act as neurotransmitter, neural hormone, or classic hormone. For a student, this adds confusion, but also indicates how difficult it is to make hard and fast rules to categorize whether a messenger is a hormone or a neurotransmitter.
Table 12.7 provides some further detail about the structure of hypothalamic hormones and posterior pituitary hormones. Many of these peptides are very small molecules compared with many other protein hormones. A comparison of the nonapeptides oxytocin and vasopressin shows the similarity of structure of these molecules, that is, only two amino acids differ and they have essentially identical cyclic structures, yet their biological responses are distinct. GHRH and CRH are larger but relatively simple peptide chains. PIH is now known to be dopamine, which is similar
Table 12.6. Hormones of the hypothalamus.
| Hormone | Abbreviation | Pituitary Target |
| Thyrotropin-releasing hormone | TRH | TSH-secreting cells (Prl—Iactotrophs?) |
| Gonadotropin-releasing hormone | bgcolor=white>GnRHGonadotrophs (FSH-LH) | |
| GH-inhibiting hormone (somatostatin) | GHIH | Somatotrophs (GH) |
| GH-releasing hormone | GHRH | Somatotrophs (GH) |
| Corticotropin-releasing hormone | CRH | Corticotrophs (ACTH) |
| Prolactin-inhibiting hormone (dopamine) | PIH | Lactotrophs (PrI) |
| Prolactin-releasing hormone | PIH | ? (TRH) |
Table 12.7. Hypothalamic and neurohypophysis hormone structures.
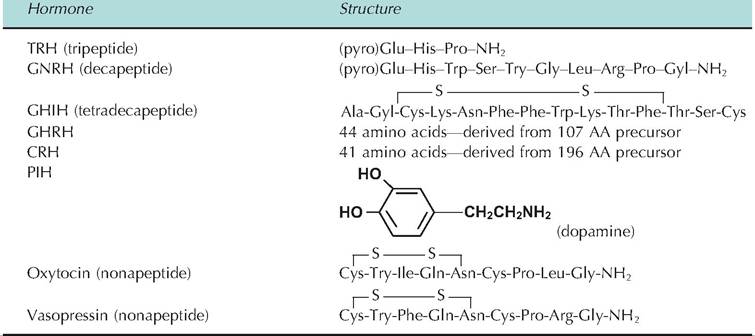
Table 12.8. Neuroendocrine messengers as hormones and neurotransmitters.
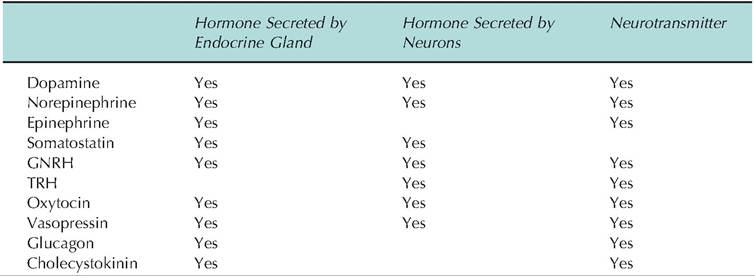
in structure to epinephrine and norepinephrine. Somatostatin, like several of the hypothalamic hormones and neurotransmitters, is found in not only in the hypothalamus but also in the D cells of pancreatic islets, enterocytes of the GI tract, and C cells (parafollicular cells) of the thyroid gland. There are also several structural variants of somatostatin. Somatostatin 14 is predominant in the hypothalamus but somatostatin 28 is found in the cells of the intestinal tract. In addition to its role in regulating GH secretion, somatostatin inhibits the secretion of insulin, glucagon, gastrin, and secretin. Somatostatin also regulates the secretion of TSH because of its capacity to enhance the negative feedback of thyroid hormone on the Ihyrotrophs of the anterior pituitary. Similarly, TRH acts to increase secretion of Prl. Table 12.8 provides a listing of neuroendocrine messengers with overlapping and diverse activities.
Negative feedback loops
Secretion of most of the anterior pituitary hormones is controlled at multiple levels. As Table 12.6 shows, control begins in the hypothalamus with the synthesis and secretion of the hypothalamic hormones into the hypophyseal portal blood supply. Because these agents reach their target cells in the pars distalis with minimal dilution, they are very effective. One means of regulation is to alter the rate at which these hypothalamic hormones are made. Changes in higher brain function that impact the hypothalamus also alter production of many of these agents and thereby activity of the pituitary.
An interesting example of this is the Bruce Effect. As first described in rodents, this is an example of a pheromone (a hormone like agent that acts between individuals) that blocks implantation of a newly fertilized ovum in the uterus. If a new mature male is introduced into a rodent population soon after mating by the previous dominant male, newly fertilized females fail to maintain their pregnancies. How does this occur? First, a little background is needed to understand how failure occurs. Development of follicles, then a dominant follicle, and finally ovulation depends on secretion of pituitary FSH and LH. Estrogen and then progesterone from the ovary are essential to prepare the uterus to accept the newly fertilized ovum for implantation. Secretion of FSH and LH are controlled by GHRH from the hypothalamus. When the new male is introduced to the newly mated female, she responds to a pheromone secreted in his urine. This agent acts on her brain to block production of hypothalamic GHRH. This lowers FSH and LH secretion, which minimizes steroid hormone production and thereby prevents implantation. It is known that the agent acts through the olfactory system because females that have their olfactory nerves blocked do not display this response. Second, the new male does not have to be physically present. Simply exposing the animals to urine from the male can elicit the effect.
Let's now consider some less exotic examples of regulation anterior pituitary hormones. Since there are multiple interacting steps for these trophic anterior pituitary hormones, that is, hypothalamus → pituitary → endocrine organ target → target hormone secretion, there are many opportunities for negative feedback. In the simplest case, the secretion of a hormone by an endocrine gland builds up in the bloodstream. As the concentration increases the hormone affects the secreting cells to reduce the amount that is being made and/or secreted. This can be called simple or primary level negative feedback. Since the effects of hormones are generally proportional to their concentrations in blood, it follows that physiological systems would have evolved to ensure normal functioning could be maintained by carefully monitoring and regulating circulating concentrations of hormones. Since the primary factor that affects the circulating concentration is the rate of secretion, negative feedback loops have evolved to monitor concentrations of hormones at their point of origin. This is complicated by these interactions between the hypothalamus, pituitary, and target endocrine gland. Figure 12.13 illustrates feedback loops that act to regulate the secretion of pituitary hormones.
Hormones and cells of the posterior pituitary
The neurohypophysis or posterior pituitary is chiefly composed of neurosecretory cells and supporting cells. The axons have their origins primarily with the paraventricular and supraoptic nuclei of the hypothalamus. Fundamentally, the posterior pituitary is an extension of the hypothalamus with the nerve endings within the posterior lobe. However, these neurons differ from others neurons in several ways. Like other neurons, they are innervated by other nerve cells located in higher brain regions. Unlike other neurons, these cells release their neurotransmitter-like molecules into the bloodstream. This means that the targets for these agents can literally be positioned anywhere in the body. In this way secretions from these cells are acting as classic hormones.
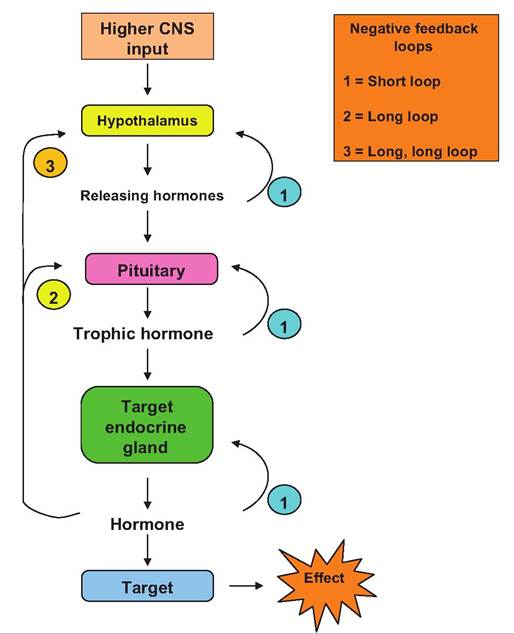
Fig. 12.13. Negative feedback loops and pituitary hormones.
One of the first experiments to indicate the importance of these hormones was work from the late 1800s that showed that the injection of an extract from the pituitary gland increased blood pressure. This effect was traced to the posterior lobe of the gland and is one of the primary effects of the hormone now known as vasopressin. Evidence for the presence of a second hormone of the posterior lobe, oxytocin, was deduced from experiments by Gaines, described in 1915. He showed that injection of posterior pituitary extracts caused milk ejection in lactating animals. Structures of oxytocin and vasopressin were reported in 1954 when du VigneaudzS Nobel Prize-winning work elucidated the amino acid sequences of these peptides. In fact, this was the first example of research providing the amino acid sequence and structure of any peptide (Fig∙ 12.14).
In cows and other mammals, sensory receptors are abundant in the skin of the mammary gland and especially in the teat or nipple. In response to preparation of the udder for milking or nuzzling of the offspring, nerve impulses travel via afferent nerves (branches of the inguinal nerve) to the dorsal root ganglia of the spinal cord and ultimately ascend the spinal cord along the dorsal funiculus to the midbrain. Branches project to the paraventricular and supraoptic nuclei of the hypothalamus. Ultimately, associated nerve cells,
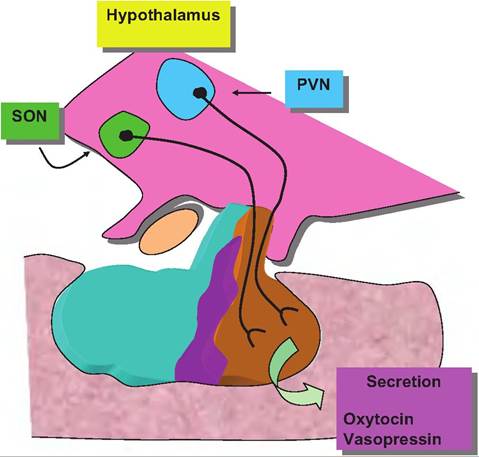
Fig. 12.14. Posterior pituitary pathways. Neurosecretory cells from the paraventricular nucleus (PVN) and supraoptic nucleus (SON) of the hypothalamus send axons to the neurohypophysis for secretion of vasopressin and oxytocin, respectively.
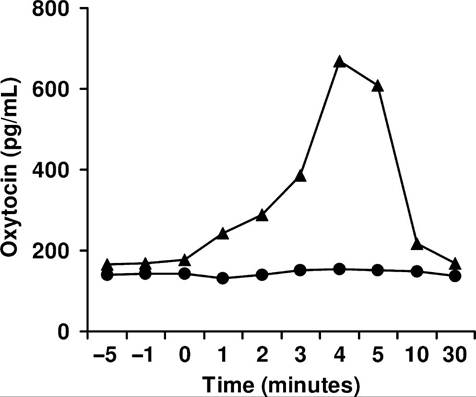
Fig. 12.15. Serum oxytocin at milking. Serum oxytocin measured in two cows in the period just before and after milking. For one cow (∙), there is no measurable change in oxytocin concentration, but for the other cow (A), oxytocin is increased fourfold within 4 minutes. Milk yields were normal for each animal. Adapted from Lefcourt and Akers (1983).
which synapse with the neurosecretory cells of the paraventricular or supraoptic nuclei, act to either inhibit or facilitate this pathway. A predominance of cholinergic activity excites or facilitates but stimulation of local adrenergic neurons impairs oxytocin secretion. It has long been recognized that stress at the time of milking interferes with the milk ejection reflex. Failure of oxytocin to be secreted as an explanation for impaired milk let down is called central inhibition. Since it is likely that stress causes stimulation of the sympathetic division of the autonomic nervous system, it is also possible that increased sympathetic nervous system-mediated vasoconstriction (via β adrenergic receptors) on the sphincters of the metarterioles in the mammary capillary beds acts to shunt oxytocin-laden blood away from the alveoli. Since the oxytocin acutely secreted at milking has a short half-life of ~5 minutes, failure of delivery to the myoepithelial cells (so called peripheral inhibition) may also explain failures of milk ejection. The often-repeated advice for careful, gentle handling of animals at milking or suckling is based on sound physiological principles.
Regardless, measurement of oxytocin with RIA confirms bioassay data showing large variations in oxytocin response to milking or suckling in dairy animals. In goats and cows as many as 40% of the animals show no change in oxytocin with milking stimulation. Moreover, milk yields of the mammary glands of goats transplanted under the neck were normal despite the lack of innervation or apparent milk ejection response. Perhaps for animals such as sheep and goats with
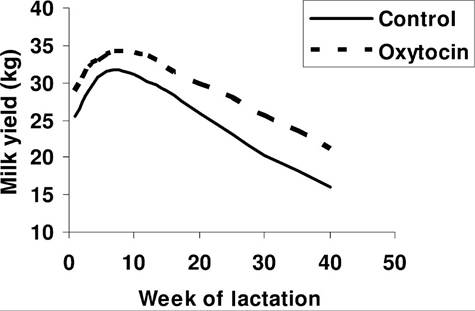
Fig. 12.16. Lactation curves of cows treated with oxytocin. Placebo or oxytocin was administered at the time of milking. Data adapted from Nostrand et al. (1991).
large gland cisterns relative to mammary size, milk ejection is not essential for adequate milk removal. On the other hand, it is very clear that adequate oxytocin release is critical to obtain milk from rodents and pigs, for example. Figure 12.15 illustrates changes in blood oxytocin in response to 4 minutes of milking in two cows. One animal shows an abrupt increase in blood oxytocin and the other cow essentially no response at all, yet milk yields were normal. Regardless, oxytocin is widely used in veterinary medicine as an aid to induced uterine contractions or milk ejection. There is also evidence (Fig. 12.16) that oxytocin treatments can increase long-term milk production in dairy cows.
Although vasopressin was named based on observed impacts on blood pressure, its major physiological effect is as an antidiuretic agent. It acts on the kidney to enhance water retention. When concentrations are elevated, more concentrated urine is produced and more water is retained. This increases interstitial fluid, and blood volume and consequently blood pressure rises. Thus, vasopressin is frequently called antidiuretic hormone or ADH. This more accurately reflects its major physiological action. However, vasopressin or ADH also has some direct pressor effects due to its capacity to stimulate contraction of vascular smooth muscle cells. Most species express arginine vasopressin but closely related arginine vasotocin is synthesized in many birds.
Secretion of ADH is controlled by osmoreceptors located primarily in the hypothalamus, but receptors are present in the stomach and esophagus. If the osmolarity of blood or interstitial fluids is increased this promotes impulses by hypothalamic neurons to increase ADH secretion. The end result is retention of water and, consequently, reduced osmolarity. A drop in blood volume also activates volume receptors within the atria or the carotid sinus. This reduces activities of neurons that normally send inhibitory signals to the hypothalamus. Problems with ADH are most often the result of hyposecretion. When this becomes chronic, large quantities of very dilute urine are produced. This is called diabetes insipidus. In diabetes mellitus, urine production is also elevated but this is because of excess glucose that acts to draw water into urine. Frequent drinking is a symptom of both diseases. Diabetes insipidus can be caused by a failure to secrete ADH (hypothalamic problem) or by failure of the kidney to response to ADH (nephrogenic defect).
Both oxytocin and ADH are synthesized from precursor molecules called preprohormones—prepro- pressinphysin for vasopressin and prepro-oxyphysin for oxytocin in large cell bodies (magnocellular nuclei) in the hypothalamus. As the molecules are transported down the axons to the posterior pituitary, cleavage takes place to yield oxytocin or ADH. The proteins neurophysin I or neurophysin II are also secreted, along with oxytocin or ADH. The neurophysins were initially thought to act as carrier proteins for the peptides but there are currently no known specific functions attributed to these proteins.