Evidence for Disease Susceptibility Differences in Cattle
4.2.1 Heritability estimates
It is well established that prevalence of MAP infection in cattle varies by breed and geographical
In cattle, heritability estimates for susceptibility to MAP infection range between 0.03 and
‘Corresponding author: neibergs@wsu.edu © CAB International 2020.
Paratuberculosis: Organism, Disease, Control, 2nd Edition (eds M.A. Behr et al.)0.23 in Holstein cattle (van Hulzen et al., 2011; Kupper et al., 2012; Shook et al., 2012; Kiser et al., 2017; Gao et al., 2018a; Kirkpatrick and Lett, 2018) and between 0.08 and 0.48 in Jersey cattle (Zare et al., 2014; Kiser etal., 2017). These heritability estimates are in the range of those reported for susceptibility to other mycobacterial diseases such as leprosy (0.2; Wang et al., 2016) as well as other bovine diseases such as bovine respiratory disease (0.13-0.21; Neibergs et al., 2014). Although MAP infection is present within beef herds around the globe, heritability estimates for susceptibility to MAP in beef cattle have not been reported, as cattle studies tend to focus on MAP infection in dairy cattle where it is more prevalent.
4.2.2 Genome-wide association studies
Genome-wide association studies (GWAS) have been conducted to identify loci associated with MAP infection. The identification of loci associated with MAP infection provides the foundation for genomic selection of cattle with enhanced resistance, identifies host disease susceptibility mechanisms through the regulation of genes involved in the immune response to MAP and could identify if the mechanisms and genomic regions associated with infection differ in cattle and other species. A key limitation for all genetic studies associated with MAP infection is the sensitivity of detecting the infection prior to clinical manifestation. Due to poor diagnostic sensitivity, the identification of animals that are truly negative for MAP can be difficult and represents a phenocopy of cattle that are truly negative for disease.
This limitation reduces the power to detect associations with MAP infection and is likely to reduce the repeatability or validation of loci across studies with different diagnostic tests for MAP infection. For example, even within a single study Settles et al. (2009) demonstrated that faecal culture was only able to detect MAP in 40% of MAP tissue culture-positive cattle, indicating that misclassification of MAP infection status is dependent on the diagnostic tests used.Closely related to the sensitivity of MAP diagnostics is the differences in phenotypes used to test for associations in cattle. Some of the most common diagnostic methods used to detect MAP infection and determine phenotypes are ELISA for serum, milk or faecal samples, culturing of tissue or faeces, quantitative polymerase chain reaction (PCR) for tissue or faeces, or a combination of these methods. The loci identified as associated with susceptibility to MAP infection will vary by the phenotype or method of diagnosis of the disease (Settles et al., 2009). For example, when the same Holstein cattle were studied, four loci were associated (P < 5 ? 10-5) with MAP susceptibility when disease was determined by faecal culture, but different loci were associated (P < 5 ? 10-5) with MAP infection based on culturing of tissue (Settles et al., 2009). These differences underscore the importance of using a standardized phenotype when comparing results across studies.
In the past decade, GWAS have been performed in cattle to identify loci associated with MAP infection (Settles et al., 2009; Minozzi et al., 2010; Pant et al., 2010; Kirkpatrick et al., 2011; Zanella et al., 2011; Minozzi et al., 2012; van Hulzen et al., 2012a; Alpay et al., 2014; Kiser et al., 2017; Brito et al., 2018; Gao et al., 2018b; Mallikarjunappa et al., 2018; Table 4.1). The phenotypes for these studies varied and most of these studies were conducted in Holsteins or Jersey cattle. Few loci associated with MAP susceptibility have been validated or present in more than one study (Table 4.1).
Three loci, one on BTA5 and two on BTA10, were associated in studies by Pant et al. (2010) and Mallikarjunappa et al. (2018), while a fourth locus on BTA16 was associated with MAP infection by both Settles et al. (2009) and Kiser et al. (2017) (Table 4.1). However, Pant et al. (2010) and Mallikarjunappa et al. (2018), and Settles et al. (2009) and Kiser et al. (2017) shared study populations, so these loci were not validated in completely independent cattle populations. The failure of loci to validate could potentially be due to the differences in diagnostic methods or the marker density used for genotyping. Most studies used lower-density single nucleotide polymorphism (SNP) genotyping assays panels that contain 50,000 or fewer SNPs, although a few studies have used higher-density (777,986 SNPs) SNP assays or have imputed genotypes to a whole genome sequence level. Differences in SNP density could result in associated loci being undetected if the SNPs nearest the locus are in weak linkage disequilibrium (LD) or aren't in LD with the associated SNP(s).Table 4.1. Summary of genome-wide association studies performed in domestic ruminants to identify loci associated with Mycobacterium avium subsp. paratuberculosis (MAP) infection.
Species Chromosome(s) Studies Breed(s)a Diagnostic usedb
| Bovine 1 | Settles et al. (2009); Pant et al. (2010); | HO | ELISA F, S |
| Zanella et al. (2011); Minozzi et al. (2012); Gao et al. (2018b) | Culture - F, T | ||
| 2 | Kirkpatrick et al. (2011); Zanella et al. (2011); Alpay et al. (2014); Gao et al. (2018b) | HO | ELISA - S Culture - F, T |
| 3 | Settles et al. (2009); Kirkpatrick et al. (2011); Kiser et al. (2017); Gao et al. (2018b) | HO | ELISA - S Culture - F, T |
| 4 | Kirkpatrick et al. (2011); van Hulzen et al. (2012a) | HO,HOX | ELISA - M, S Culture - F |
| 5 | Settles et al. (2009); Pant et al. (2010); Kirkpatrick et al. (2011); Mallikarjunappa et al. (2018) | HO | ELISA - M, S Culture - F, T |
| 6 | Pant et al. (2010); Kirkpatrick et al. (2011); Zanella et al. (2011); Minozzi et al. (2012); Alpay et al. (2014); Gao et al. (2018b); Mallikarjunappa et al. (2018) | HO | ELISA - F, M, S Culture - F, T |
| 7 | Settles et al. (2009); Pant et al. (2010); Kirkpatrick et al. (2011); Minozzi et al. (2012); Alpay et al. (2014); Gao et al. (2018b); Mallikarjunappa et al. (2018) | HO | ELISA - F, M, S Culture - F, T |
| 8 | Minozzi et al. (2010); Kiser et al. (2017); Gao et al. (2018b) | HO | ELISA - S Culture - T |
| 9 | Settles et al. (2009); Minozzi et al. (2010); Kirkpatrick et al. (2011) | HO | ELISA - S Culture - F, T |
| 10 | Pant et al. (2010); Kirkpatrick et al. (2011); Kiser et al. (2017); Mallikarjunappa et al. (2018) | HO | ELISA - M, S Culture - F, T |
| 11 | Minozzi et al. (2010); Pant et al. (2010); Gao et al. (2018b) | HO | ELISA - S |
| 12 | Minozzi et al. (2010), 2012; Kiser et al. (2017) | HO | ELISA F, S Culture - F, T |
| 13 | Kirkpatrick et al. (2011); Minozzi et al. (2012); Gao et al. (2018b) | HO | ELISA F, S Culture - F, T |
| 14 | Pant et al. (2010); Kirkpatrick et al. (2011); van Hulzen et al. (2012a); Kiser et al. (2017); Mallikarjunappa et al. (2018) | HO, HOX | ELISA - M, S Culture - F, T |
| 15 | Kirkpatrick et al. (2011); Zanella et al. (2011); Minozzi et al. (2012); Alpay et al. (2014); Mallikarjunappa et al. (2018) | HO | ELISA - M, S Culture - F, T |
Continued
| Species | Chromosome(s) | Studies | Breed(s)a | Diagnostic usedb |
| 16 | Settles et al. (2009); Kirkpatrick et al. (2011); Minozzi et al. (2012); van Hulzen et al. (2012a); Kiser et al. (2017); Gao et al. (2018b); Mallikarjunappa et al. (2018) | HO, HOX | ELISA - F, M, S Culture - F, T | |
| 17 | Kirkpatrick et al. (2011); Alpay et al. (2014) | HO | ELISA - S Culture - F | |
| 18 | Kirkpatrick et al. (2011); van Hulzen et al. (2012a); Gao et al. (2018b) | HO, HOX | ELISA - M, S Culture - F | |
| 19 | van Hulzen et al. (2012a) | HOX | ELISA - M | |
| 20 | Kirkpatrick et al. (2011); van Hulzen et al. (2012a); Gao et al. (2018b); Mallikarjunappa et al. (2018) | HO, HOX | ELISA - M, S Culture - F | |
| 21 | Settles et al. (2009); Kirkpatrick et al. (2011); Minozzi et al. (2012); van Hulzen et al. (2012a); Kiser et al. (2017); Mallikarjunappa et al. (2018) | HO, HOX | ELISA - F, M, S Culture - F, T | |
| 22 | Kirkpatrick et al. (2011); Minozzi et al. (2012); Kiser et al. (2017); Gao et al. (2018b) | HO, JE | ELISA F, S Culture - F, T | |
| 23 | Settles et al. (2009); Kirkpatrick et al. (2011); Minozzi et al. (2012); Gao et al. (2018b) | HO | ELISA F, S Culture - F, T | |
| 24 | Gao et al. (2018b) | HO | ELISA - S | |
| 25 | Kirkpatrick et al. (2011); Minozzi et al. (2012) | HO | ELISA - F, S Culture - F, T | |
| 26 | Kirkpatrick et al. (2011); Minozzi et al. (2012); van Hulzen et al. (2012a) | HO, HOX | ELISA - F, M, S Culture - F, T | |
| 27 | Minozzi et al. (2010); van Hulzen et al. (2012a); Gao et al. (2018b) | HO, HOX | ELISA - M, S | |
| 29 | Kirkpatrick et al. (2011); van Hulzen et al. (2012a); Alpay et al. (2014) | HO, HOX | ELISA - M, S Culture - F | |
| Ovine | 1,3-6, 8-9, 12-14, 17-18, 20, 22-24, 26-27 | Moioli et al. (2016a) | SA | ELISA - S |
| Caprine | 4-6, 8-9, 13, 17, 19, 27 | Cecchi et al. (2017) | GA | ELISA - S |
aCattls breeds are abbreviated as follows: Holstein - HO, Jersey - JE. Crossbreds are denoted with an X after the main breed code. Sheep breeds are abbreviated: Sarda - SA. Goat breeds are abbreviated: Garfagnina - GA. bSample types used for testing are abbreviated as follows: faecal - F; milk - M; serum - S; Tissue - T. Diagnostic testing method abbreviations are: enzyme-linked immunosorbent assay - ELISA.
Studying multiple breeds or crossbred cattle is needed to determine if the loci associated with MAP infection differ by breed. A large GWAS in Canada identified loci associated with MAP susceptibility in Jersey and Holstein cattle (Sallam et al., 2017). In this study, single-marker comparisons of Jersey and Holstein cattle populations were followed by combining P-values of SNP associations to account for the possibility that LD was different between breeds. Two loci were associated (P < 5 ? 10-5) with disease susceptibility on BTA19 and BTA23 (Sallam et al., 2017). These loci differed from the locus identified on BTA27 when the GWAS was conducted using a single-marker approach on the combined population (Sallam et al., 2017). The same study also analysed the GWAS using Bayes C in the combined breed population with 1 megabase (Mb) windows. Nine windows explained >1% of the genetic variance, finding associations on BTA2, BTA3 (three regions), BTA6, BTA8, BTA25, BTA2 7 and BTA29 (Sallam etal., 2017). The identification of loci associated with MAP infection in multiple breeds provides the opportunity to use the same markers for genomic selection for either breed or for crossbreds.
4.2.3 Candidate gene studies
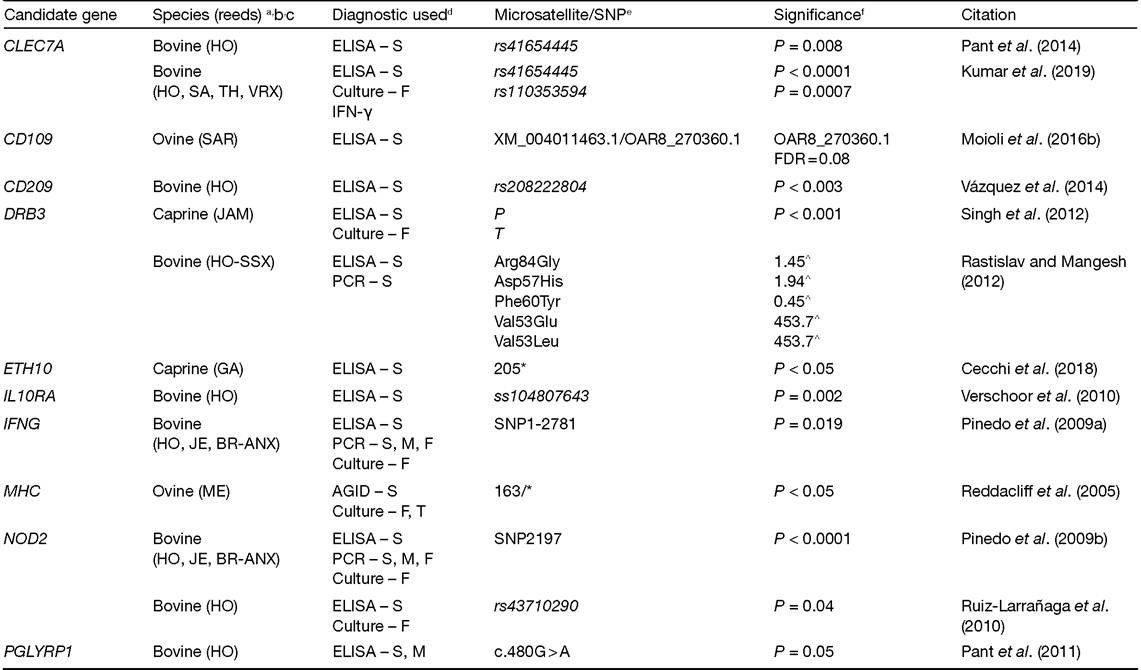
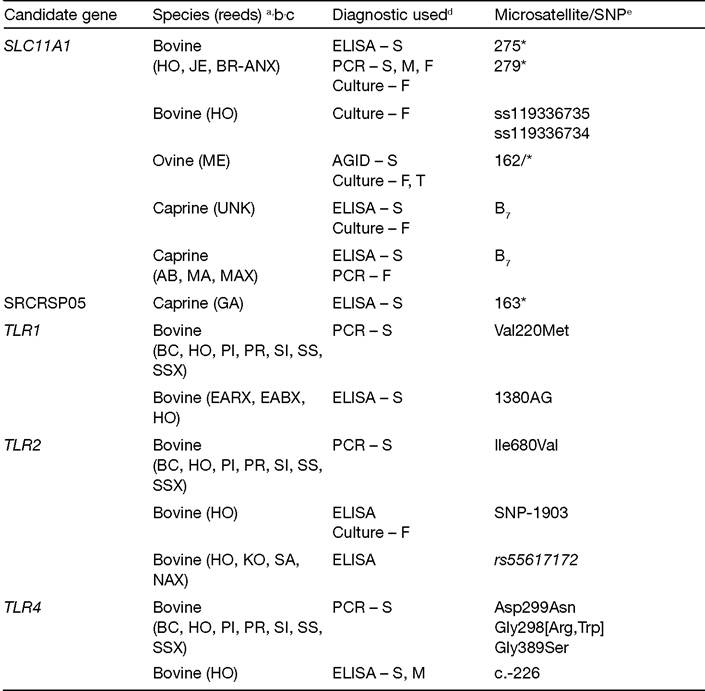
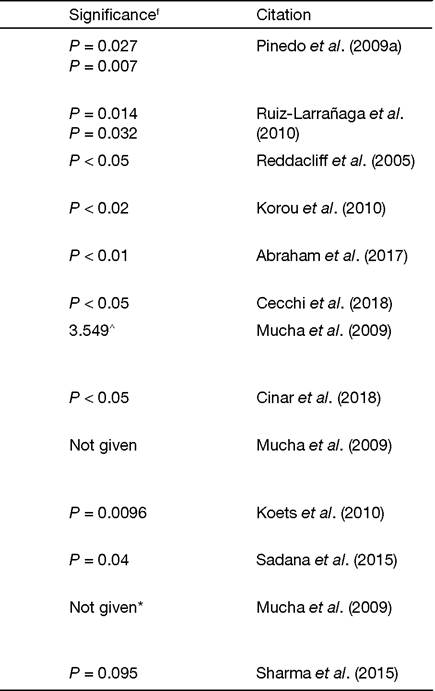
Susceptibility to MAP infection is likely polygenic, due to the multiple loci identified in GWAS and the complex nature of the disease. Candidate gene studies are association studies limited to genes with functions that make them good candidates for harbouring a variant that predisposes cattle to MAP infection. Some of the most commonly studied candidate genes whose proteins are involved in MAP infection in cattle are solute carrier family 11 member 1 (SLC11A1, formerly known as NRAMP1), nucleotide-binding oligomerization domain containing 2 (NOD2, formerly known as CARD15) and the toll like receptor 2 (TLR2) and 4 (TLR4). The SLC11A1 protein is involved in limiting intracellular growth of bacteria, likely through its role in transporting metal ions like iron (Forbes and Gros, 2003). The gene products of NOD2 and the TLRs are pathogen recognition receptors that sense the presence of bacteria, triggering an immune response (Ferwerda et al., 2007). Further, NOD2, TLR2 and TLR4 receptors are involved in the cellular recognition of MAP. The receptors differ on where they act on the cell, as NOD2 senses bacterial proteins in the host cytosol (Caruso et al., 2014) while the TLRs recognize bacterial products on the cell surface (Medzhitov, 2001). For a detailed review of candidate genes, SLC11A1, NOD2, TLR2 and TLR4 in ruminants see Kirkpatrick (2010), Purdie et al. (2011) and Singh et al. (2013). Multiple studies in the past decade have further elucidated the roles of these and other candidate genes in MAP infection in cattle (Table 4.2). Positional candidate genes more recently investigated include CD209 molecule (CD209, formerly CLEC4L) and C-type lectin domain containing 7 (CLEC7A).
Both CD209 and CLEC7A encode C-type lectin receptors, which are involved in pathogen recognition. The CD209 gene encodes a protein called DC-SIGN, which can bind mannosylated lipoarabomannan that is present on many virulent species of mycobacteria (Geijtenbeek et al., 2003). Mutations within CD209 (rs4804803) have been associated (P = 0.006) with enhanced resistance to Mycobacterium tuberculosis infection in humans (Vannberg et al., 2008), cattle tuberculosis (Mycobacterium bovis; Yamakawa et al., 2008) and subclinical or latent MAP infections (P < 0.003) in Holstein cattle diagnosed using serum ELISA and histopathology (Vazquez et al., 2014; Table 4.2). Juste et al. (2018) supported these findings reporting that cattle could be placed into one of four groups in relation to susceptibility to MAP infection based on genotype combinations from a set of five SNPs, including one associated with CD209 (rs210748127).
Like the CD209 protein, the CLEC7A protein has been associated (P < 0.01) with M. tuberculosis infection and interacts with TLR2 to induce pro-inflammatory responses within macrophages in response to M. tuberculosis infection (Yadav and Schorey, 2006). Two studies in cattle have associated mutations within CLEC7A with MAP infection (Pant et al., 2014; Kumar et al., 2019; Table 4.2). In a Holstein study, Pant et al. (2014) identified a missense mutation within CLEC7A (rs41654445) associated (P = 0.008) with resistance to MAP infection. Kumar et al. (2019) validated the association of rs41654445 (P < 0.0001) and identified a nearby mutation within the 5' untranslated region of CLEC7A (rs110353594) associated (P = 0.0007) with resistance to MAP infection in Holstein, Sahiwal, Tharparkar and Vrindavani crosses. The Kumar et al. (2019) study confirmed the importance of CLEC7A in host susceptibility to MAP infection as well as the usefulness of this marker for genomic selection.
ńë î
Table 4.2. List of candidate genes investigated for association with Mycobacterium avium subsp. paratuberculosis (MAP) infection in domestic ruminants.
H.L Neibergs and J.N. Kiser
Continued
Table 4.2. Continued
Continued
| Candidate gene | Species (reeds) a bc | Diagnostic usedd | MicrosateIIiteZSNPe | Significance* | Citation |
| WNT2 | Bovine (HO) | ELISA-S Culture - F | rs43390642 | P = 0.013 | Pauciullo etal. (2015) |
aGattIe breeds are abbreviated as follows: Angus - AN, Brahman - BR, Brown Carpathians - BG, East Anatolian Red - EAR, East Anatolian Black - EAB, Holstein - HO, Jersey -JE, Kosi - KO, native Indian - NI, Pinzhauer - PI, Polish Red - PR, Sahiwal - SA, Simmental - SI, Slovak Spotted - SS, Tharparkar-TH, Vrindavani -VR. Crossbreds are denoted with an X after the main breed code.
bSheep breeds are abbreviated as follows: Merino - ME, Sarda -SAR.
cGoat breeds are abbreviated as follows: Attappady BIack-AB, Garfagnina - GA, Jamunapari - JAM, Malabari - MA, unknown - UNK. Crossbreds are denoted with an X after the main breed code.
dSampIe types used for testing are abbreviated as follows: faecal - F, milk - M, serum - S, tissue - T. Diagnostic testing method abbreviations are: agar gel immunodiffusion test - AGID, enzyme-linked immunosorbent assay - ELISA, interferon-gamma assay - IFN-γ, polymerase chain reaction - PCR.
eMicrosateIIites are denoted with an *.
fOdds ratios, denoted with ^, are listed instead of P-values when P-values were not listed in the referenced study.
H.L Neibergs and J.N. Kiser
4.2.4 Pathway and gene set analyses
Pathway analysis seeks to identify genes or molecules that interact with one another to complete a physiological function. This analysis can combine genomic association data, gene expression data and proteomic data to generate a list of genes or proteins of interest and understand how they interact in relation to chemical or biological systems. A commonly used pathway analysis software is Ingenuity Pathway Analysis (IPA; Kramer et al., 2014). In IPA, pathways or networks consist of a group of molecules, genes, proteins, chemicals, etc., which have been grouped together through a highly curated database known as the IPA Knowledge Base, which examines literature to elucidate the functions and relationships of the molecules, genes, proteins and chemicals in the pathways. The goal of performing an IPA is to identify how genes or proteins of interest fit into the larger biological process through identifying pathways and regulators related to the input data.
In cattle, multiple studies have used IPA to investigate pathways associated with MAP infection (Motiwala et al., 2006; MacHugh et al., 2012; Maattanen et al., 2013; David et al., 2014; Shin et al., 2015; Malvisi et al., 2016). Most of these studies experimentally infected cattle (Maattanen et al., 2013; David et al., 2014) or cattle macrophages (Motiwala et al., 2006; MacHugh et al., 2012) with MAP and then performed gene expression analyses between cattle or cells that were infected and healthy. However, two studies (Shin et al., 2015; Malvisi et al., 2016) investigated gene expression differences between cattle naturally infected with MAP rather than cattle that were experimentally challenged. All of the pathway analyses studying MAP infection in cattle identified pathways with functions relating to the immune system. Most commonly, pathways were associated with cell death (MacHugh etal., 2012; David etal., 2014), lipid metabolism (Shin et al., 2015; Malvisi et al., 2016) or lymphocytes (MacHugh et al., 2012; David et al., 2014; Malvisi et al., 2016).
An alternative to pathway analysis that uses gene expression data is gene set enrichment analysis (GSEA) or gene set enrichment analysis-SNP (GSEA-SNP) when SNP data from an association analysis are used in lieu of gene expression data. In GSEA-SNP, SNPs are used as proxies for genes to identify gene sets that are enriched for susceptibility to MAP infection and the leading edge genes that are responsible for that enrichment. Gene sets are similar to pathways that share a common function. Leading edge genes are those genes that are associated with MAP susceptibility within the gene set. The GSEA-SNP method aims to identify leading edge genes with modest individual effects that collectively have a large effect. A GWAS may miss modest effect genes that are identified in a GSEA- SNP. Currently, the gene sets are based on data collected on humans, mice and rats, which may have different gene functions and gene pathways than in ruminant species, although many genes have conserved functions across species.
The first GSEA-SNP investigated in cattle for paratuberculosis tested for gene sets enriched for MAP susceptibility using the presence of tissue infection and faecal shedding in Holstein cattle (Neibergs et al., 2010). While no gene sets were associated with faecal shedding, a single gene set from the Gene Ontology (GO) database, positive regulation of cell motion (GO:0051272), was associated with MAP tissue infection (normalized enrichment score (NES) = 1.77) (Neibergs et al., 2010). This enriched gene set contained five leading edge genes (EDN2, ACTN4, TDGF1, PIK3R1 and TGFB2) with functions relating to the immune response that were associated with MAP tissue infection.
A second GSEA-SNP investigated susceptibility to MAP tissue infection in two Holstein populations, including a population that had been evaluated in the Neibergs et al. (2010) study (Kiser et al., 2018). Between the two populations, Kiser et al. (2018) identified 13 gene sets (NES >2.5) and 117 leading edge genes that were associated with MAP tissue infection. The 13 leading edge genes had functions that related to nuclear factor κβ (NFKB). The NFKB protein is an essential regulator of intestinal inflammation (Wullaert et al., 2011; Liu et al., 2017), and has been associated with other mycobacterial diseases such as tuberculosis (Bai et al., 2013) and leprosy (Wambier et al., 2014).
A third GSEA-SNP by Del Corvo et al. (2017) investigated gene sets associated with MAP infection in Holsteins using serum ELISA diagnostics to determine disease presence. This study identified a single enriched gene set, embryogenesis and morphogenesis (NES = 1.58; G0:0009 790), that contained eight leading edge genes (Del Corvo etal., 2017). Four of these genes had functions relating to the general immune response to infection: APLP2, PGM3, ATP5A and GTF2I(Del Corvo et al., 2017). There were no leading edge genes common between the three GSEA-SNP, and only two (TGFB2 and PIK3R1) were common to Neibergs et al. (2010) and Kiser et al. (2017). Another potential reason for the lack of further validation between the three studies could be the differences in diagnostic tests, as Del Corvo et al. (2017) used a serum ELISA and both Neibergs et al. (2010) and Kiser et al. (2017) used culturing of tissue to determine the presence of MAP.
The identification of pathways, gene sets and leading edge genes associated with the immune system and different mycobacterial species could provide additional insight into the pathogenesis of mycobacterial diseases, new targets for treatments and the potential to better identify at-risk populations. While no GSEA-SNP has been conducted in other ruminant species, those performed in cattle have illustrated the potential of utilizing this method to reanalyse previous data to uncover more information about the disease process and discover additional candidate genes for further research.
4.3