Influence of intellectual capital on financial performance in real estate and property subsector companies
T. Jaya & S. Setiawan
Sekolah Tinggi Ilmu Ekonomi, Bandung, Indonesia
ABSTRACT: Science-based economic developments encourage companies to improve the management of their intangible assets such as intellectual capital.
The purpose of this study was to determine the effect of intellectual capital consisting of three basic elements, namely Value Added Capital Employed (VACA), Value Added Human Capital (VAHU), and Structural Capital Value Added (STVA) on the performance of Return on Assets (ROA) on real estate & property companies listed on the Indonesia Stock Exchange (IDX) for the period of 2014-2016. This type of research is quantitative research with secondary data sourced from financial statements. Data analysis in this study used the method of multiple regression analysis. Data testing used the SPSS version 22 application. The results showed that VACA, VAHU, and STVA simultaneously affected 61.80% ROA, VACA affected 47.75% ROA, VAHU affected 50.41% ROA, and STVA did not affect ROA.1 INTRODUCTION
In general, guidelines are used as a benchmark for investors to invest in terms of their financial performance. In terms of attracting investors, companies must have a consistent and good final performance. Financial performance is an illustration of the success of the company in various activities (Fahmi 2012). Economic progress, technological innovation, and competitive levels have an impact on companies to improve their financial performance. Competition makes companies change their business strategies based on workforce into knowledge-based business strategies (Oktavianti & Wahidahwati 2014). Science-based economic development encourages companies to improve the management of intangible assets.
The success of the company today is not only produced by tangible assets but the most important is how to manage intangible assets to provide added value and excellence to the company (Mashali 2018).
One such intangible asset is intellectual capital. The phenomenon of intellectual capital in Indonesia began to develop after the emergence of PSAK No.19 concerning intangible assets (Yuniasih 2010). Pulic (1998) developed a model as a solution designed to provide information about the value creation of tangible assets and intangible assets owned by the company. This model is called “Value-Added Intellectual Coefficient (VAIC)”. The main components of VAIC are Capital Employed, Human Capital, and Structural Capital owned by the company. Based on the Global Industry Classification Standards (GICS) in Woodcock & Whiting (2009), a real estate & property subsector company, belonging to one of the Intensive High-IC Industry classifications, is an Intellectual Capital-intensive company. Therefore, effective management of intellectual capital is needed by real estate and property subsector companies to encourage growth in the company’s financial performance.Based on the above phenomenon, researchers are interested in knowing how the influence of intellectual capital is on the company’s financial performance. The company’s financial performance will be measured using one of the profitability ratios of Return on Assets (ROA). ROA is a profitability ratio that can show management effectiveness in using total assets (both tangible and intangible assets) owned by the company to generate profits (Devi et al. 2017). Like previous studies conducted by Ramadani et al. (2014) which examined the effect of Intellectual Capital on the financial performance of banking companies listed on the Indonesia Stock Exchange (IDX) in 2010-2012, this study will examine the effect of Intellectual Capital on the company’s financial performance in real estate and property subsectors listed in IDX in the period 2014-2016. Based on the situation, the purpose of this study was to examine and analyze the influence of intellectual capital on financial performance in the real estate subsector and property listed on the IDX for the period 2014-2016.
1.1 Intellectual capital
Intellectual capital is a form of intangible assets that are very important for the company. Intangible assets are a combination of intellectual and human-centered markets that enable companies to function. Intellectual capital is the key to the success of the company (Bontis 1998). Without intellectual capital, the company will not be able to run its business even with abundant assets because basically people use all these assets to achieve company goals (Baroroh 2013). According to Ulum (2008), intellectual capital is divided into three components. The first component that becomes a major part of intellectual capital is Human Resources. Human resources are a source of knowledge, skills, and competencies in an organization or company. Customer Capital or Relational Capital is the second component of intellectual capital which is the company’s ability to interact with outside parties. The final component of intellectual capital is Structural Capital which is the ability of an organization or company to create routine processes and structures that support employee efforts to produce optimal performance.
1.2 Value-Added Intellectual Coefficient (VAIC)
The measurement model developed by Pulic (1998) is designed to provide information about the efficiency of the value creation of tangible assets and intangible assets owned by the company. The VAIC™ model measures the efficiency of Intellectual Capital in creating value based on the relationship of its three main components that use Value- Added Capital (VACA), which gives an idea of how much added value is created from management. Physical capital is in the form of financial capital and tangible assets such as buildings, land, equipment, and technology used for company operations. Value-Added Human Capital (VAHU) identifies the ability of the workforce to generate added value for the company from the funds spent on labor and Structural Capital Value Added (STVA) shows the value-added efficiency of Structural Capital which includes procedures, routines, and systems within the company in value creation.
1.3 Financial performance
According to Utomo (2014), financial performance is the achievement of something that is always measured by the company by using various measuring instruments in order to increase the effectiveness and efficiency of the company in generating income for the survival of the company. Ross et al. (2009) states that ratio is one of the financial analysis tools used for comparing and investigating the relationships that exist between various parts of financial information, such as are liquidity, solvency, profitability, activity, and market ratio. Financial performance is evaluated in three dimensions. The first is the productivity of the company or the process of processing inputs into output efficiently. The second is the dimension of profitability or the level of corporate income that exceeds costs. The third dimension is the market premium or the level of the company’s market value that exceeds the book value (Iswati & Anshori 2007). According to Hery (2016), profitability is the ratio used to measure a company’s ability to generate profits from its business operations. The business operational goal for most companies is to maximize profits, both short and long term.
1.4 Returnonassets
One type of profitability ratio is Return on Assets (ROA). ROA is the ratio between net income after tax and the number of assets that describes the rate of return of all assets owned by the company. According to Cashmere (2012), ROA is the result of the number of assets used in the company and can provide a good measure of company profitability because it shows management effectiveness in using assets to earn revenue.
1.5 Research hypothesis
In this research, there are four hypotheses, namely:
1) Value-Added Capital Employed (VACA), Value- Added Human Capital (VAHU), and Structural Capital Value Added (STVA) affect company’s financial performance (ROA).
2) Value-Added Capital Employed (VACA) affects company’s financial performance (ROA).
3) Value-Added Human Capital (VAHU) affects company’s financial performance (ROA).
4) Structural Capital Value Added (STVA) affects company’s financial performance (ROA).
2 RESEARCH METHOD
This research is causal explanative to test and analyze the effect of causal relationship of intellectual capital on financial performance in the real estate and property subsectors listed on the IDX for the period 2014-2016. The sampling technique in this study uses non-probability sampling, namely purposive sampling with the following criteria:
Table 1. Sample criteria.
No Sample criteria
1. Company subsector real estate & property listed on Indonesia Stock Exchange before 2014
2. Company subsector real estate and property subsector that consistently published financial statements for the period 2014-2016
3. Company subsector real estate and property that presents financial statements in Rupiah
Based on the techniques and sampling criteria, the samples used were 41 companies. Secondary data collection techniques in this study are literature studies. Data were collected using data sources from the IDX (www.idx.co.id). The collected data is processed and analyzed using SPSS Statistics.
2.1 Outliertest
The outlier test in this study used the Mahalanobis Distance method. The decision criteria with the Mahalanobis Distance method are if the Mahalano- bis distance is ≤X2. The value of X2 is obtained by looking at the Chi-Square table at the level of p = 0.001 is 13.82. In accordance with the decisionmaking criteria, there are 4 companies with Mahala- nobis Distance values greater than 13.82. The list of 4 companies is Fortune Mate Indonesia Tbk (FMII), Nirvana Development Tbk (NIRO), Greenwood Sejahtera Tbk (GWSA), and Lippo Cikarang Tbk (LPCK). The sample used in this study became 37 companies.
2.2 Normality test
Data normality test in this study uses the Lilliefors test method with the following results:
Table 2. Lilliefors test.
| Kolmogorov-Smirnova | |||
| Statistic | df | Sig. | |
| ROA | 0.070 | 111 | 0.200* |
(Source: Output SPSS 22, 2018)
Table 2 shows the significance value of the Lillie- fors test is 0.20 which means that the value is greater than 0.05. In accordance with the testing conditions, it can be concluded that the regression model in this study is normally distributed.
2.3 Multicollinearity test
In this study, multicollinearity tests used Variance Inflation Factor (VIF). A good regression model is free from multicollinearity on the basis of decisionmaking, i.e., if the tolerance value is 10, 0.10, or the VIF value is ≤10. Based on these results, multicollinearity does not occur (Satiti & Asyik 2013). The results of the multicollinearity test are as follows:
Table 3. Multicollinearity test.
| Model | Collinearity Statistics | |
| Tolerance | VIF | |
| VACA | 0.648 | 1.543 |
| VAHU | 0.632 | 1.582 |
| STVA | 0.968 | 1.033 |
(Source: Output SPSS 22, 2018)
According to the criteria above, it can be concluded that the independent variables in this study are free from multicollinearity.
2.4 Heteroscedasticity test
The heteroscedasticity test in this study uses the Glejser test on the basis of decision-making. If the significant value between independent variables with absolute residual values is more than 0.05, it can be concluded that there is no problem of heteroscedasticity. The results of the heteroscedasticity test are as follows:
Table 4. Multicollinearity test.
| Model | Sig. |
| (Constant) | 0.000 |
| VACA | 0.744 |
| VAHU | 0.686 |
| STVA | 0.409 |
(Source: Output SPSS 22, 2018)
According to the criteria, then it can be concluded that there is no heteroscedasticity problem.
2.5 Autocorrelation test
The autocorrelation test used in this study is the Durbin-Watson test with the following results:
| Table 5. | Autocorrelation test. | |
| Model | Std. Error of the Estimate | Durbin-Watson |
| 1 | 0.02984 | 2.032 |
(Source: Output SPSS 22, 2018)
Based on Table 5, the Durbin-Watson value was 2.032 after the previous Cochrane-Orcutt test. Through the Durbin-Watson table, the value of du is found to be 1.7472 and the value of dl is 1.6355, so du < d < 4-du (1.7472 < 2.032 < 2.2528). After the comparison between the results was calculated with du and dl, it can be concluded that there is no autocorrelation in this study.
This test aims to determine whether the independent variables simultaneously affect the dependent variable. The results of simultaneous data testing (F- test) is shown in Table 6:
Table 6. F-test (Anova).
| Model | F | Sig. |
| Regression | 60225 | .000 b |
| (Source: Output SPSS 22, 2018) | ||
Table 6 shows a significance value of 0.000, which means that the value is less than 0.05. It can be concluded that independent variable consisting of VACA, VAHU, and STVA influence simultaneously on dependent variable that is ROA.
This test aims to determine whether the independent variables individually have an influence on the dependent variable. Partial data test results (/-test) is shown in Table 7:
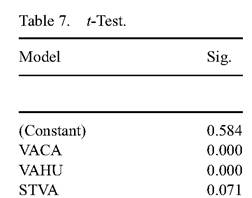
(Source: Output SPSS 22, 2018)
Table 7 shows that the VACA variable has a significant value of 0.000. The VAHU has a significance value of 0.000 and the STVA has a significance value of 0.071. VACA and VAHU values significance is smaller than 0.05, while the value of STVA is greater than 0.05. Thus, it can be concluded that the independent variables that have an influence on the dependent variable ROA are the VACA and VAHU variables.
3 RESULTS AND DISCUSSION
The coefficient of determination aims to measure how far the ability of independent variables is effective in explaining the dependent variable. The ability of independent variables simultaneously in describing the dependent variable is shown in Table 8:
1) VACA, VAHU, and STVA simultaneously affect the financial performance of ROA of 61.80%.
2) VACA affects the company’s financial performance of ROA of 47.75%.
3) VAHU affects the company’s financial performance of ROA of 50.41%.
4) STVA does not affect the company’s financial performance of ROA.
Based on the testing of the data that has been done, the results of this study indicate that the added value generated from intellectual capital consisting of financial capital, quality human resources, and existing infrastructure in the company can affect the company’s financial performance in this study using ROA as a measure of the company’s financial performance. This shows that with the development of a science-based economy, management of intangible assets, namely intellectual capital, is important. The results of the study show that intellectual capital can affect the profitability of the company. Companies need to have heterogeneous intellectual capital in order to provide unique characteristics that can create competitive advantages that other companies do not have.
The results of the study show that Human Capital is the most important component of Intellectual Capital. Investment in training in Human Resources is an important investment and has economic value for the company because it can increase productivity. Productive Human Resources with a high level of creativity, expertise, knowledge, and experience can be a potential element for companies to increase their profitability. Human Resources will increase if the company is able to explore and utilize the knowledge of its employees to the fullest. In addition, the company also requires Capital Assets as support to realize the ideas of its employees to create innovative projects. Therefore, Human Capital and Capital Asset are two important components that must be managed and utilized efficiently and effectively so that the company’s goals to obtain high profits can be achieved.
Table 8. Coefficient of determination.
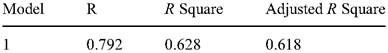
(Source: Output SPSS 22, 2018)
Table 8 shows that when the value of Adjusted R2 is 0.618, then a yield of 61.80% (0.618 ? 100%) is obtained, which explains that simultaneous independent variables consisting of VACA, VAHU, and STVA can explain the dependent variable ROA with a yield of 61.80%. From the results of hypothesis testing using multiple regression analysis, some conclusions can be drawn as follows:
REFERENCES
Baroroh, N. 2013. Analysis of Intellectual Capital Influence on Financial Performance of Manufacturing Companies In Indonesia. Journal of Accounting Dynamics 5(2): 172-182.
Bontis. 1998. Intellectual Capital: An Explanatory Study That Develops The Steps and Models. Management Decision 36(2): 63-76.
Cashmere. 2012. Financial Statement Analysis. Jakarta: PT. Raja Grafindo Persada.
Devi, B. E., Khairunnisa, K. & Budiono, E. 2017. The Influence of Intellectual Capital on The Company’s Financial Performance. E-Proceeding of Management: 491-500.
Fahmi. 2012. Financial Performance Analysis. Alfabeta.
Hery. 2016. Financial Ratio For Business. Jakarta: PT Grasindo.
Iswati, S. & Anshori, M. 2007. The Influence OfIntellectual Capital to Financial Performance at Insurance Companies in Jakarta Stock Exchane JSE. Proceeding of the 13th Asia Pacific Management Conference, Melbourne, Australia: 1393-1399.
Mashali, F. 2018. Intellectua Capital Effect On Financial Performance and Corporate Market Values Empirical Study in the Company which contains in the LQ45 Index on the Indonesia Stock Exchange 2013-2016. UNPAS Repositories and Scientific Journal.
Oktavianti, H. & Wahidahwati. 2014. Factors affecting intellectual capital disclosure. Journal of Accounting Science & Research: 1-18.
Pulic. 1998. Measuring the performance of intellectual potential in knowledge economy. Retrieved from www. vaic-on.net.com.
Ramadani, V., Rexhepi, G., G¸rguri-Rashiti, S., Ibraimi, S. & Dana, L.P. 2014. Ethnic entrepreneurship in Macedonia: the case of Albanian entrepreneurs. International Journal of Entrepreneurship and Small Business 23(3): 313-335.
Ross, S., Westerfield, R. & Jordan, B. 2009. Introduction to Corporate Finance. Jakarta: Salemba Empat.
Satiti, A. & Fun, N.F. 2013. The Influence of Intellectual Capital on Financial Performance of Insurance Companies. Journal of Accounting Science & Research 2(7): 1-20.
Ulum, I.M. 2008. Intellectual Capital Performance of Banking Sector in Indonesia. Journal of Accounting and finance 10: 77-84.
Utomo, T.A. 2014. Influence of Good Corporate Governance Mechanism on Financial Performance Empirical Study on Manufacturing Company Listed In Indonesia Stock Exchange Year 2010-2012. Diponegoro Journal Of Accounting 3(3).
Woodcock, J. & Whiting, RH 2009. Intellectual Capital Disclosures by Australian Companies.
Yuniasih, N.D. 2010. Exploration of Company Market Performance: Review by Intellectual Capital.