Investment behaviour in manufacturing companies in Indonesia: Study on leverage, company growth, and cash holding
A.C. Nugroho & A. Rizki
APP Polytechnic Ministry of Industry, Jakarta, Indonesia
N.A. Nasution
Master Student in Sustainability and Business, University of Leeds
ABSTRACT: Decision in investment is critical for company’s performance, competitiveness, profitability and their survival.
This study was aimed to demonstrate empirically how manufacturing company’s leverage and growth affect their investment decision in Indonesian context. This study utilized annual financial statements of companies in the manufacturing sector listed on the Indonesia Stock Exchange (BEI) within the period of 2007 to 2016. The results of analysis showed that leverage has a control function on management. Company growth has positive effect on the investment. Meanwhile, free Cash Flow has negative impact on investment that can be proven by their cash holding behaviour. In addition, this study demonstrated that the companies’ growth rate does not strengthen nor weaken the effect of leverage on the investment decisions of the manufacturing companies in Indonesia. The fact is assumed to be happened due to the financial constraint issues when the company intended to perform external financing for their investment in Indonesia.1 INTRODUCTION
Manufacturing company investment behaviour is different from companies in other sectors. Investment behaviour of these manufacturing companies tends to be less affected by regulation, different from finance company, and the nature of the activities that are different from utility companies (Aivazian et al. 2003).
Investment projects can be operational or have a strategic focus. In strategic investments, usually large amounts of investment, involving high levels of risk, produce results that are difficult to measure, and have a significant long-term impact on company performance (Alkaraan & Northcott 2006).
Wrong investment decisions can negatively impact the company over the long term, not just in short term.Various studies on investment decisions in companies within the agency theory framework in manufacturing firms have been conducted, particularly on the topic of leverage influence as a firm’s control. But the studies haven’t yielded consistent results. This indicates the existence of different corporate condition characteristics or environment.
Indonesia manufacturing companies are experiencing financial constraints that affect their investment behaviour (Ajide 2017, Prasetyantoko 2007). With this financial constraints condition, Indonesian manufacturing companies become an interesting object to be investigated in terms of its leverage relationship with and company growth influence on investment decision.
The investment decisions are important because they will affect future conditions on both macro and micro environmental levels. On the macro environmental level, Kiel et al. (2014) stated that investment in infrastructure of transportation can affect the competitiveness of a region whereas on the micro environmental level. The investment itself is divided into intangible and tangible investments. Investments in intangible assets including investments in training and advertising and these will increase the company market values (Zambrano et al. 2017). Similarly, in investment in tangible assets, investment decisions are important as they will affect the company value (Andreou et al. 2017, Vranakis & Chatzoglou 2012).
Optimizing the company value can be achieved through the implementation of proper financial management. The financial decision taken will affect other financial decisions and have an impact on the company value (Fama & French 1998). Study on investment decisions conducted by Fama & French (1998) and Chen et al. (2014) revealed that the company investment decisions significantly affected the company performance as they responded positively to better investments and profits from investments increased the company profitability.
Having the same sound, Aivazian et al. (2003) and Lang et al. (1996) stated that one of the important aspects in the company is investment decision and the decision made by the company is important for the company competitiveness. Savolainen et al. (2017) pointed out that the choice of financial structure is essential to maximize shareholder value.
According to Firth et al. (2012), in addition to shareholders, there is also a debt-holder who will monitor the company performance and business decisions of the company including investment decisions with the existence of leverage. The agency problem in Aivazian et al. (2003) is “over-investment” because of the conflict between management and shareholder. Managers have a tendency to scale-up their company expansions and pay less attention to their future company value after investments. More-over, they also take unnecessary or poor investment projects that may reduce shareholder wealth. The management ability to implement the policy is limited by the availability of cash flow and this constraint can be further minimized through leverage. By issuing its debt, the company has to pay interest and principals that put pressure on that management so that it will not allocate the company funds for poor investment projects.
Accordingly, in their studies, Anwar & Sun (2014), Aivazian et al. (2003), and Guney et al. (2011) stated that leverage affected investment decisions. Jensen (1986) and Stulz (1990) predicted a negative relationship between leverage and investment but emphasized that this might be beneficial to shareholders in low- growth companies, as managerial flexibility over debt limits exceed free cash flow.
According to Lang et al. (1996), management uses leverage based on private information on the future company growth. The existing capital structure literature suggests that managers in companies with good company growth opportunities should prefer lower leverage because the companies will not be able to take advantage of investment opportunities if they have to raise funds from outside.
In company investment decisions, the growth variable of the company is an indicator that is noticed by manager (agent), debt-holder, and shareholder. Aivazian et al. (2003) and Lang et al. (1996) used Tobin Q as a measure of company growth. The Tobin Q variable has been used much earlier as a control variable in the regression model which sees the company growth effect on company investment and this variable was used by Jiang et al. (2015), Firth et al. (2012), Giroud & Mueller (2011), Chen et al. (2013), Aivazian et al. (2003), and Lang et al. (1996).
According to Aivazian et al. (2003), the ratio of Tobin Q serves as a proxy for easy access to capital markets. The companies with high growth can be easier to refinance and recapitalize in the capital market. In this capital market, investors (debt-holders and shareholders) will pay attention to the company Tobin Q when the company takes investment decisions. Meanwhile, Aivazian et al. (2003) and Lang et al. (1996) had conducted studies showing that the variable of company growth rate will assess the effect of over-investment or under-investment on the company investment.
Given the presence of interest cost and creditor supervision, management will be more cautious in investing (Anwar & Sun 2014, Guney et al. 2011, and Aivazian et al. 2003). Leverage is often used to prevent over-investment and increase control over the company management.
In regards to the presence of leverage, there is a conflict among shareholders, management and debtholder, and this conflict can be examined through the agency theory. Nonetheless, there are also different results from the research on agency theory in capital structure as conducted by Banga & Gupta (2017) in businesses in India stating that the leverage determination was affected by the implementation of pecking order and trade off theories, however, there is no evidence of agency theory. Furthermore, the empirical results of the research by Dawar (2014) in India highlighted that the leverage had a negative effect on the financial performance of Indian companies, contradicting the assumption of agency theory as it is generally accepted in both developed and developing countries.
Although a number of studies have shown that leverage has an effect on investment, there are still in-consistent results. As revealed in the research by Ajide (2017) showing that the leverage does not affect company investment and the study also showed that Tobin Q had a negative effect on the company investment; however, this result was inconsistent with studies conducted by Aivazian et al. (2003) and Lang et al. (1996) in which the Tobin Q had a positive effect on the company investment.
The research results of Aivazian et al. (2003) and Lang et al. (1996) showed that the company diversification based on the company growth rate affected leverage on company investment. Nevertheless, this is different from the current research results that do not indicate any effects of the company growth rate and this is presumably due to the financial constraints.
This is in accordance with Ajide (2017) stating that the presence of financing constraints will affect the company-specific effect on the decision making on the company investment. Meanwhile, Prasetyan- toko (2007) stated that in Indonesia, some financial constraint issues come up; therefore, the research became interesting as it was conducted in Indonesia in which there were issues of financial constraint occurring as the companies who intended to invest using leverage. Subsequently, empirical proofs are required for this matter.
2 RESEARCH OBJECTIVES
Despite the importance of company investment decisions, there were inconsistencies from the previous researches on the leverage and company growth effect on investment decisions as well as the presence of financial constraints in Indonesia. Therefore, this research was necessary to be conducted. The objectives of this research were to analyze the effect of leverage and company growth on investment decisions and to further analyze whether the growth rate of the company would have an effect on leverage functioning as the management control.
3 THE RELATIONSHIP BETWEEN
LEVERAGE, GROWTH, AND INVESTMENT
Aivazian et al.
(2003) examined the impact of financial leverage on company investment decisions by using information obtained from the Canadian industrial companies. The results showed that leverage was negatively related to investment and this negative effect was significantly stronger for companies with low growth opportunities compared to high growth opportunities. Jensen (1986) and Stulz (1990) predicted a negative relationship between leverage and investment; nonetheless, they emphasized that this might be beneficial to shareholders in low-growth companies as the managerial flexibility over debt limits exceeds free cash flow.According to Firth et al. (2012), in addition to shareholders, there were also debt-holders who monitored the company performance and business decisions including investment decisions due to leverage. Firth et al. (2012) examined the relationship of cash inflows and financing channels for listed companies in China. The results show that negative investments are related to low cash flow rates, yet they were positively related to high cash flow rates. These results are consistent with those reported by Cleary et al. (2007) for companies in the US and by Guariglia & Yang (2015) for those in the UK.
Lang et al. (1996) conducted a study using pooling regressions and putting aside the effect of individual companies. The results found that pooling regression tended to ignore the impact of leverage on investment and most appropriate fixed-effect model specification. The results showed that leverage had a significant negative impact on investment for Canadian companies and had a strong negative impact on companies with low growth opportunities.
Dawar (2014) examined agency theory by examining the effect of capital structure on company performance in the emerging economy country of India using the data panel. The empirical results indicated that leverage had a negative effect on the financial performance of Indian companies, as opposed to the assumption of agency theory as it is generally accepted in developed and developing countries. Consequently, agency theory postulate should be examined through different perspectives in India considering the market basic characteristics and the dominance of state-owned banks on lending for the company sector.
Aivazian et al. (2003) and Lang et al. (1996) utilized Tobin Q as a measure for company growth. According to Aivazian et al. (2003), Tobin Q defines the market value of the company total assets divided by the book value of total assets as a proxy of the company growth opportunities. Lang et al. (1996) used Tobin Q as a control variable for growth measures. Companies with higher Q values have better growth opportunities as argued by Lang et al. (1996). In contrast, the low Tobin Q ratio indicates that the company does not have good investment opportunities for new investors. Therefore, Tobin Q is utilized as a proxy of company growth.
McConnell & Servaes (1990) examined the non- financial corporations in the US in 1976, 1986, and 1988. His research divided the samples into two, the company with a strong growth opportunity and the company with a weak growth opportunity. The results show that the company value is negatively correlated with leverage for the company with a strong growth opportunity (as indicated by high Tobin’s Q) and positively correlated with leverage for the company with a weak growth opportunity (as indicated by the low Tobin Q value).
According to Aivazian et al. (2003), companies with high Q scores (those with strong growth prospects) have higher cash flow expectations or net assets and can reduce the moral risks and adverse selection issues inherent in the credit supply to companies in the capital market. Companies with high growth can more easily refinance and recapitalize in the capital market, while in companies with low Q values, leverage will become more stringent constraints and limit the investment; as a result, companies will face difficulties in recapitalizing due to their weak growth prospects.
High Tobin Q value reflects better company performance in the market and reflects the company’s prospects in the future so that it is easier to get funding from external parties (Brigham & Gapenski 1996). Thus, high Tobin’s Q value tends not to encounter financial constraints.
According to Fazzari et al. (1988), the presence of asymmetric information related to external funding sources will cause external funding costs to be higher than internal funding, resulting in financial constraints in which they lack access to external funding. Due to this limitation, investment decisions of companies tend to be sensitive to cash flow. Myers (1977) showed that with a high level of leverage, a positive net present value project (NPV) could not be funded due to the emergence of debt overhangs from the previous debt financing.
Companies in investment funding can obtain funds through internal and external funds. Leverage is used by corporations as external funding, which is proven by various studies related to the investment decisions, has an impact on management control functions on investment decision. If company use leverage, the management will be more selective on their investment decision and will make sure that their investment decision will have a positive impact on company profit. Based on this result, leverage predicted will have a negative impact on corporate investment. Company that has a high growth will have greater possibilities to get capital funding for company investment. Based on studies on relationship between company growth and investment, it can be concluded that company growth will have a positive effect on corporate investment. However, Indonesian cases with the financial constraint occur in manufacturing company give room for improvement on the present study. This
condition is never in consideration in previous studies. With this condition, it is expected that there will be difference result in this analysis. In this case, the impact of leverage, company growth, and interaction both of leverage and company growth on investment decision will be different compared to the previous studies.
4 RESEARCH METHOD
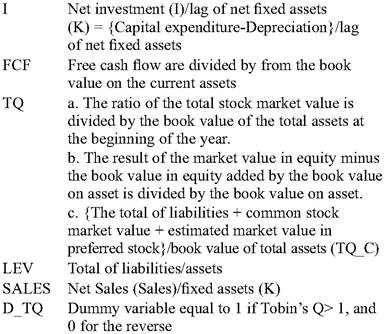
This study used annual financial statements of 50 companies in the manufacturing sector listed on the Indonesia Stock Exchange (BEI) within the period of 2007 to 2016 as data to be investigated. Fifty companies were selected through sorting/selection process with several criteria. The criteria cover: the companies have completeness of financial statement data, they are listed on ISE within the period of 2007 to 2016 and they have a positive profitability. We employed panel data regression to analyze the data in which investment was used as the dependent variable while leverage, cash flow, sales, and Tobin-Q were used as the independent variables. The definitions of these variables are further described in Table 1.
Three types of Tobin Q measured were used in this study. This research used Tobin Q as the proxy of the company growth. A number of Tobin Q were utilized to examine the robustness of the Tobin Q effects on the company investment. Tobin Q was distinguished by its method of calculation. TQ-a is a calculation of Tobin Q based on Jiang et al. (2015), Firth et al. (2012), and Giroud & Mueller (2011). Meanwhile, TQ-b is a calculation of Tobin Q based on Chen et al. (2013), Fazzari et al. (1988), Whited (1992), Baker et al. (2003), and McLean et al. (2012). Lastly, TQ-c is a calculation of Tobin Q based on Aivazian et al. (2003) and Lang et al. (1996).
Table 1. Thevariablemeasurements.
Variable Note
5 RESULTS AND DISCUSSION
5.1 Descriptivestatistics
The descriptive statistical analysis of this research was obtained from the data from the 50 manufacturing financial report from 2008 until 2016. The following is the result of the statistical descriptive variables presented in Table 2.
Table 2 presents the descriptive statistical information for investment (I) and other variables including cash flow (CF), Tobin Q (TQ_A, TQ_B, TQ_C), leverage (LEV), and Sales (SALES). The results on Table 2 showed that the average investment of manufacturing companies in Indonesia from 2007 to 2016 was 0.1167 with a standard deviation of 0.1977. The large standard deviation value indicates that investment in the manufacturing companies in Indonesia had a high variation or diversity.
Meanwhile, the cash flow had an average value of 0.2196 with a standard deviation of 0.6195. The value of Tobin Q had a fairly good average value of more than 1 indicating that the growth opportunity of the company was relatively good, yet the high standard deviation indicates that Tobin Q value of manufacturing companies in Indonesia had a high variation or diversity. Leverage had an average value of 0.4115 with a standard deviation of 0.1738. The result highlights that the companies preferred to use their own capital (equity) rather than their liabilities as the business capital. The sales value from manufacturing companies in Indonesia from 2007 to 2016 had an average of 4.7764 with a standard deviation of 4.1694.
5.2 Effects of leverage and company growth on investment
This research used the panel data regression analysis approach to observe the effects of leverage and company growth on investment of the manufacturing companies in Indonesia. This research adopted the regression model applied by Aivazian et al. (2003). The following is the basic model of this research:
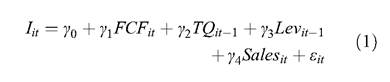
Iit is the investment of company i in the period of t; CFit is the cashflow of the company i in the period of t; TQit-1 is the lag of Tobin Q; Levit-1 is the lag of leverage; Salesit is the sales of company i in the period of t. γ0 is intercept; γ1, γ2, γ3, and γ4 are coefficient, and εit is an error term.
The above model is fitted using three different methods we consider in this study namely: pooled least square analysis (PLS), fixed equation model (FEM), and random equation model (REM). The results of the analysis are presented in Table 3. Table 3 shows that leverage is associated with all of
Table 2. The variable descriptive statistics.
| I | CF | TQ_A | TQ_B | TQ_C | LEV | SALES | |
| Mean | 0,1172 | 0,2376 | 1,2123 | 2,0267 | 1,6291 | 0,4141 | 4,8198 |
| Median | 0,0633 | 0,0954 | 0,4765 | 1,2410 | 0,9272 | 0,4101 | 3,7566 |
| Maximum | 1.5370 | 3,5846 | 17,9473 | 18,9424 | 18,6404 | 0,8940 | 34,8741 |
| Minimum | -0,2053 | -4,7697 | 0,0021 | 0,1223 | 0,2008 | bgcolor=white>0,07110,2254 | |
| Std. Dev. | 0,1986 | 0,6245 | 2,2937 | 2,3419 | 2,2855 | 0,1749 | 4,1953 |
| Std. Error | 0,0094 | 0,0294 | 0,1081 | 0,1104 | 0,1077 | 0,0082 | 0,1978 |
Table 3. Data panel regression analysis of the effect of leverage and company growth on investment.
| TQ_A | TQ_B | TQ_C | |||||||
| PLS | FEM | REM | PLS | FEM | REM | PLS | FEM | REM | |
| Intercept | 0.164*** | - | 0.180*** | 0.151*** | - | 0.166*** | 0.164*** | - | 0.180*** |
| (6.163) | - | (5.552) | (5.521) | - | (4.988) | (6.140) | - | (5.534) | |
| CF | -0.115*** | -0144*** | -0.127*** | -0117*** | -0144*** | -0.129*** | -0.115*** | -0144*** | -0.127*** |
| (-7.338) | (-7.268) | (-7.582) | (-7.503) | (-7.277) | -(7.683) | (-7.358) | (-7.268) | (-7.592) | |
| TQ | 0.012*** | 0.007 | 0.011** | 0.014*** | 0.010 | 0.013*** | 0.012*** | 0.007 | 0.011** |
| (2.906) | (0.753) | (2.215) | (3.440) | (1.052) | (2.680) | (2.932) | (0.745) | (2.232) | |
| Lev | -0171*** | -0.321*** | -0.209*** | -0171*** | -0.320*** | -0.207*** | -0.183*** | -0.328*** | -0.220*** |
| (-3.279) | (-3.196) | (-3.298) | (-3.283) | (-3.194) | (-3.291) | (-3.506) | (-3.269) | (-3.482) | |
| Sales | 0.008*** | 0.010 | 0.008*** | 0.008*** | 0.010*** | 0.008*** | 0.008*** | 0.010*** | 0.008*** |
| (3.450) | (2.783) | (3.260) | (3.504) | (2.814) | (3.3055) | (3.459) | (2.782) | (3.263) | |
| Chow test | 4.66E-06 | 1.12E-05 | 4.87E-06 | ||||||
| Hausman | 2.01E-05 | 4.00E-05 | 2,09E-05 | ||||||
| test | |||||||||
| LM test | 0.1713 | 0.2065 | 0.1763 | ||||||
| R-Square | 0.122 | 0.146 | 0.130 | 0.128 | 0.147 | 0.134 | 0.122 | 0.146 | 0.130 |
This table presents the regression results of the effect of leverage and company growth (TQ) on the investment decision of manufacturing companies. T-statistics values are presented under the coefficient value. TQ A, TQ B, TQ C were differentiated based on the variable calculations of TQ as discussed in the research method.
*** Significant at the level of 1%, ** Significant at the level of 5%, * Significant at the level of 10%
the three measures of the market value. The sign and magnitude of the estimate indicate that a unit increase in company’s leverage will decrease the mean of market value by around 0.18 in the PLS model.
Based on Table 3, leverage had an effect on company investment that is in accordance with the previous research conducted by Aivazian et al. (2003). Leverage coefficient had a negative value indicating that it has a negative impact on the company investment. This finding highlights that there was an agency theory on the capital structure of the company investment. With the presence of leverage, there was a conflict of interest among debt-holders, management, and shareholders.
According to Myers (1977), leverage can have a negative effect on investment due to an agency issue between shareholders and bondholders. If managers work for the benefit of shareholders, they may provide a positive net present value due to the debt overhang. The results of this empirical research are also strengthened by the studies conducted by Lang et al. (1996), Jensen (1986), Stulz (1990), and Grossman & Hart (1982) showing that leverage has a negative effect on investment opportunities.
Tobin Q representing the company growth had a positive effect on the company investment on each Tobin Q with different methods of calculation. Tobin Q positive coefficient on the investment indicated the notion that the greater the company growth, the greater the company investment. Tobin Q ratio was measured from the market value of the company compared (shared) to its book value. Therefore, Q value became higher if the market value was higher than the book value.
A higher market value indicates that investors see a growth opportunity of the company. Higher company values are better for investors; thus, companies will find it easier to get fresh funding when they conduct a right issue. This causes Tobin Q to be the proxy for company growth affecting company investment decisions. According to Aivazian et al. (2003), differences in empirical results of the companies with high and low Q are due to the fact that Q value serves as a proxy for easy access to capital markets.
The cash flow variable had a negative effect on investment decisions of the manufacturing companies in Indonesia. This is in contrast with the results obtained by Aivazian et al. (2003) who examined Canadian companies, yet it is in line with the results obtained by Prasetyantoko (2007) and Fazzari et al. (1996). The negative cash flow coefficient value indicates that the companies prioritized funding from their operating cash flow and used funding from debts for company investment afterwards.
The negative cash flow coefficient value indicates that go-public companies in Indonesia tend to have financial constraints as argued by Prasetyantoko (2007). According to Fazzari et al. (1996), if cash flow is not sufficient for investment funding, the company will take on debts. In company investment activities, the primary funding should be from the internal funding prior to the use of external funding.
Moreover, the sales variable as the proxy of profitability in the future had a positive effect on corporate investment indicating that the greater the company sales, the greater the profitability that in turn will increase the opportunity for companies to invest. The results of this study are in accordance with Aivazian et al. (2003) research, Lang et al. (1996), and Prasetyantoko (2007) showing that sales had a positive effect on the company investment.
The analysis on the effect of leverage and company growth on investment in manufacturing companies in Indonesia in this research was conducted through data panel regression analysis. In the data panel regression, there were three methods of analysis i.e. PLS model, fixed equation model (FEM), and random equation model (REM). The Chow test was used to determine the PLS or FEM model use. Meanwhile, Hausman test was used to determine the model of FEM or REM use, and LM test was utilized to see the chosen REM or PLS model. In this study, the results of these tests show that the REM model was chosen as the overall preferred model used for analysis.
5.3 Does growth rate have effects on the relationship of leverage and company investment?
According to Aivazian et al. (2003), Zwiebel (1996), and Novaes & Zingales (1995), there is a difference in negative effects between investment and leverage in companies that have high growth and those with low growth. Therefore, interaction variables were used between company growth rate and leverage in this research model. 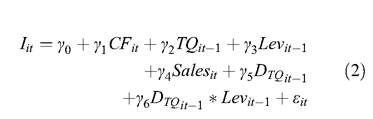
D_TQ is a dummy variable i.e. 1 if Tobin’s Q is > 1, and 0 if Tobin’s Q is bgcolor=white>-0.198**