The Concept of Public Expenditure
Public expenditures are mainly current, investment and transfer expenditures made by the public sector through the budget. The scope of public expenditures is divided into two: narrow and wide.
While public expenditures made through the central government budget are called “narrow public expenditures,” the public expenditure calculated by including the expenditures made by local administrations, social security institutions and state economic enterprises (SEE) are defined as the concept of “large public expenditure” (Mutluer et al. 2016).Public expenditures are the most important positive tool of public economy in a broad sense and of fiscal policy in a narrow sense. Because public expenditures contribute positively to the economic growth and development process, as they create purchasing power within the national economy. Therefore, the share of public expenditures in GDP is very important. Public expenditures are used as an effective tool in times of economic recession, crisis and take off. Although public expenditures, which are used in the Keynesian economic model to increase the aggregate demand function and eliminate underemployment, appear to be a bit behind in today’s liberal economic model, it appears as an important dynamic in the economy. However, public expenditure management is an expenditure policy developed within the budget management since it is the expenditure function of the budget. That is, an expenditure policy independent of revenue policy cannot be considered in the medium and long term (Allen and Tommasi 2001).
3.2.1 Public Expenditures in a Historical Perspective
Public expenditures are tools for financing the goods and services produced by the public sector. While public goods and services are financed by public expenditures, public expenditures are mainly met by tax revenues. Therefore, there is a financial proportion in the provision of public goods and services.
In the long run, public spending and tax revenues are likely to increase in a coordinated manner (Gurdal et al. 2020).When public expenditures are examined historically, it has been in a rapid increase trend since 1870 and the increase rate has slowed down after 1980. Considering the global economic growth after 1980, although public expenditures have increased nominally, their increase has slowed proportionally (compared to GDP). This is the result of the post-1980 global economic order and the implementation of liberal policies in many countries (Tanzi and Schuknecht 2000). When this policy change is evaluated periodically, as the inflationary environment emerging due to the inefficiency in collecting public revenues and public expenditures resulted in excessive budget deficits, public debt stocks increased linearly and fiscal sustainability became an urgent requirement in many countries. This led to the discussion of liberal policies as a solution tool in the mid-1970s (Buchanan 1975).
Public expenditures and tax revenues are the basic expenditures and revenues of the public sector. The state makes basic public expenditure in order to produce/provide public goods and services, and earns compulsory and sin non-quid pro quo tax revenues. However, public spending is much more important as the provision of goods and services is more important in the short term. Tax revenues, on the other hand, are increased in the medium and long term and the balance that preserves fiscal discipline is maintained. Throughout the history of the economy,
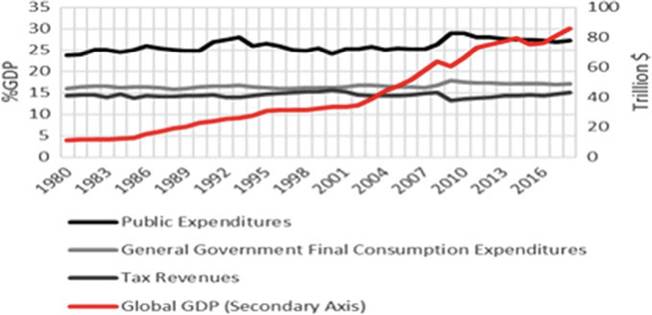
Fig. 3.1 Global GDP growth, public expenditures and public revenues by year-1980-2018 (World Average-% GDP). Source World Bank ' 2020a)
public expenditures have had an increasing trend in times of recession, disaster, war and epidemic. After the 2008 Global Economic Crisis, many countries tried to compensate the economic loss in the market with public spending packages.
As for the global public expenditure average, the public expenditure average, which was around 25% in 2007, increased and reached 29% in 2009. It was observed that there was a 20% increase in public expenditure during crisis periods. On the other hand, there was a decrease in tax revenues. The rate of tax revenues, which was around 20% in 2007, decreased to 13% in 2009. This shows that there is a 13% decline in tax revenues. The public sector, which expanded with 20% spending and lost 13% tax revenue, endured a 33% financial burden in total. This is a period in which global gross domestic product suffers a loss of 5%. The fact that the public sector is under a financial burden of 30% shows the benefit of the existence of the public sector and that liberal policies are not successful in market failures and crises, and that the public sector is in the role of “a global automatic stabilizer” with the fiscal policy tool (Horton and El-Ganainy 2020).Figure 3.1 reveals that the public expenditure break occurred in 1990s and 2008. The 1990s can be described as the cradle of global crises. Many countries encountered new generation crises that had a global spillover effect in the 1990s and tried to compensate for the economic loss caused by the crisis by means of public expenditure packages with Keynesian reactions.[VI] However, as a result of non-cyclical Keynesian policies, economic costs increased in the following periods. For this reason, Keynesian policies were used inefficiently by many countries for political purposes in the 1990s. However, in the 2008 Global Financial Crisis, Keynesian policies being using in a conjunctural manner gained importance again (Eatwell and Milgate 2011).
Figure 3.2 gives the public expenditure rates (% GDP) in selected countries as of 2018. The high share of public expenditures in GDP indicates the percentage of GDP that belongs to the public sector. The higher the rate of public expenditure in GDP, the higher the competence of the public sector in the economy.
For example, in the figure above, the public expenditure rate of France is 47%, while the rate of the United States is 22%. This shows the effect of the public economy in total economic activities. While the French economy is much more sensitive to the size and scope of public spending, this effect is lower in the United States (Timbeau 2017).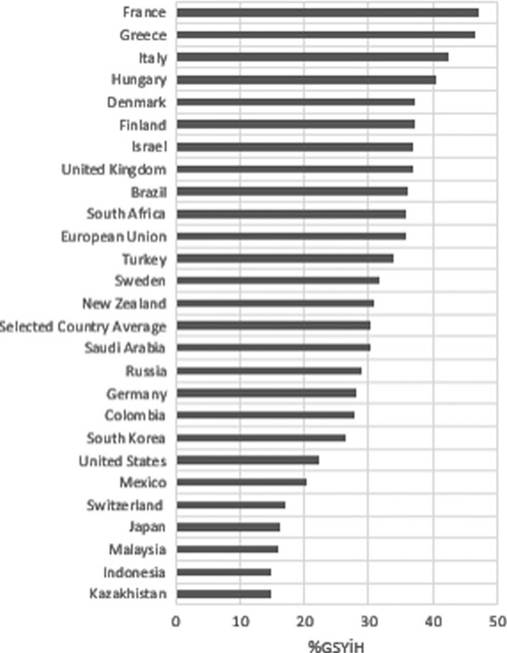
■ Pubte Expenditure (%G0P 2O18)
Fig. 3.2 Public expenditure levels of selected countries—2018 (% of GDP). Source World Bank (2020b)
3.2.2 Economic Crisis and Public Expenditures
Even though economic crises vary in themselves, they simply express periods of economic and financial breakdown. The inconsistencies in the economy dynamics cause an economic crisis. For example, excessively increasing the debt burden may lead to an economic breakdown by eliminating economic and financial sustainability (Koh et al. 2020). In this case, financial markets collapse and the crisis is reflected in the real sector. In some cases, crises arise on the basis of the real sector. Such crises negatively affect the production chain and create longer-term negative effects. On the other hand, a definition can be made as supply or demand crises based on the point at which the crisis emerged. While the 1929 Great Depression can be cited as the first demand-side crisis, supply-side crises have been experienced due to increased production growth arising from industrial revolutions and are much rarer (Cencini and Rossi 2015).
Figure 3.3 shows the “displacement” effect of economic fragility in crisis periods on public expenditures and tax revenues. With the emergence of the crisis, a sudden leap was observed in the global average of public expenditures from 25 to 29%.
Fig. 3.3 The impact of 2008 global economic crisis on public expenditures and tax revenues. Source World Bank (2020c, d)
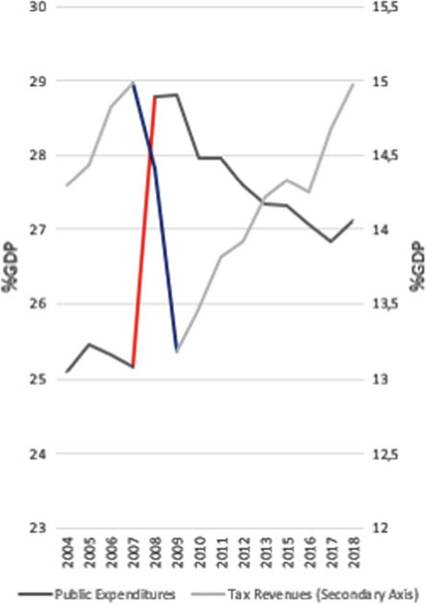
Considering that the average increased by 20% in the short term, it is clear that countries use public expenditure tools to compensate for the negative externalities of the crisis.
However, it is observed that there was a decrease in tax revenues during this period. The global average of tax revenues (% GDP), which dropped from 15 to 13.5%, barely recovered in the 10 years after the crisis. At this point, it can be said that the crisis periods damage the balance of the public economy in macroeconomic terms.Crises and emergencies cause a sudden increase in public spending, which is considered as a compensatory fiscal policy. On the other hand, in some studies, the total of public expenditures is given together with social security expenditures (Ostojic and Zmegac 2014). However, since the social security system is established in order to compensate for economic, social and physical risks, including it in the total amount may be misleading in understanding the depth of budget-based public expenditures. As a result, the actual depth of public spending, especially in countries with high elderly population density, can be misleading. However, during the 2008 Global Financial Crisis, public spending increased rapidly in all countries within the EU-15 and a conjunctural Keynesian policy was implemented (Ostojic and Zmegac 2014).
Although the 2008 Economic Crisis increased public expenditures in total, there were differences in the types of public expenditures. For example, in most countries, capital-investment expenditures declined despite increasing current expenditures. This is the policy choices put into practice by policymakers in order to find quick solutions. This situation is observed when examining the statistics of the public finance of Italy, which was deeply affected by the crisis. However, a negative opinion was presented that the relationship of this policy with growth was positive (Grisorio and Prota 2016). This relationship is mostly not observed in South American countries. Because public expenditures in these countries increased by an average of 4% during the crisis period. This shows that conjunctural Keynesian policies are not fully implemented in every region after the crisis.
Essentially, this is also related to the impact area of the global financial crisis and the economic size of the countries (Garry and Rivas 2017). In a study conducted in the former Soviet countries, it was observed that post-crisis countries had shifted to a tendency of increasing the expenditures from a tendency of limiting them on the basis of basic public services (education-health as semi-public goods) (Chubrik et al. 2011). In another study, an analysis covering the crisis period shows that public expenditures in central and Eastern European countries contribute positively to economic growth. However, during the crisis period, no significant increase/leap in public expenditures was observed in terms of GDP in many of these countries (Zugravu and Sava 2014).Increasing public spending increases the borrowing tendency and as a result, the public debt stock increases (Tanzi and Davoodi 2002). Increasing the public debt stock is important in terms of debt sustainability and fiscal discipline. On the other hand, the increase in debts increases the share of debt interest payments in the budget. After the last global crisis the world faced, the share of interest payments in total expenditures also increased. However, there are discussions about whether this has positive or negative effects. In some opinions, it is argued that public expenditures through borrowing lead to economic inefficiency (d’ Agostino et al. 2016).
Figure 3.4 shows that the borrowing tendency of countries increased by income groups after the 2008 Global Economic Crisis. Since the 2008 Global Economic Crisis was a finance-based crisis and developed countries were at the center of this crisis, the first increase in the borrowing tendency was seen in the group of high- income countries. Especially the public expenditure packages implemented by the European Union and the United States in this period and the loss of tax income as a result of the reflection of the crisis on the real sector created the need for financing in high-income countries. However, it is observed that these countries reduced their borrowing tendency after the crisis (proportional decrease in interest payments). This shows that “cyclical borrowing policy” was implemented. With the increasing borrowing tendency of low-income and middle-income countries after 2011, these countries, which had financing problems due to capital shortage, implemented borrowing policies for economic growth and development after the crisis and this was reflected in interest payments as “solid public expenditure” (World Bank 2020e) (Fig. 3.5).
The increase in the share of interest payments in public expenditures is an indicator of the borrowing tendency that emerges in the medium term. Because the reflection of interest payments on the budget occurs 1-3 years later. However, the impact of the 2008 Crisis on the borrowing tendency showed itself with an increase of approximately 20% (according to 2009-2010 data) in the borrowing tendency in 2009 right after the crisis. The increase in public spending increased the borrowing tendency (World Bank 2020g). This was reflected in interest payments. Increasing borrowing tendency is an indicator of this situation. A study found evidence in this direction.
Fig. 3.4 The course of interest payments by country groups before and after the crisis (2006-2015). Source World Bank (2020e)
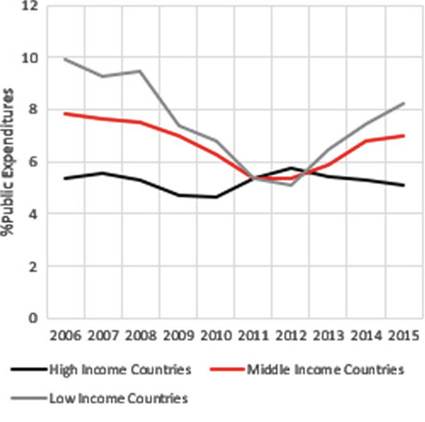
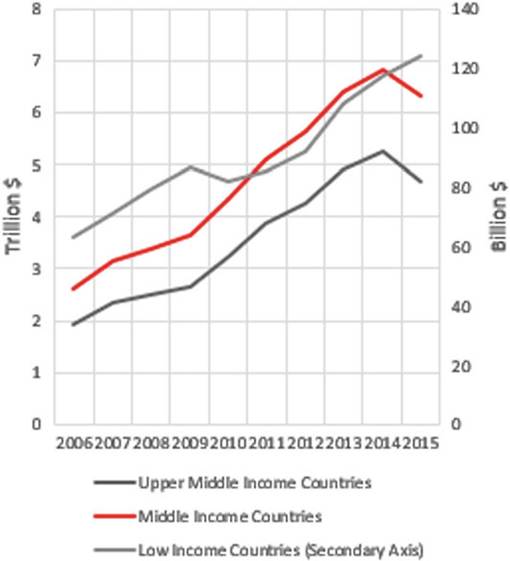
Fig. 3.5 Post-crisis external debt tendency by country groups (2006-2015). Source World Bank (2020f)
However, it is clear that borrowing poses the danger of “deterioration.” Excessive borrowing creates inefficient public spending. For this reason, it is essential to establish advanced control mechanisms. Otherwise, the share of solid public expenditures will increase with the tendency to borrow, and the situation will become unsustainable in the medium and long term (Del Monte and Pennacchio 2020). However, this situation is a result of the “conjunctural” fiscal policy as a Keynesian approach. However, this was misunderstood by Keynesians and by using continuous fiscal policy tools, high inflation, unproductivity-inefficiency, except for full employment, was created.
Especially developing countries fell into debt trap and ignored fiscal discipline. A study carried out contains new opinions in this direction. When the public expenditure data of OECD countries between 1981 and 2014 are examined, it is shown that the “asymmetric public expenditure” tendency is much higher in developing countries (Qulha 2016). In a study conducted among developed countries such as the European Region, it was emphasized that the asymmetric public spending tendency was low (it is also said that the multiplier effect was exaggerated), and countries made restrictions on spending and especially borrowing after the crisis (Boitani and Perdichizzi 2018). However, at this point, it is useful to distinguish between public expenditures. The multiplier effect of public expenditures varies according to the function of the expenditure. In another study, it has been argued that education-health expenditures, which are among public expenditures made in the same region, have a multiplier effect on the economy, while other expenditures (defense, social development, economic assistance, basic public services) have a negative effect (Lupu et al. 2018).
3.2.3 Relation Between COVID-19 Epidemic Crisis and Public Expenditures
The Global Economic Crisis of 2008 created a global economic crisis by shaking the economic stability of developed and developing countries. The crisis that emerged was overcome, especially with cyclical fiscal policies. However, the 2008 Global Economic Crisis is a financial sector-based economic crisis. The economic damage suffered by the finance sector caused a damage to the financial resource flow of the real sector. Therefore, the financial sector which lost blood was compensated economically through financial recovery packages. However, the COVID-19 Global Outbreak is very different from the 2008 Global Economic Crisis. It is an economic crisis that emerges as a result of the effect of COVID-19 as global public good (as global public bads) on the economic system in both supply and demand sides in a functioning economic exchange environment. In other words, the crisis caused an “economic breakdown” by putting all sectors in a real downsizing tendency on a global basis (Antipova 2020). This is described as “black swan”[7] in the economic literature (Morales and Callaghan 2020.
The COVID-19 Outbreak Crisis has revealed the tendency to contribute to economic policy with public expenditure tools in many countries. Because the supply and demand-side economic crises that started with the epidemic threatened economic stability. As a result of the pause in the supply and supply chain in the market due to the epidemic and the decrease in production and consumption demand due to the epidemic, the global economy entered a “forced recession-shrinkage” period. As a result of the period lived, the ordinary work flows of the sectors are decreasing. Additional financing needs arise with the change of work flows. Otherwise, economic stability will deteriorate in many countries and basic economic problems will deepen. For this reason, a cyclical public spending increase policy will ensure that the supply in the market is sustained and demand is maintained through the real sector channel. In this context (Fig. 3.6.) shows the revenue that the public sector has given up on (tax expenditure) in order to protect the market supply and demand and the ratio of
Fig. 3.6 Public expenditures after the COVID-19 outbreak in selected countries. Source IMF (2020a)
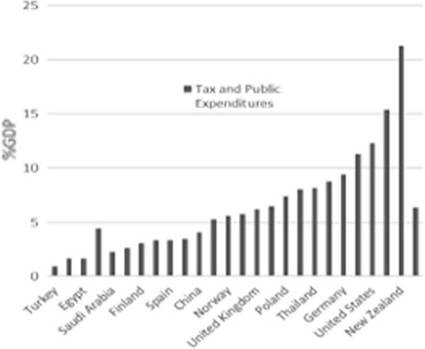
public expenditures to GDP on country basis. The selected countries in the relevant chart have been selected from the prominent countries during the epidemic period and developed and developing country groups. The rate of increase in public expenditures in terms of GDP of selected countries is 6.38. Considering that the global public expenditures increase in 2008 was around 20%, it can be said according to preliminary estimates that public expenditure instruments were preferred at a lower rate during the COVID-19 outbreak. However, trends in this direction may increase in the future. Because the European Union approved a large expenditure budget of 1.8 Trillion Euros to support member countries to combat the epidemic crisis (AB 2020) (Fig. 3.7).
Fig. 3.7 Public expenditure growth by country groups after the global outbreak (% of GDP). Source IMF (2020a)
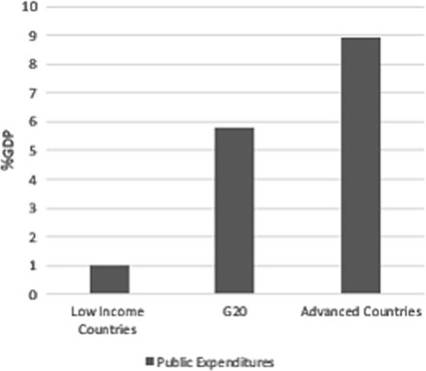
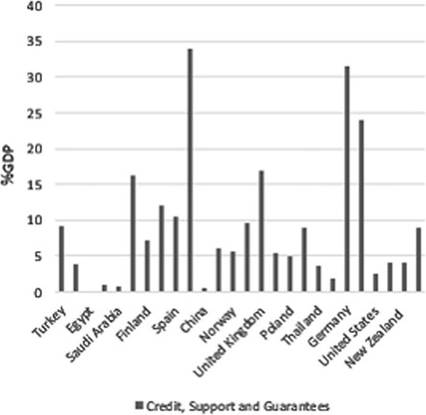
Fig. 3.8 Credit, support and guarantees (% GDP) in combating the COVID-19 outbreak. Source IMF (2020a)
Considering the average of the public expenditures of the countries according to the country groups during the COVID-19 Outbreak, it is seen that the most spending was made by the developed countries. This shows that high-income capitalist countries do not hesitate to use public expenditure instruments. It is observed that as the income level of the countries decreases, the tendency to use public expenditure instruments decreases. Some countries, on the other hand, used much lower rates of public expenditure instruments, contrary to income groups. Turkey,[8] Mexico, France, Russia, Saudi Arabia, Spain, Italy and Indonesia have lagged behind the average public expenditure on using the tool. This is the result of the decisions taken by governments and the country’s economic and financial structure.
In addition to the use of public expenditures during the fight against the COVID- 19 Outbreak, it is seen that many countries have used credit-supported financing tools.
Figure 3.8 reveals the economic magnitude of loans, supports and guarantees in selected countries. When the two charts (Chart-7 and Chart-8) are compared, an inverse preference method is observed between public expenditure and loanguarantees. It is observed that the countries that have used public expenditure instruments extensively, used credit support and guarantees less as a policy tool. On the other hand, it is seen that countries that use public expenditure instruments insufficiently prefer policies with credit support and guarantees (Fig. 3.9).
Credit support and guarantees are liquidities that are offered to the market as an alternative to public spending instruments. Loans, supports and guarantees offered
Fig. 3.9 Credit support and guarantee utilization increase by country groups after the global outbreak (% of GDP). Source IMF (2020a)
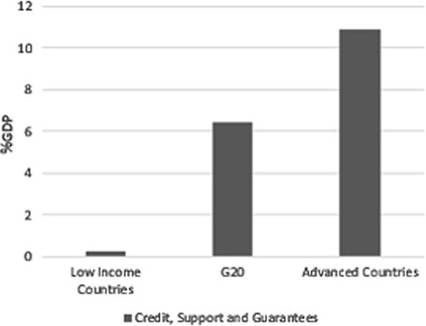
to the market in order to avoid an economic crisis with the disruption of the flow of money in the market as a result of the disruption or slowdown of the business flow are mutual borrowing instruments. In this context, loans, supports and guarantees, which were used as a policy tool to compensate for the external costs and economic risks caused by the COVID-19 Outbreak, were used as an alternative tool of fiscal policy. Considering the use of public expenditures and loans, supports and guarantees in GDP, it is seen that loans, supports and guarantees are used more, depending on the level of development. It is seen that only low-income countries use loans, supports and guarantees less than public expenditures. The reason for this situation is the insufficient financial power of low-income countries and the relatively less borrowing power of the market. On the other hand, with the COVID-19 Outbreak, it is seen that the borrowing tendency of low-income developing economies to make investment increased by 9% of their GDP (IMF 2020b: 12).
The evaluation of public spending and loans supports and guarantees in terms of GDP shows how much the countries use fiscal policy tools in combating the COVID-19 Outbreak. However, it will be useful to evaluate in terms of quantity as well as evaluation in terms of GDP. In this respect, looking at the health expenditure dimensions of countries and countries with public expenditures over 48 billion dollars ($) by proportioning them to the population will reveal which government spends more per capita.
With the COVID-19 Outbreak, many countries have increased their spending instruments by ignoring their fiscal constraint in order to combat the epidemic. However, the study reveals that as the income level of the country decreases, the effect of the fiscal constraint factor increases and public expenditure instruments are used less. On the other hand, 12 countries that spend the most in terms of amount based on IMF data are evaluated in Table 3.1. In the research, it is seen that although countries increase their public expenditures, health expenditures remain at a relatively low level within the epidemic expenditures. In Table 3.1., it is seen that the country that uses public expenditure instruments the most in the fight against the
Table 3.1 Countries with the most public spending with COVID-19 Outbreak (Billion $)
| Countries | Public expenditures (Billion $) | Health expenditures (Billion $) | Public expenditures/population | Health expenditures/population |
| Germany | 332 | 25 | 3.9 | 0.29 |
| Australia | 110 | 3 | 4.0 | 0.12 |
| Brazil | 86 | 12 | 0.4 | 0.05 |
| United States | 2.443 | 304 | 7.4 | 0.92 |
| United Kingdom | 155 | 8 | 2.27 | 0.11 |
| China | 625 | 22 | bgcolor=white>0.430.01 | |
| France | 63 | 9 | 0.94 | 0.13 |
| Japan | 551 | 38 | 4.37 | 0.30 |
| Canada | 86 | 3 | 2.26 | 0.07 |
| South Korea | 48 | 4 | 0.94 | 0.07 |
| Singapore | 52 | 1 | 9.45 | 0.18 |
| Italy | 60 | 7 | 1.0 | 0.11 |
| Average | 384 | 36 | 3.1 | 0.19 |
Zeros are not taken into account in the Expenditure/Population accounts. Color saturation is in 4 varieties across 12 countries. The 4 countries with the highest values in the respective category have dark boxes. As the darkness decreases, the rating goes down
Source IMF (2020a)
COVID-19 Outbreak is the United States. Japan and Germany, on the other hand, show the best performance in all categories (excluding public expenditure/population for Germany) following the United States. On the other hand, among the selected countries, Singapore is seen to among the average country with the highest per capita epidemic expenditure. When traveling to the Far East, it is seen that Japan and China use public spending tools. However, it is clear that more spending should be made, as the per capita public expenditure of China is very low. Brazil is similar to China in this regard. Brazil’s public spending was relatively inadequate compared to the population.
Loans, supports and guarantees have been a preferred financial tool by many countries in combating the COVID-19 Pandemic. The use of public spending as a fiscal policy tool in combating the COVID-19 Pandemic has been more limited compared to loan support and guarantees. On the other hand, some countries (generally developed economies) followed a balanced policy and used both public spending and financial supports together. Some countries (Turkey, India) intensely used loans, support and guarantees as policy tools. Loans, supports and guarantees enable economic activities to continue by borrowing through increasing the liquidity required by the market.
Some of these borrowings are guaranteed. Guarantees are guaranteed by official and semi-official funds. Looking at the table above (Table 3.2.), Japan and Germany
Table 3.2 Countries with the most credit support and guarantee with the COVID-19 outbreak (Billion $)
| Countries | Credit, support and guarantees (Billion $) | Credit and supports | Guarantee and semi-official financial operations | Credit, support and guarantees/population |
| Germany | 1.155 | 219 | 896 | 13.9 |
| European Union | 443 | 372 | 71 | 0.99 |
| Belgium | 57 | 0.2 | 56.8 | 3.8 |
| Brazil | 71 | 14.5 | 56.5 | 0.33 |
| United States | 510 | 56 | 454 | 1.5 |
| United Kingdom | 423 | 1 | 422 | 6.22 |
| China | 80 | 20.8 | 59.4 | 0.05 |
| France | 380 | 23 | 357 | 5.67 |
| India | 145 | 7.3 | 124.3 | 0.10 |
| Japan | 1.169 | 0 | 1.169 | 9.1 |
| Canada | 50 | 3 | 47 | 1.31 |
| South Korea | 149 | 0 | 149 | 2.9 |
| Spain | 126 | 0 | 126 | 2.68 |
| Italy | 583 | 4 | 579 | 9.71 |
| Turkey | 63 | 3 | 60 | 0.75 |
| Average | 360 | 48 | 308 | 3.9 |
Source IMF (2020a)
are the countries that use the most financial resources on a global scale. However, only Germany is the top country in all categories. Although loan supports and guarantees are important for the functioning of the market and the financing requirement, they carry financial risks. Some countries and sectors are likely to experience a financial crisis in the medium term as the loans, supports and guarantees given increase borrowing tendency and increase their debt stock ratios. For this reason, revitalizing the market with cyclical Keynesian policies is important in terms of ensuring economic recovery without derailing.
In this context, the International Monetary Fund (IMF) pointed out that, if governments cut public spending to compensate for economic costs of the pandemic and for a smooth economic recovery, that would be “a policy that will derail the economic recovery” (Gaspar and Gopinath 2020) (Fig. 3.10).
While public expenditures constitute the spending pillar of the fiscal policy, taxes and public debts constitute the revenue and borrowing policy and general fiscal policy. It is not correct to consider only expenditure policy in order to increase and measure the efficiency of fiscal policy. In this context, addressing borrowing and taxing trends
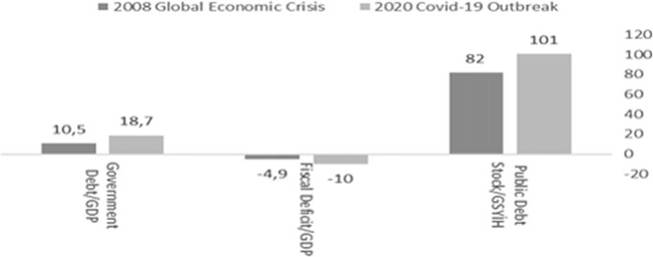
Fig. 3.10 Comparison of COVID-19 outbreak and borrowing-COVID-19 outbreak with 2008 global economic crisis according to debt statistics. Source IMF (2020c)
during the COVID-19 Outbreak will reveal the fiscal policy trend of many countries at the global level. Considering the global financial trends, it is seen that the borrowing tendency increased and the fiscal balance deteriorated more during the epidemic period. The increase in the spending trend has created a borrowing requirement in many countries,[9] and according to IMF estimates, the global borrowing rate exceeded 100% (this rate was 82% in 2009) with the COVID-19 Outbreak, compared to the 2008 Global Economic Crisis (IMF 2020c: 20).
The public sector, whose financial power has increased with the increase in borrowing tendency, should follow a progressive policy in taxation policy in the long run in terms of sustainability of financial power (Gopinath 2020). However, the COVID-19 Outbreak does not make it possible to implement this policy in the short term. Governments whose tax efforts and tax capacity rates have declined due to the pandemic will bear the loss of tax revenues in order not to decrease the monetary capability of the market and to deepen the economic recession. During this period, the taxation policy should be flexible and reliable. A tax policy that increases the tax burden of individuals and institutions that strain the sectors during the crisis will increase the recession and increase the duration and depth of the crisis (OECD 2020: 36). For this reason, flexibility and determination should be based on the new tax rules. It is necessary to provide financial support to households and institutions and control the increase in unemployment. Contribution to economic recovery should be made by applying tax expenditure instruments. However, the efficiency of tax policy is directly proportional to the adaptation of tax systems to economic and social structure. Increasing digital activities with the COVID-19 Outbreak caused commercial activities to shift onto digital channels. Moreover, there are many other processes that are expected to change. Therefore, tax administrations and governments need to modernize their tax systems (OECD 2020).
Fig. 3.11 EffectofGDPon Tax Income by Country Groups (The relevant chart shows the effect of a 1% GDP change that will occur in country groups on tax revenues. The shaded area gives all possibilities with the top and lowest points). Source OECD (2020: 38)
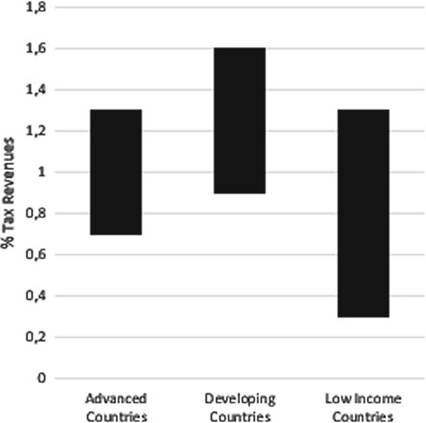
On the other hand, the COVID-19 Outbreak also complicates the prediction of tax revenues. The continuity of tax revenues is important in terms of fiscal discipline and continuity of public services. The uncertainty that arose with the COVID-19 outbreak threatens the continuity and sustainability of economic activities. As a result, an uncertainty may arise regarding the generation of public revenues (IMF 2020e). Therefore, the effect of GDP change on tax revenues is important. In this context, the relevant chart (Fig. 3.11) shows the effect of a 1% GDP change in country groups on tax revenues. The shaded area gives all possibilities with the top and lowest points. According to Fig. 3.11, the effect of GDP change on tax revenues is the highest in developing economies. It can be said that the countries with the highest risk of tax revenues during the COVID-19 Outbreak are those with a developing economic structure.
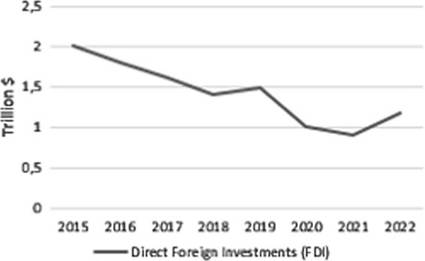
On the other hand, private sector expenditures are decreasing contrary to the increasing public expenditures trend. As for the direct foreign capital-investment tendency, which shows the spending tendency of the private sector best among the global economic indicators, the expenditure tendency of the private sector for investment purposes decreased by 40%, and the total investment was much lower than the 2008 Global Economic Crisis (UNCTAD 2020a) (Fig. 3.12).
The COVID-19 Outbreak Crisis has had direct impacts on foreign direct investment and will have potentially lasting consequences. The sudden and simultaneous interaction of supply and demand-side shocks, combined with policy responses to the global crisis, triggers a series of effects on foreign direct investment (UNCTAD 2020a). Upon the COVID-19 Outbreak, the expenditure and investment trends of the private sector have decreased as a result of the epidemic affecting the amount of supply and demand and the disruption of the supply chains. For this reason, in this
Fig. 3.12 Direct foreign investment as COVID-19 outbreak and private sector expenditure (2015-2022). Source UNCTAD (2020a)
period, governments should protect and support critical sectors and companies from the adverse economic conditions after the epidemic. At this point, a great burden falls on the public economy. Conjunctively, it is normal that the share of the public economy in the total economy increased in this period. In this context, many countries resort to expropriation by purchasing the shares of important companies in the sectors affected by the crisis. Such methods are preferred to protect national capital and continue post-epidemic economic activities (UNCTAD 2020b).
Otherwise, because the crisis is unlike any previous modern crisis, it is likely that socio-economic effects will emerge and the crisis will deepen. In this context, evaluations are made on the possibility of the crisis turning into a social crisis as a result of the unemployment explosion with the COVID-19 Outbreak Crisis (OECD 2020). In fact, comparing the impact of the epidemic crisis on unemployment with the 2008 Global Economic Crisis, experts point out that the COVID-19 Outbreak caused a much deeper unemployment (IMF 2020e).
3.3